 Research Article
Relationship between Intra Ocular Pressure and Visual Acuity in Port Harcourt, Nigeria
Chibuike Sydney Ejimadu* and Awoyesuku EA
Chibuike Sydney Ejimadu, Department of Ophthalmology, University of Port Harcourt, Nigeria.
Received Date: May 17, 2019; Published Date: May 28, 2019
Abstract
Aim: To determine the relationship between intra ocular pressure and visual acuity among patients attending a private eye clinic in Port Harcourt Nigeria
Methods: This was a retrospective study done in a private hospital in Port Harcourt. The first one hundred patients attending the hospital in 2013 that met the inclusion criteria were recruited for the study. Those with corneal diseases/lesions were excluded. Medical history was recorded, and comprehensive ocular examination done on each of the 200 eyes of 100 subjects (59 males and 41 females). Ocular examination included visual acuity, ophthalmoscopy, visual field and tonometry. Instruments used during the research were Snellen’s charts both literate and illiterate charts for visual acuity assessment, Pen torch for examination of the external structures of the eyes, Keeler ophthalmoscopes for fundus examination, Reichert AT 555 Auto non-contact tonometer for measurement of the intra-ocular pressure. Data analysis was performed using the Statistical Package of Social Sciences (SPSS) version 20.
Results: There were 200 eyes of 100 subjects in this study comprising 59 males and 41 females (M: F=3:2). The mean age was 45.83±20.43years. The mean IOP was 16.18±6.13 for right eye and 16.82±8.22mmHg for left eye. 66.25% of eyes with normal IOP had good vision (VA ≤6/18) while only 3.75% were blind VA >3/60. 50% of eyes with elevated IOP had good vision (VA ≤6/18) while 15% were blind (VA >3/60). Fisher’s exact test =6.022; p-value =0.099. Statistically significant p<0.25 set at bivariate analysis.
Conclusion: This study shows a statistically significant inverse relationship between intraocular pressure and vision, that is, elevated IOP is related to reduced visual acuity.
Keywords: Elevated intra ocular pressure; Visual acuity; Relationship; Port harcourt
Introduction
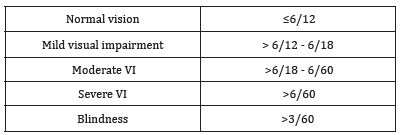
Intraocular pressure (IOP) is the fluid pressure inside the eye and the normal value is 10-21 mmHg [1]. Elevated intraocular pressure is a major risk factor for the development of primary open-angle glaucoma, and even in normal tension glaucoma the reduction of IOP may slow the progression of visual field loss [2]. It is the only proven treatable risk factor. People with a high IOP (>21mmHg) with no proof of having primary open-angle glaucoma are considered at risk of developing optic nerve damage, even if they do not suffer from any ocular disease [3]. Different factors like age and sex among others influence IOP [4,5]. Visual acuity is defined as the “spatial resolving capacity” of the eye or, put another way, the size of an object that can be resolved with an eye. It can be measured by identifying the angle subtended at the eye by the smallest recognizable optotype. Theoretically, this represents macular function, but really it represents the state of the entire ocular system, including the visual pathways [6]. In practice, measurement of visual acuity is performed using specialized eye charts. These charts usually consist of uppercase letters arranged in rows with the largest letters at the top of the chart and progressively smaller letters down the chart. There are numerous charts used for visual acuity testing, but the most common charts are the Snellen and ETDRS charts [6]. A visual acuity of ≤6/12 is considered normal according to the international classification of diseases 11(2018). See the table below (Table 1).
Table 1: The International Classification of Diseases 11(2018) for Distant visual impairment.
Some factors that can affect vision are refractive error, keratopathy, cataract, vitreous and retinal diseases, neuropathies etc. [7]. High IOP can lead to optic nerve damage and cause loss of vision. The higher the value of IOP the more likely it is to impair vision. This is why the main stay in the management of glaucoma is pressure lowering. The longer the IOP stays elevated the more the vision is affected [8]. Intraocular pressure (IOP) correlates with progressive loss of visual field as well in patients with glaucoma [9]. Decreasing IOP has been proven to reduce progressive loss of the visual field. This is true both for glaucoma patients with IOPs above or within the normal range. For individuals with ocular hypertension (high IOP but no evidence of glaucomatous neuropathy), lowering IOP may reduce the risk of developing glaucoma. Some studies have shown scientific evidence that supports the importance of lowering IOP in patients with glaucoma or ocular hypertension [9]. A study in Nigeria showed that intraocular pressure increases during the luteal phase of the menstrual cycle in normal female subjects, an effect that could relate to mildly impaired vision [10].
Methods
This was a retrospective study done in a private hospital in Port Harcourt. The first one hundred patients attending the hospital in 2013 and met the inclusion criteria were recruited for the study. Those with corneal diseases, cataract, vitreous and retinal pathologies were excluded. Medical history was recorded, and comprehensive ocular examination done on each of the 100 subjects (59 males and 41 females). Ocular examination of the 200 eyes of 100 subjects included visual acuity, visual field, tonometry and ophthalmoscopy. Instruments used during the research were Pen torch for examination of the external structures of the eyes, Keeler ophthalmoscopes for fundus examination, Snellen’s charts both literate and illiterate charts for visual acuity assessment, Reichert AT 555 Auto non-contact tonometer for measurement of the intra-ocular pressure. Data analysis was performed using the Statistical Package of Social Sciences (SPSS) version 20. The independent variables were age, sex and visual impairment based on visual acuity while the dependent variable was elevated IOP. Bivariate analysis was performed using Chi square statistics for comparison of proportions and independent t test for comparison of means. Statistical significance was set at a level of 0.25 on bivariate analysis. Statistically significant independent variables on bivariate analysis were dichotomized and then entered into a multivariate analysis model. Multivariate analysis employed an unconditional binary logistic regression model with confidence interval set at 95% level and p-value of less than 0.05 considered significant.
Results
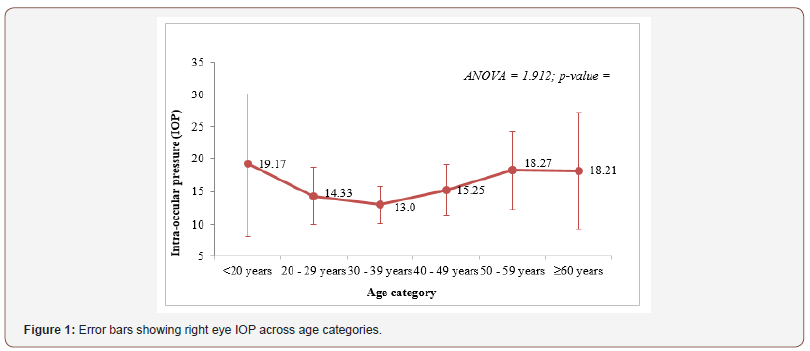
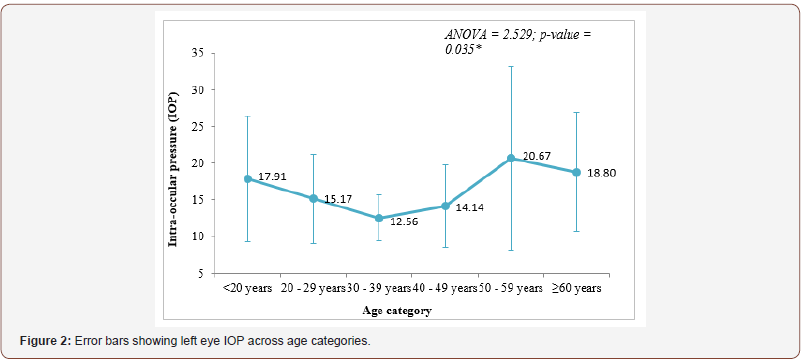
(Tables 2-6) & (Figures 1&2).
Table 2: Presentation of right and left eye VA of respondents.
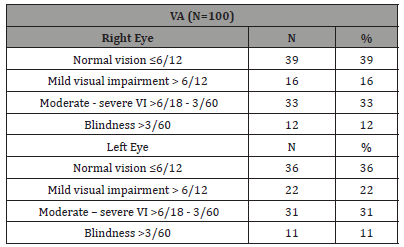
Table 3: Mean IOP in right and left eye of respondents.

Table 4: Comparison of visual acuity findings by IOP category (elevated/ not elevated).
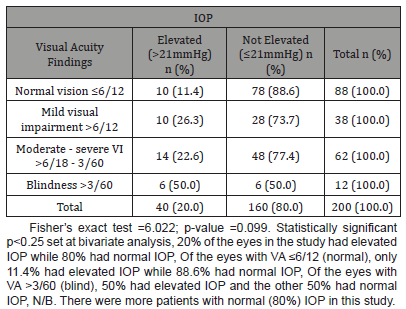
Table 5: Comparison of visual acuity findings in eyes with normal IOP.
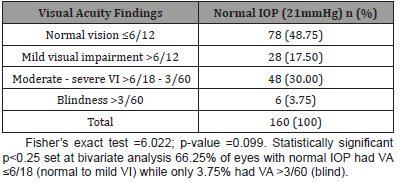
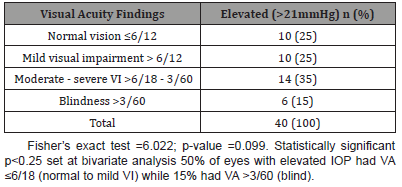
Table 6: Comparison of visual acuity findings in eyes with elevated IOP.
Discussion
Seventy-five eyes (37.5%) had normal vision, 19% had mild visual impairment, 32% moderate visual impairment while 11.5% were blind Table 2. These figures are higher than those in the findings by Mariotti and Pascolini, where it is estimated that 4.25% of people globally are visually impaired [11]. This low figure is attributed to the fact that W.H.O definition employed by Mariotti defines visual impairment only if it is in the better eye whilst our study considered each eye in isolation.
Two hundred eyes of the 100 subjects were examined and 20% of the eyes had elevated IOP while 80% (majority) of the eyes had normal IOP. The mean IOP of the eyes was in the mid normal (16±mmHg) value Table 3. This is in agreement with the study by Hoehn and Mirshahi [3].
Of the eyes with normal vision (VA ≤6/12), 88.6% had normal IOP while only 11.4% had elevated IOP. It is expected that eyes with good vision will be associated with less pathologies as seen in our study and collaborated by Mariotti [11].
Of the blind eyes (VA>3/60), 50% had elevated IOP Table 4. Elevated IOP is a known risk factor of glaucoma and leads to blindness if not properly managed as reported in many studies. Therefore, IOP control is the mainstay in the preservation of vision in glaucoma treatment [7-9].
A total of 66.25% of eyes with normal IOP had normal vision i.e VA ≤6/18 while only 3.75% were blind with VA >3/60. There were more subjects with normal to mild visual impairment in the group with normal IOP Table 5. This is similar to the findings elsewhere [12,13].
A total of 50% of eyes with elevated IOP had VA ≤6/18 while 15% had VA >3/60 (blind). There were more blind subjects in the group with elevated IOP Table 6. This lends credence to the fact that elevated IOP is a risk factor to the development of visual impairment and blindness [2,7,9].
Conclusion
This study shows a statistically significant inverse relationship between intraocular pressure and vision, that is, elevated IOP is related to reduced visual acuity. The higher the IOP the more likely it is for the vision to be impaired.
Acknowledgment
None.
Conflicts of Interest
No Conflicts of interest.
References
- Klein BEK, Klein R, Linton KLP (1992) Intraocular pressure in an American community: The Beaver Dam eye study. Invest Ophthalmol Vis Sci 33(7): 2224-2228.
- Carly Seidman, Gustavo De Moraes, Rafael Furlanetto, Jeffrey Liebmann, Robert Ritch (2013) The Relationship Between Visual Acuity, Intraocular Pressure, and Rates of Visual Field Progression Using 10-2 Perimetry. ARVO Annual Meeting Abstract 54(15): 3930.
- Hoehn R, Mirshahi A, Hoffmann EM (2013) Distribution of intraocular pressure and its association with ocular features and cardiovascular risk factors: The Gutenberg Health Study. Ophthalmology 120(5): 961-968.
- Sanaa AY, Elham RA (2016) Age, gender and refractive error association with intraocular pressure in healthy Saudi participants: A crosssectional study. Saudi J Ophthalmol 30(1): 44-48.
- Ejimadu CS, Chinawa NE, Fiebai B (2018) Age and Gender Related Changes in Intraocular Pressure among Patients Attending a Peripheral Eye Clinic in Port Harcourt, Nigeria. Austin J Clin Ophthalmol 5(2): 4.
- Peter K Kaiser (2009) Prospective Evaluation of Visual Acuity Assessment: A Comparison of Snellen Versus ETDRS Charts in Clinical Practice. Trans Am Ophthalmol Soc 107: 311-324.
- Niesel P Flammer J (1980) Correlations between intraocular pressure, visual field and visual acuity, based on 11 years of observations of treated chronic glaucomas. Int Ophthalmol 3(1): 31-35.
- Lim H, Kim M, Jo Y, Kim J (2016) Short-Term Visual Acuity and Intraocular Pressure Changes and Their Correlation after Anti-Vascular Endothelial Growth Factor Injection. Ophthalmologica 236(1): 36-42.
- Goldberg (2003) Relationship Between Intraocular Pressure and Preservation of Visual Field in Glaucoma. Surv Ophthalmol Volume 48(2): S3-S7.
- Ebeigbe JA, Ebeigbe PN (2012) Intraocular pressure and visual acuity across the phases of the menstrual cycle in Nigerian women. Ebonyi Medical Journal 11: 1-2.
- Mariotti S, Pascolini D (2010) Visual impairment, vision loss and blindness 2010 global estimates, and VI and blindness causes. Global data on visual impairments WHO, USA.
- Vogel R, Crick RP, Newson RB, Shipley M, Blackmore H, et al. (1990) Association between intraocular pressure and loss of visual field in chronic simple glaucoma. Britishournal of Ophthalmology 74(1): 3-6.
- Panchami, Pai SR, Shenoy JP, Shivakumar J, Kole SB (2013) Postmenopausal intraocular pressure changes in South Indian females. J Clin Diagn Res 7(7): 1322-1324.
-
Chibuike Sydney Ejimadu, Awoyesuku EA. Relationship between Intra Ocular Pressure and Visual Acuity in Port Harcourt, Nigeria. W J Opthalmol & Vision Res. 2(1): 2019. WJOVR.MS.ID.000529.
-
Intra ocular pressure, Visual acuity, Corneal diseases/lesions, Ophthalmoscopy, Visual field, Tonometry, literate, Illiterate charts, Visual acuity assessment, Keeler ophthalmoscopes, Optic nerve, Glaucomatous neuropathy, luteal phase, Corneal diseases, Cataract, Vitreous, Retinal pathologies.
-

This work is licensed under a Creative Commons Attribution-NonCommercial 4.0 International License.


