

 Research Article
The Effectiveness of Soil and Water Conservation as Climate Smart Agricultural Practice and Its Contribution to Smallholder Farmers’ Livelihoods. The Case of Bambasi District Benishangul Gumuz Regional State, Northwest of Ethiopia
Received Date: June 10, 2019; Published Date: June 26, 2019
Abstract
This study is an investigation of effectiveness of soil and water conservation practices as climate smart agriculture and its’ contribution to the livelihoods of smallholder’s farmers in Bambasi District of Northwestern Ethiopia. It was hypothesized that there is no relationship between factors contributing to the adoption of SWC technologies and a number of SWC technologies adopted, as well as there is no relationship between the number of SWC technologies used by farmers and access to the livelihood assets. In order to address the objectives, both primary and secondary data were used for the study. The study applied a non-experimental design (explanatory) to collect primary data from a sample of 270 households drawn from the three Kebeles. Stratified random sampling technique was also used along with the simple random sampling technique in each stratum. The data collected was then analyzed by inferential statistics such as chi-square by using STATA 14.2 and Microsoft office Excel. Perceptions The study found out that most adopted SWC technologies are crop rotation, level bund, agricultural inputs and Fanya Juu terraces, of which few of them were considered as effective while the main factors influencing their adoption are farm size, having livestock, crop yield, farmers’ perception of the soil erosion problem, access to extension services and experience, availability of inputs support and steep slope. It was found that 9.3% of respondents adopt at least one technique while 37.8% use the four identified SWC technologies. The results revealed that respondents have access to livelihood assets (natural, human, social, physical and financial assets) found in the area of study. The statistical test showed that farm size, crop yield, perception of soil erosion, availability of inputs supports, the availability of training and access on it as well as farmers’ experience, Natural and social assets and steep slope have a connection with adoption of SWC technologies, while the others not. The study concluded that most of the participants were willing to maintain soil as a valuable resource and apply SWC technologies for maximizing their benefits but expressed the need for the continuing support of the implementation. Further, it also brings to a close that conservation efforts ought to focus on areas where expected benefits are higher, especially on the steeper slopes, in order to encourage the use of the SWC technologies.
Keywords: Adaptation; Livelihood assets; Agricultural technology; Small holders; Soil erosion
Backgrounds of the Study
Globally, large areas of land are being affected by land degradation, partly resulting from unsustainable land use. This is particularly the case in developing countries, which are especially vulnerable to overexploitation, inappropriate land use, and climate change. Bad land management, including overgrazing and inappropriate irrigation and deforestation practices often undermines productivity of land [1]. In the context of productivity, land degradation results from a mismatch between land quality and land use [2]. Land degradation as a result is a biophysical process driven by socioeconomic and political causes [3].
Land degradation is related to climate and soil characteristics, but mainly to deforestation and inappropriate use and management of the natural resources, soil and water. It leads both to a nonsustainable agricultural production and to increased risks of catastrophic flooding, sedimentation, landslides, etc., and the effects of global climatic changes [4].
The problems of soil and water degradation and derivative effects are increasing throughout the world, partially due to a lack of appropriate identification and evaluation of the degradation processes and of the relations causes-effects of soil degradation for each specific situation, and the generalized use of empirical approaches to select and apply soil and water conservation practices [5].
In addition to the negative effects on plant growth and on productivity and crop production risks, soil and land degradation processes may contribute, directly or indirectly to the degradation of hydrological catchments, affecting negatively the quantity and quality of water for the population and for irrigation or other uses in the lower lands of the watershed [5]. The productivity of some lands has declined by 50% due to soil erosion and desertification. Yield reduction in Africa due to past soil erosion may range from 2 to 40%, with a mean loss of 8.2% for the continent. In South Asia, the annual loss in productivity is estimated at 36 million tons of cereal equivalent valued at US $5,400 million by water erosion, and US $1,800 million due to wind erosion. It is also estimated that the total annual cost of erosion from agriculture in the USA is about US $44 billion per year, that is about US $247 per ha of cropland and pasture.
On a global scale the annual loss of 75 billion tons of soil cost the world about US$ 400 billion per year, or approximately US $70 per person per year. Thus, land degradation will remain an important global issue of the 21st century because of its adverse impact on agronomic productivity, the environment and its effect on food security and the quality of life [3]. Soil loss was estimated by using the universal soil loss equation calibrated from field data collected on more than 19,000 fields. Seasonal soil losses ranged from 1 t/ha (0.4 ton/acre) to 143 t/ha (63.8tons/acre); the average seasonal soil loss was 5 t/ha (2.2 tons/acre). Soil loss in Ethiopia showed a pattern of regional differences that closely followed variations in rainfall and topography. The development of regional strategies to minimize agricultural erosion is likely to be more effective than a single national policy [6].
The study carried out in different areas in Ethiopia showed that the effects of soil degradation and water shortages on crop productivity have induced researchers to introduce some innovative practices such as mulching, bunding, contour ridging, ripping, minimum tillage and others check the down wardspiral in agricultural production. Varied soil and water conservation practices requiring varied farmer inputs have been promoted among farmers for over a decade now [7,8].
Materials and Methods
Materials used
The study was conducted in Benishangul Gumuz regional state, in Bambasi Woreda, which is one of the twenty Woredas of the region. Bambasi Woreda is found 45km far from Asossa town which is the capital city of the region. It is located in the northern part of the region between09° 47’ North latitude and 34°47’ East longitude (Figure 1).The Woreda is bordered by Oromia regional state and Maokomo special Woreda in the south and south west and, Asossa Woreda in the west and Oda Buldegelu Woreda in the north east.

Administratively, the Woreda is divided into 38 kebeles. 19 kebeles are inhabited by indigenous people, 17 kebeles are settled areas created during the Dreg regime and 2 kebeles are under the municipality of Bambasi town. And also new refugee camp is found in the Woreda. Based on the document analysis of the Bureau of Agriculture, Woreda Agricultural and rural development office and Woreda rural land administration and use office, there are several Kebeles which have encountered intense land cultivation in the Woreda. These includeSonka, Keshmando-qutir 5, Sisa qutir1, Bashimakergige, Womaba-Selema, Bambasi 02, Amba 16, Mutsa, Jematsa, Sonka and Mender 55 (Figure 1).
Based on CSA [9] data, the total population of the Bambasi Woreda is about 70,350 people. The peoples found in this Woreda are composed of a variety of ethnic groups including Berta, Amhara, Oromo, and Tigre. There are also refugees from South Sudan in the woreda. In 2014 the total number of households is 12,539 of which 11,912 were male headed and 627 were female headed. Their livelihood structure is mainly depending on agriculture and traditional gold mining.
The Woreda covers an area 472,817 hectares, of which 221,016 hectares are used for cultivation but now a day only 72,379 hectares are cultivated land, 10,000 hectares are pastureland, 63,756 hectares are non-cultivated land and 174,820 hectares are forest area, 1,200 hectares are mountain area, 1,797 hectares are irrigation area, 228 hectares are perennial crop area. The major food crops or cereals grown in the area are maize, sorghum and teff. Oil crops and other crops are also produced in the area. The average land holding is 4.65 hectares per household.
The main economic base of the woreda is farming, where major crops are maize and sorghum. There has been no crop rotation during the last several years. The average productivity of maize per hectare in Bembasi is stated to be 60 quintals with the application fertilizers and for sorghum it is about 25 quintals. These yield figures are considered good for these acidic acrisoils, with low fertility. Experts still believe the yields can be increased. Fishing and mining in Dabus River are further practiced by the Berta ethnic group both as a supplementary economic and as a food source. This river serves as a regional boundary between Oromiya and Benishangul- Gumuz. A Sustainable Land Management (SLM) project is on-going and soil and water conservation activities are widely undertaken with the support of different NGOs and the regional agricultural research center. Fertilizer application has been improving in the last couple of years and now the communities have recognized that it is impossible to produce without fertilizer. However, the use of fertilizers is still low compared to other developed regions of the country.
Bambasiworeda is found in the southern part of the Assosa City. Climate data from the nearest meteorological stations Amba 16 (only rainfall, from 2005-2018) was extracted and presented in Figure 2 and the woreda is located at 9o 57’ 12.4’’ N Latitude and 34 o 39ʹ 21.7ʹʹ E Longitude, with an altitude of 1554 m.a.s.l.
The average annual rainfall is 1381.42 mm, while the mean annual maximum temperature is 28.37 °C. The area is characterized by unimodal rainfall distribution with the rainy season extends from March to November and one distinct short dry season extending from December to February (Figure 2). Typically, during the onset of the main rainy season, the first two months receive small amount and gradually reach to its peak in August. More than 55% of the mean annual rainfall falls from June to August.

The mean maximum monthly temperature is about 28.37° C. Mean maximum monthly temperature reaches to its peak during March followed by April and February, with a temperature of 32.69° C, 32.05° C and 31.96° C, respectively; whereas, the lowest mean minimum monthly temperature occurs during December with a temperature of 13.28° C. This climate diagram of Bambasi Woreda shows water stress in January, February and November, and excess water in May, June, July August and September. The red line is temperature, measured on the left axis. The purple line is precipitation, measured on the right axis (Figure 2).
Research methodology
Descriptive statistics of farmers’ characteristics, socioeconomic and environmental characteristics, geographical characteristics, factors of adoption of SWC technologies and their benefit will be analyzed. These statistics included descriptive and chi square statistics. This was helped to outline the influence of farm characteristics and socioeconomic and environmental characteristics as well as their expected outcomes from adoption of SWC technologies in their farm’s location. The study targeted smallholder-farmers whose farms were located in areas prone to soil erosion and applied soil and water conservation technologies in their farms. The sample size of this study was calculated based on the following formula Krejcie & Morgan (1970):
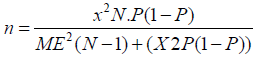
Where:
n: required sample size
X: Z value (confidence level – standard value of 1.96)
N: total number of farmers living in the study area:
P: Standard deviation (standard value of 0.5)
ME: Margin error at 5% (standard value of 0.05)
The method which is used during the research was a questionnaires, interview and observation methods was used. Descriptive statistics was used in the data analysis and Chi-square was also used in hypothesis testing. Application of the appropriate statistic helps a researcher to decide if the difference between the two groups‟ scores is big enough to represent a true rather than a chance difference. Choice of appropriate statistical techniques is determined to a great extent by the research design, hypothesis, and the kind of data that was collected. In fact, after data collection, the data was edited and coded and subsequently, the data was entered into SPSS. The major types of statistics are measures of central tendency, percentages, pie charts and bar graphs were used in the data analysis. Additionally, all hypotheses were tested by Chi square. The Chi-square (χ2) was computed using the following formula:
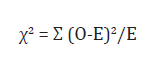
Where:
O – Observed frequency
E – Expected frequency
Ʃ (O-E)2 – Sum of the squares of the differences between Observed and Expected frequencies.
The χ2calculated was compared with χ2critical at a significance level of 0.05 and degrees of freedom which was determined as follows:
Degrees of freedom (df) = (r – 1) (c – 1)
Where r: number of rows
c: number of columns
Results and Discussion
Socio demographic characteristics of respondents
Response Rate: A total of 331 questionnaires were distributed out of which 270 questionnaires were returned. This was because some of the respondents were too busy that they were not able to attempt the whole question. This response was good enough and representative of the population and conforms to Mugenda O.M and Mugenda AG [10] stipulation that a response rate of 70% and above is excellent. All 270 samples of respondents were all farmers and relied on natural resources for their basic needs. The study results indicated more than three quarter of the respondents (87 %) are smallholder farmers with farm size below two hectares, while only quarter (13%) of the sampled respondents have farms with size of greater than or equal to two hectares.
Four age groups of respondents were identified: below or equal to 20, between 21 and 40, between 41 and 60 and then greater or equal to 61 years old. The findings indicate that most of the respondents (83.7%, n=226) are in the age vary from 21 to 60 years (Table 1). The average age is 44.17 years for all respondents, max=63 and min=18 years. Additionally, the average age for women is 42.5 years and 45.8 years for men.
Table 1: Characteristics of respondents in the study area (N=270).

The distribution of the percentages showed that females are 33.3% (n=90) while males are 67.7% (n=180) (Table 1).
The results indicate that majority of the respondents can read and write (73%) and very few were with diploma certificate (2.22%). The marital status varies a lot by age, sex and in less extent by area of residence along with living conditions. The respondents aged below 21 years are all single 4.8% (n=13), married are 83% (n=224), widowed are 11.5% (n=31) and divorced are 0.7% (n=2) (Table 1). The results show that 55 households with members ranging from one to three persons are 20.7% (n=56), households with members ranging from four to six persons are 75.2% (n=203), family size ranging from seven to nine, are 2.9% (n=8). The average family size is 4.48, min=1 person while max= 14 persons and the standard deviation is 1.156 (Table 1). The results of the study showed that a great number of farmers are smallholders; therefore, their farms are less than 2 hectares. The study indicates that 34.44 % (n=93) owns the farm with size less than 0.3 hectares, 22.59 % (n=61) have farms vary between 0.3 – 0.9 hectare, 17.41 % (n=47) have farms with size vary between 0.9 – 1.5 hectares, 12.22 % (n=33) have farms with size vary between 1.5 – 2.0 hectares while the farmers with land greater than or equal to 2 hectares are only 13.33% (n=36). The average size of respondents‟ farms is 1.23 ha. The majority of farmers’ land size varies from 0.3 to 0.8 ha (Table 1).
Land use and agronomic practices
Land use: According to the topography of the study area, land use type is determined according to the location of the farm as well as slope. Farms located in marshland are used for only farming, while those located on hillsides are used either for farming annual crops, coffee plantation and forest to the very steep slope. According to the study results, the land uses were identified into three groups: 74.8% (n=202) are engaged in farming only, 22.6 % (n=61) are in farming combined with farm, forest, and the remaining 2.6% (n=7) are combining three land use (farming, coffee and forest) (Figure 3).

Types of crops: Farming system which is overwhelmingly smallholder in nature is characterized by intensive organic systems and involved the combination of food, fodder and tree crop. Crop rotation and use of some soil and water conservation techniques are typically practiced. Number of crops cultivated in the study area ranges from one to four, according to the farm location and priority of crops, including sorghum, maize, beans, sweet potatoes, vegetables, and others (Sugar cane, banana, sorghum and mango). The most dominant crops grown are Sorghum, with a proportion of 92.2 % respondents, followed by beans (Phaseolus vulgaris) with a proportion of 88.5% respondents. The next most frequent crops are vegetables 27.4 %, Maize 17.4, Mango is 5.9 and others (sugar and Banana) are 4.4 % (Table 2). This is similar to the findings of a study done by Amanze et al., [11] where they proved that output of the crop, level of education; farm size and price of fertilizer were important factors influencing farmers‟ use of fertilizer in arable crop production (Plate 1).

Table 2: Types of Crops grown by sample households.

Types of livestock: The findings revealed that some of the respondents do not hold any livestock while others have at least one type of livestock. The results indicate that 4.4 % do not own any type of livestock while those who own at least one type of livestock are 95.6 %. The major domestic animals raised in the study area are cattle, goats, sheep, chickens and donkeys. According to the study findings, cows 89.6 % are very dominant, followed by goats 79.6 %, chicken 61.1%, sheep 46.3 %, and finally donkey 5.9% respectively (Table 2). It has also found that respondents who have at least one cow are 23.7 % (n=64) while those who have at least two different livestock are 84.44%.According to Shiferaw & Holden (1998), livestock are generally considered as assets that could be used in the production of process or be exchanged for cash or other productive assets. Livestock may reduce the economic impact of soil erosion and thus lower the need for soil conservation (Table 3) (Plate 2).
Table 3:Type of livestock.


Status of soil erosion: Soil erosion is worldwide known as a major problem, especially in developing countries, where many tons of soils are washed away due to unsustainable land use. According to the research findings, 44 % respondents confirmed having a problem of soil erosion while 56 % pointed out that there is no soil erosion on their farms. Soil erosion may occur due to various drivers, including direct and indirect causes. And once soil erosion occurs, it reduces the capacity of land productivity as well as the increase of vulnerabilities. During the study, it was found that; soil erosion 23 % and soil fertility depletion 21 % are serious trends in the study area. Respondents acknowledged the soil erosion as a serious environmental issue in the study area, followed by the soil fertility depletion in-situ. This latter could be exacerbated by the excessive loss of topsoil due to high soil erosion and lead to the decrease of crop productivity. This is due to the topography, heavy seasonal rainfall, and unsustainable use for agricultural purpose. In addition, the study results present soil erosion and soil fertility depletion problem, according to the farm location. Relatively fewer respondents in marshland indicated soil erosion and decline in soil fertility as a problem while a higher proportion of respondents on hillside areas perceive these problems. A study done in Ethiopia by FAO (2006) noted that the country faces moderate to severe soil erosion on 50 percent of its land surface. Therefore, the proportion of farmlands affected by soil erosion is either comparatively lower or it is concentrated in certain areas (Figure 4).
Table 4:


Perception on Extent of Soil erosion and Soil fertility decline: The extent of soil erosion in the study area have been identified into three categories; extent into low, moderate and high while the level of soil fertility was identified as low, medium and high. According to the findings, respondents mentioned the extent as well as degree according to their perception. Farmers have classified soil erosion into two categories; soil erosion by water and soil fertility decline and into different degree according to category. All respondents have mentioned the soil erosion, according to the degree as follows: 17.5 %, 26.7 % and 7.5 % low, medium and high soil erosion respectively in their farms. While, to the other hand, the results indicate that the state of soil fertility depletion is: 14.2 %, 25 % and 9.2 % classified as low, medium and high soil fertility depletion respectively in this area (Table 4).
The perception of soil erosion as a serious problem was one of the major factors which influence the adoption of the SWC technologies. The study findings indicated the percentages of respondents who reported to adopt such technique due to the problem of soil erosion. The results indicate that the majority of respondents (64.1%) adopt crop rotation due to the soil erosion problem, followed by those who adopt level bund (56.3%), agricultural inputs and FanyaJuu terrace with proportions of 53.3 % and 46.7% respectively (Table 5).
Table 5: Farmers who experience soil erosion and adoption of SWC strategies.

Perception of soil erosion as a hazard to agricultural production and sustainable agriculture is the most important determinant of effort at adoption of conservation measures. Forty-four percent of respondents stated to have the problem of soil erosion on their farms. And among them, 23% stated to have soil erosion as a serious problem while 21% said to have a problem of soil fertility depletion. In addition, it was found that soil erosion and soil fertility depletion is higher in hillside areas than in marshland. Surprisingly, it was found that all farmers (including those who reported to not have a problem of soil erosion) have adopted one or more SWC technology. Furthermore, the results showed a relationship (p>.030) between perception of the soil erosion problem and number of SWC technologies adopted in the area of the study. The implication is that farmers who feel that their farmlands are prone to soil erosion are more likely to adopt physical soil conservation measures than those who do not perceive the problem of soil erosion. This was proved by the findings of a study done by [31] in Ethiopia, which showed that farmers’ perception of the soil erosion problem affects the adoption of soil conservation measures positively and significantly. Additionally, in relation to the findings of a research conducted by Alufahet al., [13] and Simon et al., [14] have shown that household size, perception of the soil erosion problem, training in soil erosion control, land ownership and access to institutional credit had significant effects on the adoption of SWC technologies.
Soil and water conservation technologies: According to the research, it was found that crop rotation, agricultural inputs, terraces and ditches are the most used SWC technologies. The study results indicate that crop rotation is one of the most adopted by respondents (79.6%), followed by ditches (77.8%) and application of agricultural inputs (organic and mineral fertilizers) as well as radical terraces with proportions of 71.5% and 57.8% respectively. High adoption of crop rotation and agricultural inputs may be associated with the fact that is a simple technique and as well as availability of seeds through governmental support while ditches are the technique that are very easy to implement even at the household level. But on the other hand, radical terraces require much means, including financial, technical and labor means. Moreover, FanyaJuu terraces are new technologies that are being implemented in the study area (Figure 5) (Plate 3).


On the other hand, the research findings indicate that the least SWC technologies are rainwater harvesting, grass strip, forest/ tree planting and Agroforestry. The results show that tree planting is one of the most adopted in the least used techniques (23.3%), followed by Agroforestry (19.63), grass strip and rainwater harvesting with proportions of 8.52% and 0.74% respectively (Figure 6).

Factors contributing to the adoption of SWC technologies
The study has identified the most used SWC technologies in the area. Identifying the factors contributing to the adoption of these techniques willalso be important. Therefore, this part describes the main factors contributing to the adoption of these SWC technologies. Throughout the study, respondents were asked to mention the key factors contributing to the adoption of these SWC technologies.
Farm size: The study findings indicate that the majority of the respondents (34.44 %) have farms with size less than 0.3 hectares (Table 5). Farm size may influence adoption of SWC technologies directly or indirectly and vary from household to household. The results of study showed that adoption of SWC techniques is more frequent in farms with size less than two hectares than those with size greater or equal to two hectares (Table 6).
Table 6: Farm size and SWC technologies.

The chi-square results indicated that at significant level of 0.05 farm size has a relationship (p>0.003) with the number of SWC technologies adopted in the area. This relationship may be explained by the fact that smaller farms are associated with land shortage and insufficient wealth which make worse the problem or impacts of soil erosion in their farms. This can therefore be expected to increase the probability of investment in soil conservation measures.
This association is similar to the findings of various studies. For example, the study findings of Tadesse& Belay [12] stated that farm size has a positive and significant influence on the farmers‟ decision to adopt physical soil conservation measures. The same as the findings of a study carried out in Nigeria by [11] proved that the output of the crop, level of education, farm size and price of fertilizer were important factors influencing farmers‟ use of fertilizer in arable crop production and also farm size were shown generally to have a positive impact on a household’s decision to adopt and use a new technology such as fertilizer. Additionally, the studies done by Mulugeta [15], Tadesse& Belay [12] and Yishak [16] indicated a positive relationship between farm size and adoption. Farm size and number of plots owned have a positive influence on the adoption of SWC practices. But, on the other hand, the findings of studies carried out in Cameroun and Ethiopia by Gockowski & Ndoumbe [17] and Degnet, et al., [18] revealed that there is negative relationship between farm size and adoption of mono-crop horticulture as well as between farm size and adoption of high yielding maize varieties.
Table 7: Influence of livestock rearing on adoption of SWC technologies.

Livestock rearing: The study results showed that 95.6% have at least one livestock while 4.4% have no livestock. It was also revealed that respondents who have at least one livestock have adopted at least one SWC technology (Table 7).
It was found that having livestock is an important asset that could influence adoption of SWC technologies in one way or another. This could be explained by the fact that most respondents reported a shortage of feed for their livestock, especially during the dry season. Therefore, they adopt different SWC technologies in order to get sufficient fodder and water for their domestic animals. Statistically, the chi-square results indicate that there is no relationship (p<0.341) between raising livestock and the number of SWC technologies adopted in the study area. This is similar to the findings of the study done in Ethiopia by [19] indicated that distance of the plot from residence, livestock holding, and the fertility of the farm plot affect negatively and significantly farmers’ conservation decision and the extent of use of improved soil conservation technologies. This affects soil conservation positively. Furthermore, this is was also proved by the findings of Tesfaye [20] indicating that land size, livestock ownership, family size, risk perception, land tenure on non-arable lands, labor organization, characteristics of technology, indigenous institution and physical factors are significant determinants of SWC.
Table 8: Influence of crop yield on adoption of SWC technologies.

Crop yield: Respondents reported crop yield as a major factor influencing the adoption of SWC technologies. The study findings indicate that the majority of respondents (71.1%) reported to adopt crop rotation due to the need of increasing crop yield in their farms, followed by those who adopt level bund with a proportion of 69.6%, and then followed by 65.2% and 52.2% for those who adopt agricultural inputs and Fanya Juu terrace respectively (Table 8).
During the study, crop yield was identified as one of the factors contributing to the adoption of SWC technologies. Many farmers in the region were facing declining of crop yields due to high soil erosion, which in turn lead to soil fertility depletion. Thus, the decline in crop yield is attributed to land degradation, which is a result of various factors, among others soil erosion, nutrient mining, and the inability of smallholder farmers to adopt technologies that enhance soil conservation and soil fertility [15,21].
According to the chi square results, the study results showed that farmers‟ perceptions on low crop yield has a relationship (p>0.020) with the adoption of SWC technologies in the study area. This is similar to the findings of a study done by Amanze et al., [11] where they proved that the output of the crop, level of education, farm size and price of fertilizer were important factors influencing farmers‟ use of fertilizer in arable crop production.
Table 9: Influence of input (support) on adoption of SWC technologies.

Inputs: The study results show that 55.2% of respondents reported to adopt crop rotation due to the subsidizing of agricultural inputs while 51.5% using agricultural inputs (manure and fertilizers) due to the fact that they get subside of organic and mineral fertilizers at low cost (Table 9).
The study results indicate that most of farmers adopt crop rotation and agricultural inputs due to the subsidies of organic and mineral fertilizers as well as improved seeds. The subsidizing of organic and mineral fertilizers as well as improved seeds may influence the adoption of SWC technologies directly or indirectly. Statistically, the chi-square results showed that having access to support (inputs) is associated (p>0.000) with number of adopted SWC technologies in the study area. This is similar to the study done by Tewodros & Melesse [22] where their findings revealed that households with large farm size, better socioeconomic status, endowed with labor, access to institutional supports and a number of monthly contacts with development agents were more likely to adopt and this is confirmed by a positive elasticity.
Knowledge and their source (access to extension services) and farmers’ experience: Extension plays a great role in promoting SWC technologies. During the interview, it was clear that farmers in the area got assistance from extension services. The access to the extension services may influence the adoption of SWC technologies in one way or another. The study found that most respondents have reported to adopt SWC technologies due to the access to extension services. The results also indicated that due to the access to extension services; 76.7% and 76.6% of respondents adopt bund and crop rotation respectively, while 70.7% and 57.8% farmers adopt the application of agricultural inputs (organic and mineral fertilizers) and terraces respectively. According to the respondents’ experience, the results indicated that the majority of farmers adopted SWC technologies below fifteen years, while only few of them adopted SWC technologies more than sixteen years (Table 10).
Table 10: Knowledge from extension services and SWC technologies.

The results from farmers and key informant interview indicate that farmers get assistance provided by extension services and this assistance has a great role in adoption of SWC technologies.
The chi square results indicated that there is no relationship (p<0.192) between access to the extension service and the number of SWC technologies adopted in the study area. Furthermore, the statistical results showed that there is a connection (p>0.000) between farmers‟ experience and a number of SWC technologies adopted. To the Contrary, findings of a study carried out in Burkina Faso by Basga [23] proved that governmental extension services exhibit positive correlation coefficients for both the traditional and new soil conservation practices. And moreover, according to the findings from the study done by Derajew et al., [19] pointed out that the educational level of the household head; extension contact; and slope of the plot positively and significantly affect farmers’ conservation decision and the extent of use of improved soil conservation technologies. Furthermore, the findings of Senait [24] showed that land ownership type, distance of the farm plot from homestead, resource availability and contact with extension agents were found to be the most important factors affecting choice of land management practices such as the use of commercial fertilizer, manure, stone/soil bonds or a combination of them.
This is similar to the findings of Adeola [25] revealed that education; contact with extension agents, farming experience and farm size significantly influenced the adoption of soil conservation measures among farmers. Further, the finding of Belay [26] also asserted that farmers with experiences of one or more of the soil conservation practices already had the experience and they were more aware of the soil erosion problem than farmers who did not have any experience of doing soil and water conservation practices.
High slope: High slope was identified as one of the last factors affecting the adoption of SWC strategies in the area. The research findings indicate that slope situation affects the adoption of crop rotation, agricultural inputs, Fanya Juu terrace and level bund (Table 11). In fact, the area of the study is characterized by high rainfall and some hills which facilitate high runoff, which in turn cause the excessive soil loss through soil erosion (Table 11).
Table 11: Influence of high slope on adoption of SWC strategies

The results indicate that there is a connection (p>0.000) between the high slope and number of SWC technologies adopted. The implication is that farmers who cultivate in hillside areas tend to adopt more diverse SWC technologies than those who do not cultivate the land which is susceptible to excessive soil erosion. This was proved by many authors, including Ervin & Ervin [27], Gould et al., [28], Paulos [29] and Wagayehu [30] their findings revealed that the slope category of the plot has been found to be positively affecting the farmer’s decision to invest in conservation technologies.
Extent of using or adoption of SWC strategies
Table 12 shows the extent of farmers’ adoption of SWC technologies. The adoption score indicates the number of the four SWC technologies that farmers have adopted, and the frequency with the corresponding percentage refers to the number of farmers who have adopted the conservation practices. One hundred and thirteen farmers (41.9%) have adopted between one and two SWC technologies, and one hundred and fifty-seven farmers (58.2%) have adopted between three and four SWC technologies. In this group, one hundred and two farmers (37.8%) have adopted all the four SWC technologies (Table 12).
Table 12: The extent of the adoption of SWC technologies.

The reason behind the adoption of one or more SWC technology is that the study area is characterized by excessive rainfall which causes much soil loss and runoff. Due to the status of the study area, one SWC technique cannot be enough for controlling soil erosion as well as runoff or other disasters. This could also be explained by the program launched in by the Government of Ethiopia to consolidate the land so that the land could be more protected by various technologies through farmers‟ participation approach. The program is called Sustainable Land Management (SLM). Figures from Table 13 indicate that overall, farmers in the study area used more agronomic measures (Crop rotation and agricultural inputs) than those who adopted physical measures SWC technologies (FanyaJuu terraces and Level Bund). The results indicated that 90.7% of respondents adopted traditional SWC practices while 78.1% use improved SWC technologies (Table 13).
Table 13: Agronomic and Physical measures.

The high adoption of agronomic measures could be explained by the availability of improved seeds and fertilizers through governmental subsidies and the fact that they are easy and simple to apply. While on the other hand, physical measures are much higher dependent on much labor as well as financial means. According to the Table 14 among the SWC technologies, crop rotation, ditches and agricultural inputs were the most used technologies, amongst farmers with proportions of 79.6%, 77.8% and 71.5% respectively. It can be seen that farmers have poorly adopted radical terraces (57.8%) (Table 14).
Table 14:Distribution of the adopted SWC technologies in the study area.

And the other reason which would be behind this adoption is that; crop rotation, level bund and agricultural inputs are easier and cheaper SWC technologies to be implemented. And they can be done by household itself while fanya juu terraces are required much labor and inputs and also households alone cannot make fanya juu terraces without external financial means or Governmental supports. Additionally, to this low adoption of fanya juu terraces, is that the technology is still new in the study area and was adopted by very few numbers of farmers.
Table 14 shows the distribution of the adopted SWC technologies in the area of study. Crop rotation is the first most adopted technologies in the study area. It is also the most traditional practices used for improving soil fertility and conserving the soils. The major crop rotation practiced by farmers in the area is from maize to beans. The reason behind this high adoption is due to the fact that it is a simple and easy technology, and additionally the availability of improved seeds through governmental subsidies. This technology plays an important role in improving soil productivity, soil cover, structure and fertility and thus enables soil erosion control. The second technology is Level bund (Table 14), which used in the study area for protecting soil from erosion by draining excessive water; this facilitates the infiltration of water into the soil easily. The technology is very simple and easy to be established by any person in the area of study. This was explained by Yohannes [31] by stating that the potential of this technology is that it demands less labor, and being flexible, it can be easily established by any farmer and competition with the crop area is minimal. Additionally, it is practicable where the slope of the land is very high, stony catchment and high quantity of water.
Agricultural inputs (organic and chemical fertilizers) are also used in the area for the achievement of increased agricultural production and productivity and thus are considered as a practice susceptible for soil fertility management (Table 14). Based on interview with households and key informants, farmers have increased the amount of agricultural inputs, especially applied manure because of the high price of inorganic fertilizers and also due to the accessibility of trainings of compost making livestock availability as well.
Lastly, fanyajuu terraces are less adopted by comparison with those three other technologies. This could be explained by the fact that fanyajuu terraces are much more labor intensive, require technical advisory input and in addition is still new technology introduced in the study area by comparison with other previous technologies.
Even if fanyajuu terraces are the less adopted in the study area (14), the study found out that they play an important role regarding soil erosion and runoff control. Fanya juu terraces are greatly used for reducing high slope in order to control high runoff and minimize soil erosion at the same time increasing agricultural productivity; they conserve soil moisture and fertility and facilitate cropping operations as well as promote intensive land use and permanent agriculture on the slope.
Bizoza & Graaff [32] showed that Fanyajuu/radical terraces in the highlands of Ethiopia are only financially viable when the opportunity cost of labor and manure are below the local market price levels and when an agriculture area on these radical terraces can be substantially intensified. Ten to 30 metric tons of manure (organic) is required to restore the soil fertility of newly established radical terraces
Benefits of SWC strategies to livelihoods and adaptation of smallholder’s farmers
This section analyzed the effectiveness of SWC activities in terms of the livelihoods of smallholder farmers and role in adapting to climate change impacts in the study area. Vulnerability context, access to livelihood assets, institutions, policy and process and livelihood strategies were considered to assess the role of SWC practices to livelihoods and adaptation to climate change.
Farmers were asked to mention the effects or benefits of SWC technologies through household questionnaires. Most of the respondents (70.4%) considered increase/improve crop yield to be a major benefit, while 55.6% indicated that SWC technologies improves soil fertility. 45.9% stated that adoption of SWC technologies has reduced soil erosion/runoff in their farms as well as 33.7% said to play a great role in fodder production, especially fanyajuu terraces and others, including improved water quantity and quality, access to credit and savings as well as increase of income (Table 15).
Table 15: Benefits of SWC technologies in the study area.

However, the use of crop rotation and agricultural inputs play an important role in improving soil properties especially soil structure and chemical properties. In fact, a great number of respondents considered an improvement of crop yield as major benefits of SWC technologies. This is associated with the fact that most of the respondents as well as 98% of all peoples in Benishangul Gumuz Region depend on agricultural production as their major source of living. Further, according to the results from households’ and key informant interviews, they indicated that adoption of SWC technologies has reduced soil erosion by controlling runoff in hillsides and improve soil fertility. In fact, severe soil erosion has led to the loss of soil fertility which now is improving due to the adoption of the SWC technologies. Benishangul Gumuz Region as well as study area is characterized by high excessive rainfall which makes worse the situation of the soil erosion problem. Respondents also mentioned the availability of fodder as benefit from adoption of SWC technologies. Actually, due to the fire and over grazing used in the study area, people were facing a shortage of forage for their livestock mainly during the dry season. The findings of a study by Demeke [33] also showed that farm size and perception of benefit from conservation measures positively and significantly affect the farmers’ decision to adopt conservation structures (Table 16).
Table 16: Field and conservation practice parameters.

Table 17:Field and conservation practice parameters.

• Sonka kebele: The area appears on a gently sloping (0- 4%) ground with trees, grasses and shrubs. The devastating soil degradation agents are sheet erosion of mainly sandy clay loam soils. Present land uses are predominantly arable farming (mainly sorghum, maize and beans) and livestock production (SLMP 2016). Localized soil and water conservation practices are largely the use of crop rotation and agricultural inputs which were experienced as highly effective between 3 and 6 years. However, fanyajuu terraces and level bunds were perceived as not effective techniques, likely due to its less need on the area’s level topography (Table 17). The sites that seasonally experiences active gulling amongst other severe degradation activities, were largely conserved through use of the effective practices (Table 17) in maintaining stable crop production in the area.
• Mender-49 kebele: The site is placed on a steeply sloping (20-22%) ground dominated by livestock production and arable farming of largely sorghum. The soils are predominantly silty clay loam textured with few trees and grass vegetation (SLMP 2016). High erosion intensities due to site elevation (Table 16) are seasonally curtailed by application of durably strong barriers. Effective conservation techniques were Hill side fanya juu terraces, level bund and agricultural input applications over an effective period of between 2 and 10 years (Table 2). Crop rotation was not used, possibly due to its perceived low impacts under the excessive erosion devastations, and thus, termed as not effective in the area (Table 17). Field observation showed that considerable soil and water were conserved against the menacing rill and gully erosion with only a low labor input, thereby enhancing yearly crop production success in the area.
• Mender-46 kebele: The riverine area is sited on a moderately slopping (8-10%) field with considerable trees interposed by shrubs. The soil is mainly of sandy loam textures largely utilized for orchards. Gully landslides prove the most serious soil loss agent devastating the area (SLMP 2016). All the conservation practices (Table 17) investigated recorded moderate to high effectiveness within 2 to 12 years periods, except for the less applicable level bund technique. The effective conservation practices in place conserved moisture retained the farm and reduced gully spreads (Table 16) with a contribution on sustainable crop production activities in the area (Table 17).
Table 18: Field and conservation practice parameters.

Vulnerability context: According to the farmers, there are many extreme events like heavy rainfall and excessive soil erosion that damage farmers’ livelihoods. These trends are not favorable and lead to the adaptation and/or adoption of new SWC technologies. Thus, 74% of farmers reported to adopt SWC technologies due to soil erosion problem which is mainly associated with heavy rainfall in the study area. While 28.1% reported that they adopt different SWC technologies because of weather changes. It was also noted that 5.9% and 1.8% were using SWC technologies because of the selected seeds which are able to adapt to the changes in weather and also to the pests respectively. While, on the other hand 3.3% and 1.1% are using SWC technologies due to the land shortage as well as fluctuation occur in prices at market level (Table 18). Many experts would expect this trend due to the rapid population growth and strong overexploitation of land resources, accompanied by unsustainable agricultural practices along with issues of land shortage and steep slope land (Table 18).
Table 19:

Livelihood assets: The livelihood assets of the study area were distinguished into five different capitals: human, social, natural, physical and the financial capital (Table 19).
a. Human capital: The research findings revealed that the majority of respondents are aged between 21 and 40 years (46.3%) followed by those who are in the range of 41 to 60 years old (37.4%) while those who are below or equal to 20 years and the one who are aged over or equal to 61 altogether are 16.3% (Table 18 & Table 19). Regarding their education level, the results showed that most of them have primary education (73.75%) followed by those who did not attend any schools (20.74%) while those with education beyond primary are 5.55% (Table 18 & Table 19).
Additionally, the results show that households with members ranging from one to three persons are 20.7%, households with members ranging from four to six persons are 75.2%, family size ranging from seven to nine are 4.1% (Table 18 & Table 19). The study findings also indicated that farmers who have access to trainings and extension services as their source of knowledge are 53% and 98.89%, respectively, and only 2.2% said to get knowledge of SWC technologies through knowledge dissemination (from parents or eldest to children) (Table 20).
Table 20:Human Capital.

Statistical results showed that there is no connection (p<0.179, p<0.139 and p<.090 respectively) between age, household size and education and number of SWC technologies adopted and also the results indicate that access to extension service and dissemination of knowledge have no relationship (p<0.192 and p<0.318 respectively) with number of adopted SWC technologies, but on the other hand, the chi square results also indicated that access to trainings has a relationship (p>0.000) with number of SWC technologies adopted in the area of the study. This is contrary to the findings of a study carried out in Nigeria by Amanze et al., [11] proved that the output of the crop, level of education, farm size and price of fertilizer were important factors influencing farmers’ use of fertilizer in arable crop production and also farm size were shown generally to have a positive impact on a household’s decision to adopt and use a new technology such as fertilizer. But on the other hand, it was found that access to trainings has a relation with the number of SWC adopted. This is similar to the study findings of Simon et al., [14] and Alufahet al., [13] showed that household size, perception of the soil erosion problem, training in soil erosion control, land ownership and access to institutional credit had significant effects on the adoption of SWC technologies.
b. Natural capital: It has found that all respondents have their own land, either for living or cultivating, and the most cultivated land are found near their living homes. Most of the land was under land heritage and the majority (86.7%) of farmers has land with the size ranging below 2 hectares, while 13.3% have land with size greater than or equal to two hectares. Statistical results showed that the size of the farm has a connection (p>0.003) with a number of SWC technologies adopted. However, most of the people in the area of study rely on the environment for their livelihoods. All households require water for consumption. Farming activities also require much water for producing crops and raising livestock and also people are much depending on the type and quality of soils and fodder for their livestock found in the area. According to the statistical results, farm size has a relationship with a number of SWC technologies adopted in the area the study area. This association is similar to the findings of various studies; including findings of Tadesse& Belay [12] stated that farm size has a positive and significant influence on the farmers‟ decision to adopt physical soil conservation measures. Additionally, to this, the findings of Mulugeta [34], Tadesse& Belay [12] and Yishak [16] indicated there is a positive relationship between farm size and adoption. However, according to them; farm size and number of plots owned have a positive influence on the adoption of SWC practices. This is also similar to the findings of a study carried out in Nigeria by Amanze et al., [11] proved that output of the crop, level of education, farm size and price of fertilizer were important factors influencing farmers‟ use of fertilizer in arable crop production and also farm size were shown generally to have a positive impact on a household’s decision to adopt and use a new technology such as fertilizer. But, on the other hand, the findings of studies carried out in Cameroun and Ethiopia by Gockowski & Ndoumbe [17] and Degnet et al. [18] respectively, revealed that there is negative relationship between farm size and adoption of mono-crop horticulture as well as between farm size and adoption of high yielding maize varieties.
c. Social capital: As indicated by the household interview and key informant results, it was found that 73% of farmers are in different cooperatives, and each cooperative is formed by 20 to 30 people. It is in these cooperatives where farmers get access to different supports including trainings and credits for agricultural investments (Table 21).
Table 21: Social Capital.

The results of the Chi-square indicated that being a member of a cooperative have a relationship (p>0.000) with the number of SWC technologies adopted the area. Social assets are about unity and community actions. Nowadays, in area of study, many farmers are operating in cooperatives. Thus, the study findings indicate that 73% (Table 21) are in different cooperatives, related to agricultural activities (farming and livestock) and women’s cooperatives. These cooperatives represent a form of social capital that provides value to individual households. Social capital is also helpful in organizing the operation and maintenance of a community infrastructure scheme and bringing workers together to perform necessary tasks. For example, in Bambasi District, there is always a community work at every last Friday of a month. The type of work is mainly based on environmental protection activities, including planting trees, creating radical terraces and waterways, etc. Strong social capital helps in allocating water resources among households and their farms in ways that are acceptable to community members and beneficial to the community as a whole. Furthermore, according to the statistical results, it was found that there is a connection between being a member of such cooperative and number of SWC technologies adopted. This is was also proved by a study conducted in Ethiopia by Tesfaye [20]; indicating that land size, livestock ownership, family size, risk perception, land tenure on non-arable lands, labor organization, characteristics of technology, indigenous institution and physical factors are significant determinants of SWC.
d. Financial capital: Many households have inadequate financial capital. The most source of financial capital is from raising livestock, farming activities (including crop production, forest, coffee) and credit from cooperatives. The study results revealed that 95.6% and 73% get financial capital through raising livestock and cooperatives respectively (Table 22).
Table 22:Main source of Financial Capital.

Taking into part in farmers’ cooperatives is a main means of access to financial capital in the study area. It is in these cooperatives where farmers get access to credit and savings through their contribution which is equal to fifty Ethiopian Birr (1.79$) per week. However, the reasons behind these cooperatives are due to the fact that in Ethiopia there is a policy of helping people (smallholder farmers in general) through cooperatives. They get trainings and support through these cooperatives. Because of the inadequate financial means, farmers are unable to invest in new SWC technologies especially fanyajuu terraces. They wait intervention of Governmental support in terms of financial means or materials as well as trainings. Additionally, limited financial resources also prevent farmers accessing all of the complementary inputs required to maximize the productivity of land and water resources. Thus, livestock rearing has a big contribution to the increasing of farmers’ income throughout the production of meat, milk, eggs as well as manure. Unfortunately, according to the statistical results, it was found that there is no relationship (p<0.341) between livestock rearing with a number of SWC technologies adopted while on the other hand, there is an association between being a member of the cooperative (p>0.000) and number of SWC technologies adopted in the study area.
This could be explained by the findings of a study done by Derajew et al. [19] which indicated that distance of the plot from residence, livestock holding, and the fertility of the farm plot affect negatively and significantly farmers’ conservation decision and the extent of use of improved soil conservation technologies. But in addition, the findings of Tesfaye [20] revealed that land size, livestock ownership, family size, risk perception, land tenure on non-arable lands, labor organization, characteristics of technology, indigenous institution and physical factors are significant determinants of SWC. Furthermore, the research findings of Simon et al., [14] and Alufah et al., [13] showed that household size, perception of the soil erosion problem, training in soil erosion control, land ownership and access to institutional credit had significant effects on the adoption of SWC technologies.
Conclusion
As conclusion, the main purpose of the study was to investigate the effectiveness Soil and Water conservation practices as climate smart agriculture and its contribution to livelihood of smallholder farmers in Sonka kebele, Mender-49 and Mender 46, Bambasi District of Benishangul Gumuz Region, Ethiopia. Four types of SWC technologies were identified in the area. The major factors contributing to their adoption were seen as; farm size, livestock rearing, crop yield, support, knowledge from extension services and experience, farmers’ perception of soil erosion and steep slope. Soil and water conservation technologies appeared viable and relevant in conserving soil and water required for sustainable livelihood and as a means to adapt to ever increasing climate change in the study area. Even the techniques rated as not effective were likely due to their non-applications, other than the observed inefficiency of the technologies [35-38]. Long term effectiveness was recorded as direct functions of the conservation structures established in the areas studied. And it was found that respondents were willing to adopt SWC technologies. It was found that at least one technology has been adopted. But it was also found that a combination of SWC technologies is preferred over the section of single technology. As a matter of fact, the adoption of these SWC technologies has made respondents feeling secure of their assets. Those include human, natural, physical, social and financial capitals. Furthermore, the study concluded that most of the participants were willing to maintain soil as a valuable resource and apply SWC technologies to increase resilience to climate changes through maximizing their benefits including improvement of agricultural productivity as well as soil fertility and same time reduced soil erosion. But the study expressed the need for the continuing support of the implementation. Further, it also brings to a close that conservation efforts should target areas where expected benefits are higher, especially on the steeper slopes, in order to encourage the use of the SWC technologies. Heavy rainfall followed by severe soil erosion that results in gullies and loss of farmlands and productivity is the major climatic risk in the study area. Therefore, SWC technologies can improve the capacity of smallholders to reduce the impacts of such climatic changes as well as ensure the sustainability of crop production.
Acknowledgement
None.
Conflict of Interest
No conflict of interest.
References
- WOCAT (2012) Desire for Greener Land Options for Sustainable Land Management in Drylands. World Overview of Conservation Approaches and Technologies (WOCAT), University of Bern -CDE, Alterra - Wageningen UR, ISRIC - World Soil Information and CTA - Technical Centre for Agricultural and Rural Cooperation.
- Beinroth FE (1994) Land related stresses in agroecosystems. In JKSM Virmani, Stressed Ecosystems and Sustainable Agriculture, eds. New Delhi: Oxford and IBH.
- Eswaran H, Lal R, Reich F (2001) Land degradation: An overview. from Natural Resources Conservation Service Soils. United States Department of Agriculture (USDA).
- Pla I (2000) Hydrological approach to soil and water conservation. Keynotes-ESSC Third International Congress, Valencia, Spain, pp. 45-69.
- Sentis IP (2010) College on Soil Physics: Soil Physical Properties and Processes under Climate Change.Hydrological Approach to Soil and Water Conservation. In I Pla, Hydrological approach to soil and water conservation, “Man and Soil at the Geoforma Ed. Logroño (Spain): Departament de Medi Ambient i Ciènciesdel Sòl Universitat de Lleida, Spain, pp. I: 65-87.
- Lewis LA, Clay DC, Dejaegher YM (1988) Soil loss, agriculture, and conservation in Rwanda: Toward sound strategies for soil management. Journal of Soil and water Conservation. The science and art of natural resource management for sustainability, Soil and water conservation society 43: 418-421.
- Chelemu K, Nindi P (1999) Conservation Tillage for Soil and Water Conservation Using Draft Power in Zambia. Meeting the Challenges of Animal Traction, A Resource Book of the Animal Traction Network for Eastern and Southern Africa, London Intermediate Technology Publications, pp. 1-6.
- Mulenga N (2003) Conservation Farming in Zambia. Lusaka Technical Services Branch, MACO, pp. 1-128.
- CSA (2007) Ethiopia demographic and health survey 2005. Central Statistical Agency, Addis Ababa, Ethiopia, Maryland, USA, pp. 1-436.
- Mugenda OM, Mugenda AG (2003) Research Methods, Qualitative and Quantitative Approaches.
- Amanze B, Eze C, Eze V (2010) Factors Influencing the Use of Fertilizer in Arable Crop Production among Smallholder Farmers in Owerri Agricultural Zone of Imo State. Academia Arena 2(6): 90-96.
- Tadesse M, Belay K (2004) Determinants of Fertilizer Use in Gununo Area, Ethiopia. Proceedings of the workshop held to discuss the socioeconomic research results of 1998-2002, Addis Ababa, Ethiopia.
- Alufah S, Shisanya CA, Obando JA (2012) Analysis of Factors Influencing Adoption of Soil and Water Conservation Technologies in Ngaciuma Sub-Catchment, Kenya. Department of Geography, Kenyatta University. African Journal of Basic & Applied Sciences 4 (5): 172-185.
- Simon A, Shisanya CA, Obando JA (2012) Analysis of Factors Influencing Adoption of Soil and Water Conservation Technologies in Ngaciuma Sub- Catchment, Kenya. African Journal of Basic & Applied Sciences 4(5): 172- 185.
- Mbaga-Semgalawe Z, Folmer H (2000) Household adoption behavior of improved soil conservation: The case of the North Pare and West Usambara Mountains of Tanzania. Land use policy 17(4): 321-36.
- Yishak G (2005) Determinants of Adoption of Improved Maize Technology in Damot Gale Woreda, Wolaita, Ethiopia. MSc Thesis. Alemaya University. Alemaya, Ethiopia: Alemaya University.
- Gockowski J, Ndoumbe M (2004) The Adoption of Intensive Mono-Crop Horticulture in Southern Cameroon. Younde, Cameroon: Elsevier BV, 30: 195-202.
- Degnet A, Belay K, Aregay W (2001) Adoption of high-yielding maize varieties in Jimma Zone: Evidence from farmers’ level data in Ethiopia. Journal of Agricultural Economics 5(1&2): 41-62.
- Derajew F, Bekabil F, Wagayehu B (2013) Determinants of the Use of Soil Conservation Technologies by Smallholder Farmers: The Case of HuletEjuEnesie District, East Gojjam Zone, Ethiopia. Asian Journal of Agriculture and Food Sciences 1(4).
- Tesfaye B (2003) Understanding Farmers: Explaining soil and water conservation in Konso, Wolaita and Wello, Ethiopia.Wello, Ethiopia: Tesfaye Beshah, pp. 245.
- Bojö J (1996) The cost of land degradation in Sub-Saharan Africa. Ecological Economics 16(2): 161-73.
- Tewodros T, Melesse W (2010) Determinants of Coffee Husk Manure Adoption: A Case Study from Southern Ethiopia. Journal of Agricultural Economics 65(1).
- Basga ED (1992) The adoption of soil conservation practices in Burkina Faso: the role of indigenous knowledge, social structure and institutional support. Iowa State University, pp. 1-213.
- Senait R (2005) Determinants of choice of land management practices: A case of Ankober District. Ethiopia.
- Adeola R (2010) Influence of Socio-Economic Factors on the Adoption of Soil Conservation. Measures in Ibadan/Ibarapa Agricultural Zone of Oyo State. Ogbomoso Oyo state, Nigeria: Department of Agricultural Economics and Extension 2(7): 1-6.
- Belay TT (2014) Perception of farmers on soil erosion and conservation practices in Dejen District, Ethiopia. International Journal of Environmental Protection and Policy 2(6): 224-229.
- Ervin C, Ervin E (1982) Factors affecting the use of soil conservation practices: Hypotheses, evidence, and policy implications. Land Economics 58(3): 277- 92.
- Gould B, Saupe W, Klemme R (1989) Conservation tillage: The role of farm and operator characteristics and the perception of soil erosion. Land Economics 67(2): 167-82.
- Paulos A (2002) Determinants of Farmers‟ Willingness to Participate in Soil Conservation Practices in the Highlands of Bale: The case of Dinsho Farming system area. Hamalaya, Ethiopia: Alemaya University 15(4): 423-438.
- Wagayehu B (2003) Economics of Soil and Water Conservation. Theory and Empirical Application to Subsistence Farming in the Eastern Ethiopian Highlands. PhD. Dissertation. Uppsala, Sweden: Swedish University of Agricultural Sciences.
- Yohannes G (1999) The use, maintenance and development of soil and water conservation measures by small-scale farming households in different agro-climatic zones of Northern Showa and Southern Wello, Ethiopia. PhD Thesis.Bern, Switzerland.
- Bizoza AR, Graaff J de (2012) Financil cost-benefit analysis of bench terraces in Rwanda. Journal of Land Degradation and Development 23: 103-115.
- Demeke AB (2003) Factors Influencing the Adoption of Soil Conservation Practices in Northwestern Ethiopia. Institute of Rural Development, University of Goettingen.
- Mulugeta E (2000) Determinants of Adoption of Soil Conservation Practices in Central Highlands of Ethiopia. The Case of three Districts of Selale. Alemaya, Ethiopia: School of Graduate Studies of Alemaya University
- FAO (2006a) Improving Land Tenure Security for the Poor in Rwanda. Rome: UN Food and Agriculture Organization.
- FAO (2006b) Socio-Economic & Livelihood Analysis in Investment Planning.Rome, Italy.
- Haggblade S, Tembo G, Donovan C (2004) Household Level Financial Incentives to Adoption of Conservation Agricultural Technologies in Africa.East Lansing, Michigan State University (FSRP).
-

This work is licensed under a Creative Commons Attribution-NonCommercial 4.0 International License.


