 Research Article
Hemostatic Potential in Hypertension as a Basis Personificated Antitrimbothic Prevention and Therapy Technology
LY Kotlovskaya1,2, II Tyutrin3, H Kingma2,4, EV Udut5, TV Rudenko2, VP Fisenko6 and VV Udut1,2*
1Goldberg Research Institute of Pharmacology and Regenerative Medicine, National Research Tomsk State University, Russia
2Goldberg Research Institute of Pharmacology and Regenerative Medicine, National Research Tomsk State University, Russia
3Department of Anesthesiology and Resuscitation, Russia
4Department of Otorhinolaryngology and Head and Neck Surgery, Maastricht University Medical Center, Netherlands
5Siberian State Medical University (SSMU) of Russian Ministry of Health, Russia
6First Moscow state Medical University of the Ministry of Health, Russia
VV Udut, Goldberg Research Institute of Pharmacology and Regenerative Medicine, National Research Tomsk State University, Russia.
Received Date: August 12, 2019; Published Date: August 27, 2019
Abstract
The paper contains data on hemostatic potential in patients with stage 1 and stage 2 hypertension. Endothelium is a metabolic system which primarily responds to changes in homeostasis and serves as a «stabilizer» of the blood aggregate state. Hypertensive heart disease is accompanied by endothelial dysfunction manifested by vasoconstriction, increased secretion and adhesion of the hemostasis cellular system, activation of hemostasis plasma factors and, as a result, increased thrombin generation, which is the main enzyme determining the intensity of hemocoagulation. Development of endothelial dysfunction (release of the content of endothelial storage pools, contraction, and structural damage to endothelial cells with the formation of deendothelization areas and exposure of collagen fibers, etc.) contributes to the transition of hemostatic potential from hypoand normal coagulation to hypercoagulation and causes a higher risk of thrombotic complications. Therefore, are evaluation and monitoring of the hemostatic potential in therapy aimed at preventing thrombotic hemorrhagic complications great importance.
Keywords:Hemostatic potential; Endothelial dysfunction; Hypercoagulation; Antitrimbothic therapy
Abbreviations:CAC: Coefficient of Anticoagulant Activity; CS: Clot Strength; СTA: Constant Thrombin Activity; ICC: Intensity of the Coagulation Contact; ICD: Intensity of the Coagulation Drive; ICP: Intensity of the Clot Polymerization; MA: Maximum Amplitude; RICL: Retraction Intensity and Clot Lysis; RU: Relative unit
Introduction
It is known that hypertension is a condition with a procoagulant phenotype, which is the main symptom of cardio-vascular complication such as myocardial infarction, cerebral strokes, etc. Endothelial dysfunction plays an important role in the concept of hypertension cascade. In physiological state, endothelium provides proper vasolidation, reduces aggregate adhesion and secretion of thrombocytes, and prevents formation of coagulant structures, etc. Endothelium’s antithrombogenicity is determined by the glycocalyx located on the luminal surface of vascular endothelial cells. Due to sialic acids located both on the glycocalyx and on the surface of the blood cells, a mutual negative charge is created, which, in turn, interferes with interaction between them [1-3]. Thrombomodulin is an integral part of endothelial cells. Its molecules inactivate free thrombin and activate protein C to prevent hemocoagulation. Besides anticoagulant function, endothelium also has an “antiplatelet” function enabled by the synthesis of natural antiaggregants such as nitric oxide and prostacyclin [4-7]. The relationship between hypertension and endothelial dysfunction has been well established and does not require further confirmation [8,9].
Less generation of nitric oxide caused by the imbalance between free radicals and antioxidants, hyperactivation of the renin-angiotensin system (RAS) and/or changes in the L-arginine metabolism activity leads to endothelium dysfunction. It was proved that early stages of hypertension are accompanied by oxidative stress developing due to the increased activity of RAS and lipid peroxidation. Hemodynamic overload contributes to more intensive damage to the endothelium in conditions of its impaired repair potential, reduced vasodilatation of the endothelium dysfunction, and formation of a vicious circle – mutually reinforcing endothelium dysfunction and hypertension leading to the progression of hypertension, development and manifestation of thrombotic complications [10,11]. Moreover, lipid peroxidation and “cytokine aggression” appeared because of the activation of the cells of a macrophage pool leads to an increase in the synthesis of inducible NO-synthase, which is rather more active than the endothelial isoform of NO-synthase [12-14]. Under prolonged exposure to a stimulus this results in hyperconcentration of free nitric oxide and, as a consequence, an increase in the concentration of peroxynitrite, which has a powerful cytotoxic effect and reduces endothelial repair [15]. Therefore, there is an amplified oxidative stress and disruption of L-arginine metabolism, i.e. biochemical substrate of nitric oxide. Long-term activation of endothelial cells not only leads to inhibition of antithrombotic factors (thrombomodulin, heparan sulfate, etc.) but also to decrease in a surface expression of adhesion molecules (ICAM-1, VCAM-1, Е-selectin), release of a powerful vasoconstrictor – endoleline-1 and inhibitor of plasminogen (PAI-1). In turn, damage to endothelial cells facilitates the exposure of the tissue factor, i.e. initiator of the “external pathway” hemocoagulation and membrane asymmetry with the phosphatidylserine shift to the outer surface of the cell membrane. Additionally, under prolonged activation, endothelial cells contract causing the exposure of subendothelium structures, in particular collagen, which is a powerful procoagulant factor [16].
All the mentioned processes result in an increase in thrombin generation with a decrease in its inactivation. Increased activation of a cellular segment leads to increased clotting by the release of platelet factors and by providing a surface for the assembly of plasma hemocoagulation complexes. Thus, even at the early stages of hypertension, formation of a procoagulant phenotype defines the need of hemostatic potential monitoring to prevent thrombotic and hemorrhagic complications [17]. In this regard, applying the method of low-frequency piezothromboelastoraphy as a comprehensive evaluation in hemostasis to clinical and laboratory practices is paid much attention and considered to be a method for monitoring hemostatic potential and antithrombotic therapy. Unstabilized venous blood is used to gather data on all stages of fibrinogenesis (from initiation/amplification to stabilization of its lysis) [18- 20].
Research goal
The study aims to estimate hemostatic potential in patients with stage 1 and stage 2 hypertension.
Materials and methods
Comparative evaluation of the functional hemostatic potential state was conducted in healthy volunteers and patients with stage 1 and stage 2 hypertension Table 1.
Table 1: Healthy volunteers.

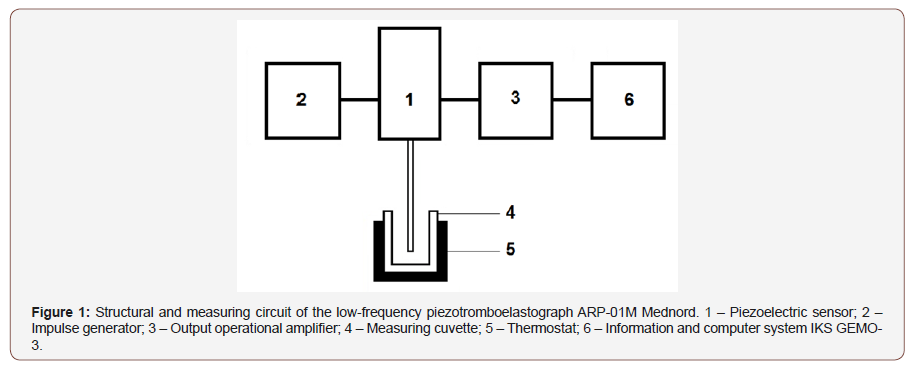
Volunteers must not have been exposed to any anti-aggregate or anticoagulating therapy before and must not take any medicine affecting hemostatic potential to be included into the study. The functional hemostatic potential state was evaluated on the unstabilzed whole blood basis by piezothromboelastography. The method consists in recording the change in the viscoelastic characteristics of the aliquot of blood being studied, i.e. blood transition from liquid to elastic solid state. A change in the resistance of the sample is perceived by a needle resonator fixed to the surface of a piezoelectric sensor. The piezoelectric sensor performs two functions: it converts the input voltage of the lowfrequency harmonic signal into mechanical oscillations applied to the needle resonator and converts the mechanical oscillations into the voltage of the output signal which is processed and displayed on the PC screen with IKS GEMO-3 Figure 1.
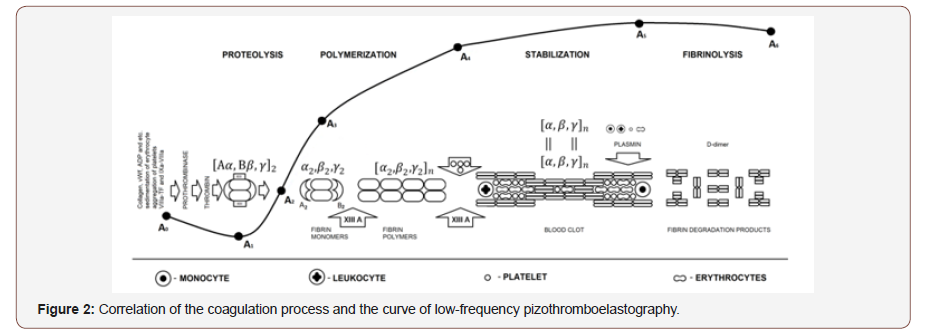
Blood sampling was carried out by a three-component silicone syringe from the ulnar vein without the tourniquet application. Blood samples were place into disposable cuvettes for 10 seconds. The cuvettes were located in the thermostat of ARP-01M Mednord (Mednord, Russia). In real-time mode, the following hemocoagulation parameters were analyzed: suspension stability of the blood (t1, min), intensity of coagulation of blood elements (ICC, r.u.), prothrombin time (t3, min), proteolytic (ICD, r.u.) and polymerization stages (IPS, r.u.) of fibrinogenesis, maximum amplitude of the clot (MA, r.u.) and time of its attainment (t5, min), total intensity of fibrinogenesis (ITS, r.u.), fibrinolytic activity (RICL,%), and total anticoagulant activity (CSPA, r.u.). IBM SPSS Statistics 22.0 was used for statistical data processing. In case of the abnormal data distribution, nonparametric data processing methods were chosen – the Mann-Whitney U-test and the Kruskal- Wallis one-way analysis of variance. The quantitative indicators are given in Me [LQ; UQ], where Me is the median, LQ is the upper quartile, and UQ is the lower quartile. Differences were considered reliable at the achieved level (p <0.05).
Results and Discussions
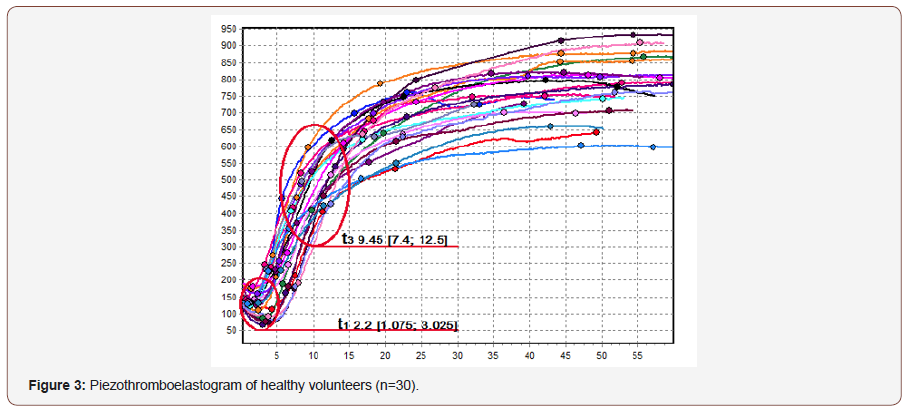
In the control group, at the initial stages of hemocoagulation, the functional state of hemostatic potential as compared to the defined standards was characterized by the increased suspension stability of the blood (t1 2.2 min [1.075; 3.025]) against moderate intensity of the coagulation of blood elements (ICC 17.9 r.u. [11.9; 21.8]). Thrombin activity was within the normal values obtained from individuals of the Siberian population – CTA 33.91 r.u. [30.6; 38.5]; however, there was an insignificant increase in prothrombin time reflected in the increase in t3 up to 9.45 min [7.4; 12.5] whereas the normal value of t3 is equal to 5.7-9.8 min. The intensity of proteolytic and polymerization stages of fibrinogenesis were within the norm: ICD 35 r.u. [30; 41.5] and ICP 15 r.u. [12.8; 20.8], respectively. Despite longer prothrombin time, clotting stability and its maximum density were attained within the reference values (t5 42.1 min [31.4; 49.5] and MA 610.5 r.u. [470.5; 686.5]). The intensity of overall coagulation was also within the norm (CS 15.85 r.u. [12.35; 17]). The lytic and anticoagulant activity of the blood were also within the reference values (RICL 0.3 % [0.27; 0.43] and CAC 2.17 r.u. [1.8; 2.4] Figure 3.
Comparing the control group with the patients with stage 1 and stage 2 hypertension demonstrated the differences at all the stages of hemocoagulation. However, multidirectional characteristics of the obtained values in patients with hypertension stood out. Therefore, stratification of the patients by CTA was put forward. CTA characterizes the thrombin activity. Thrombin is a key enzyme which sets the intensity of coagulation. That is why stratification was reasonable. It could help to divide the patients into groups according to the functional state of hemostatic potential regardless the stage of hypertension Table 2.
Table 2: Comparative indicators of healthy volunteers, patients with hypertension without endothelial dysfunction and patients with hypertension complicated by endothelial dysfunction.

All the patients with stage 1 and stage 2 hypertension were divided into two groups: subgroup 1 with normal level of thrombin activity (CTA ≤ 49 r.u.) and subgroup 2 with increased level of thrombin activity (CTA ≤ 50 r.u.). Subgroup 1 consisted of 12 male patients (mean age 55.08±2.667 years) and 30 female patients (mean age 56.07±1.374). Subgroup 2 included 25 males (mean age 53.72±1.719) and 59 females (mean age 52.81±0.815). The analysis of a general trend of hemocoagulation revealed hypercoagulation in both groups. CS was 1.2 times higher in subgroup 1 (up to 19.17 r.u. [15.3; 22.37]) and 1.2 times higher in subgroup 2 (up to 19.12 r.u. [15.9; 22.9]) in comparison with the control group (p<0.01).
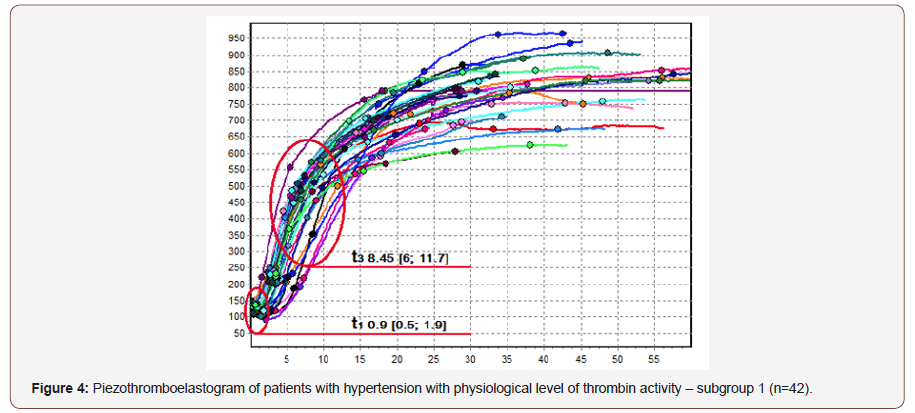
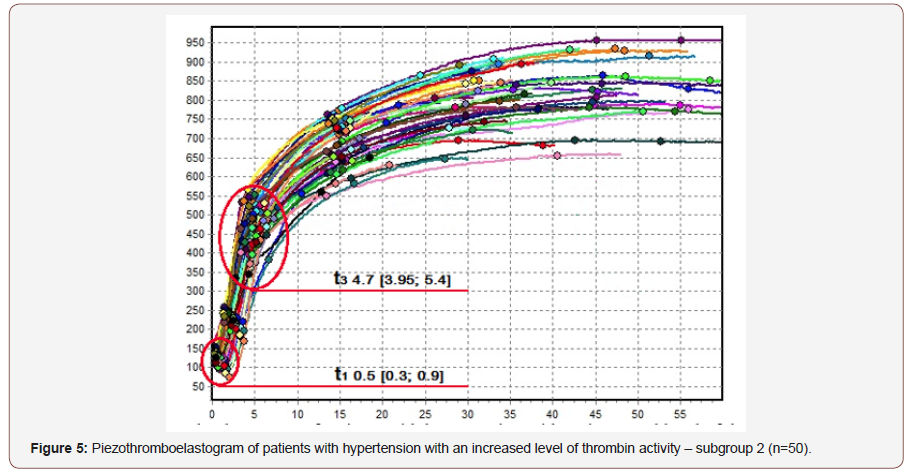
The intensity of initial stages of hemocoagulation in the patients with hypertension was characterized by lower suspension stability of the blood reflected in the dynamics of t1. The parameter decreased by 2.4 times in subgroup 1 (t1 0.9 min [0.5; 1.9]) and by 4.4 times in subgroup 2 (t1 0.5 min [0.3; 0.9]) in comparison with the control group (p<0.01). As a result, a higher intensity of coagulation of blood elements was observed in both subgroups. The intensity increased by 1.4 times in subgroup 1 (ICC 23.6 r.u. [16.5; 39.6]) and doubled in subgroup 2 (ICC 36.7 r.u. [21.5; 52]) as compared to the control group (p<0.01). By studying the differences observed at the initial stages of hemocoagulation, we can conclude that an increase in thrombin activity reduces suspension stability of whole blood, which is a cause of a higher adhesion and aggregate activity of blood elements. It is a common knowledge that thrombin activates numerous coagulation factors, including platelets. In case of the “transmembrane asymmetry”, two halves would equalize due to increased thrombin production. There is a transition of phosphatidylserine and phosphatidylethanolamine from the inner bilayer of the plasma membrane to the outer one and displacement of phosphatidylcholine from the outer layer to the inner layer. In addition, direct contact of thrombin with blood elements, especially with platelets, leads to activation of lipid peroxidation, which, in turn, leads to a decrease in antioxidant potential and an increase in the intensity of thrombogenesis.
Since platelets serve as the main surface for the formation of enzyme complexes activating thrombin, increase in their “initial” adhesion and aggregate activity results in acceleration of clotting. In comparison with the control group, subgroup 1 showed no difference in prothrombin time, whereas in subgroup 2 t3 halved from 9.45 min [7.4; 12.5] to 4.7 min [3.95; 5.4] (p<0.01). Reduction in prothrombin time was also observed when subgroup 1 and subgroup 2 were compared; t3 decreased by 1.8 times from 8.45 min [6; 11.7] to 4.7 min [3.95; 5.4] (p <0.01). Increase thrombin activity not only leads to higher intensity at the initial stages of hemocoagulation but also affects clotting intensity. It was revealed that both the intensity of the proteolytic stage of fibrinogenesis and thrombin activity went up. ICD in subgroup 1 increased by 1.2 times (up to 43 r.u. [34.6; 55]) and doubled in subgroup 2 (up to 69.1 r.u. [62.4; 79.3]) in comparison with the control group (p<0.01). The analysis of the polymerization stage of fibrinogenesis (ICP) showed no differences between subgroup 1 and the control group, whereas the parameter increased by 1.4 times (up to 21.1 r.u. [20; 23]) in subgroup 2 (p<0.01). A higher activity of fibrin polymerization was observed when subgroup 1 and subgroup 2 were compared. The activity increased by 1.1 times from 18.5 r.u. [16.5; 20.37] to 21.3 r.u. [20; 23] (p<0.01). There were no statistically significant differences in the maximum density of a blood clot between subgroup 1 and subgroup 2, but in subgroup 1 there was a tendency to a greater fibrin clot density than in subgroup 2. Thus, subgroup 1 demonstrated the 1.3 times higher clot density with MA up to 694 r.u. [665.8; 738] and subgroup 2 showed the 1.1 higher clot density with MA reached 680 r.u. [633.8; 741] as compared to the control group (p<0.01). The higher clotting intensity in subgroup 1 can be explained by the increased fibrinolytic activity observed in subgroup 2. Statistically significant differences were obtained while comparting the control group with subgroup 2. RICL increased by 4.6 times up to 1.4% [0.5; 2.9] (p<0.05). This might explain the lack of reliable differences in t5, i.e. the time when a clot attains its maximum density. The increase in lytic activity leads to the formation of fibrin degradation products with pronounced anticoagulant properties. CAC, overall anticoagulant activity, increased together with CTA by 1.15 times in subgroup 1 (CTA 2.42 r.u. [2; 2.95]) and by 1.5 times in subgroup 2 (CTA 3.25 r.u. [2.85; 3.86]) in comparison with the control group (p<0.01). Higher anticoagulant activity in patients with hypertension complicated by endothelial dysfunction could be explained by a “compensation” shift of the functional state of endothelium towards hypercoagulation, increased formation of fibrin degradation products, and higher level of the inducible form of nitric oxide synthase, which has anti-aggregate and anticoagulant properties Figure 4 & 5.
Conclusion
The functional state of hemostatic potential of the patients with hypertension was characterized by hemostasis shift towards hypercoagulation in comparison with the healthy participants. At the early stages of hypertension (stages 1 and 2), the subjects have heterogeneous functional state of hemostatic potential, which depends on the expression of endothelial dysfunction. The increase in the intensity of the initial stages of hemocoagulation (initiation/ amplification) was observed in all the patients with hypertension. The increase was accompanied by the decrease in suspension stability of the blood and increase in contact activation of blood elements depending on the expression of antiaggregate function of endothelium. Against the background of the initial increase in adhesion and aggregation of blood elements, prothrombin time shrank. The enhanced intensity of proteolytic and polymerization stages of fibrinogenesis were noticed. Although clot density did not differ significantly in the healthy participants and patients with hypertension, the patients with hypertension without endothelial dysfunction demonstrated higher values than the patients with hypertension complicated by endothelial dysfunction. It might be explained by the higher fibrinolytic activity in patients suffering from complications caused by endothelial dysfunction. The more severe endothelial dysfunction was, the greater anticoagulant activity was, which can be considered as a compensatory mechanism of hemostasis activated by endothelial dysfunction.
Acknowledgement
None.
Conflict of Interest Statement
No conflict of interest.
References
- Lupinskaya ZA (2003) Endothelium of blood vessels - the main regulator of local blood flow. Vestnik KRSu T 7: 1-10.
- Shirinskiy VP (2011) Molecular physiology of the endothelium and mechanisms of vascular permeability. Uspekhi fiziologicheskih nauk 42(1): 18-32.
- Maksimenko AV, Turashev AD (2014) Endothelial glycocalyx of the circulatory system. I. Detection, components, structural organization. Bioorganicheskaya himiya 40(2): 131-141.
- Deanfield JE, Halcox JP, Rabelink TJ (2007) Endothelial function and dysfunction: testing and clinical relevance. Circulation 115(10): 1285- 1295.
- Lupinskaya ZA, Zarif’yan AG, Gurovich TC (2008) Endothelium. Function and dysfunction. Bishkek: KRSU: 373.
- Kade AH, Zanin SA, Gubareva EA, Turovaya AYU, Bogdanova YUA, et al. (2011) Physiological functions vascular endothelium. Fundamental’nye issledovaniya 3(11): 611-617.
- Koryakina LB, Pivovarov YUI, Kuril’skaya TE, Sergeeva AS, Babushkina IV, et al. (2013) Dysfunction of vascular endothelium at arterial hypertension and coronary disease (literature review). Byulleten’ Vostochno-Sibirskogo nauchnogo centra Sibirskogo otdeleniya Rossiyskoy akademii medicinskih nauk 2-1(90): 165-170.
- Cai H, Harrison DG (2000) Endothelial dysfunction in cardiovascular diseases: the role of oxidant stress. Circulation research 87(10): 840- 844.
- Ferroni P, Basili S, Paoletti, V, Davi, G (2006) Endothelial dysfunction and oxidative stress in arterial hypertension. Nutrition, metabolism and cardiovascular diseases 16(3): 222-233.
- Loscalzo J (2002) Oxidative stress in endothelial cell dysfunction and thrombosis. Pathophysiology of haemostasis and thrombosis 32(5-6): 359-360.
- Davignon J, Ganz P (2004) Role of endothelial dysfunction in atherosclerosis. Circulation 109 (23/1): III-27-III-32.
- rbett JA, Kwon G, Marino MH, Rodi CP, Sullivan PM, et al. (1996) Tyrosine kinase inhibitors prevent cytokine-induced expression of iNOS and COX-2 by human islets. American Journal of Physiology-Cell Physiology 270(6): 1581-1587.
- erma S, Buchanan MR, Anderson TJ (2003) Endothelial function testing as a biomarker of vascular disease. Circulation 108 (17): 2054-2059.
- Bulanova EL, Drapkina OM (2014) Nebivolol as Inducer of Nitric Oxide Synthesis. Trudnyy pacient 12 (10): 30-33.
- Pacher P, Beckman JS, Liaudet L (2007) Nitric oxide and peroxynitrite in health and disease. Physiological reviews 87 (1): 315-424.
- Petrishchev NN, Vasina LV, Vlasov TD, Gavrisheva NA, Menshutina MA, et al. (2007) Typical forms of endothelial dysfunction. Kliniko-laboratornyy konsilium 18: 31-35.
- Shlyahto EV, Moiseeva OM (2002) Cellular aspects of vascular remodeling in hypertension. Arterial’naya gipertenziya 8 (2): 32-38.
- Tyutrin II, Klimenkova VF, Udut VV (2014) New technology for assessing the pharmacodynamics of antiplatelet agents. Eksperimental’naya i klinicheskaya farmakologiya 77 (2): 21-25.
- Solov’ev MA, Tyutrin II, Udut VV, Klimenkova VF (2016) Experience of diagnosis and monitoring of critical hemostasis disorders. Medikobiologicheskie i social’no-psihologicheskie problemy bezopasnosti v chrezvychaynyh situaciyah 4: 55-60.
- Udut VV, Tyutrin II, Solov’ev MA, Kotlovskaya LYU, Borodulina EV, et al. (2017) Technology of low-frequency piezotromboelastography in the monitoring of antithrombotic therapy. Eksperimental’naya i klinicheskaya farmakologiya 80 (11): 10-17.
-
VV Udut, LY Kotlovskaya, II Tyutrin, H Kingma, EV Udut, TV Rudenko, VP Fisenko. Hemostatic Potential in Hypertension as a Basis Personificated Antitrimbothic Prevention and Therapy Technology. On J Cardio Res & Rep. 2(3): 2019. OJCRR.MS.ID.000540.
-
Hemostatic potential, Endothelial dysfunction, Hypercoagulation, Antitrimbothic therapy, Clot Polymerization, Clot Strength, Myocardial infarction, Cerebral
-

This work is licensed under a Creative Commons Attribution-NonCommercial 4.0 International License.


