 Research Article
Improvement of Efficiency and Productivity Through Machine Balancing in a Sewing Line
Champa Saha1* and Tarikul Islam2
1BGMEA University of Fashion and Technology, Bangladesh
2Jashore University of Science and Technology, Bangladesh
Champa Saha, Department of Apparel Manufacturing and Technology, BGMEA University of Fashion and Technology, Dhaka, Bangladesh.
Received Date: April 10, 2019; Published Date: April 29, 2019
Abstract
This study investigates and demonstrates the application of computer simulation for the design of a manufacturing process for t-shirt production in a virtual-reality environment. The focal constraint against the higher productivity is the difference in individual capacity which is the mode of improper line balancing and bottle check process. This study is based on an effective layout model where to hit upon the bottleneck process through benchmark capacity and led us to use balancing process using two separate concept of manufacturing processes- modular line and traditional system both together. The research shows that this balanced layout model has increased the efficiency by 9 % and labor productivity by 6 %.
Keywords: Productivity; Line-balancing; Apparel industry; Efficiency
Introduction
The ready-made garment (RMG) sector is the life-blood of Bangladesh economy achieving higher export growth every year. The sector is now the largest contributor not only to overseas trade but also to the national economy. Today’s business climate for clothing manufacturers requires low inventory and quick response systems that turn out a wide variety of products to meet customers demand [1]. It is especially in the Apparel industry that managers are trying to develop their current systems or looking for new production techniques in order to keep pace with the rapid charges in the fashion industry. Therefore, to develop a new system, good observations needed. However, to observe real manufacturing systems is very expensive and sometimes cumbersome [2]. The rapid rate at which the whole process takes place, the interaction between workers and the different transition times between workers make it increasingly more difficult for a human being to make correct decisions regarding how fast each operator should work in order to continue the process, while at the same time keeping productivity high and throughput at an acceptable level [3]. Construction of a quality garment requires a great deal of knowhow, a lot of coordination and schedule management. Clothing manufacturing consists of a variety of product categories materials and styling. dealing with constantly changing styles and consumer demands is so difficult. Furthermore, to adapt automation for the clothing system is also so hard because, beside the complex structure also it is labor intensive. There-fore, garment production needs properly rationalized manufacturing technology, management and planning [4]. In garment production, until garment components are gathered into a finished garment, they are assembled through a subassembly process. The production process includes a set of workstations, at each of which a specific task is carried out in a restricted sequence, with hundreds of employees and thousands of bundles of sub-assemblies producing different styles simultaneously [5]. The joining together of components, known as the sewing process, which is the most labor-intensive part of garment manufacturing, makes the structure complex as some works has a priority before being assembled [6]. Furthermore, since sewing process is labor intensive; apart from material costs, the cost structure of the sewing process is also important. Therefore, this process is of critical importance and needs to be planned more carefully [7]. As a consequence, good line balancing with small stocks in the sewing line has to be drawn up to increase the efficiency and quality of production. An assembly line is defined as a set of distinct tasks which is assigned to a set of workstations linked together by a transport mechanism under detailed assembling sequences specifying how the assembling process flows from one station to another. In assembly line balancing, allocation of jobs to ma-chines is based on the objective of minimizing the workflow among the operators, reducing the throughput time as well as the work in progress and thus increasing productivity. Sharing a job of work between several people is called division of labor. Division of labor should be balanced equally by ensuring the time spent at each station approximately the same. Each individual step in the assembly of product has to be analyzed carefully and allocated to stations in a balanced way never the available workstations. Each operator then carries out operations properly and the work flow is synchronized. In a detailed work flow, synchronized link includes short distances between stations, low volume of work in process, precise o planning of production times and predictable production quantity [8]. Overall, the important criteria in garment production is whether assembly work will be finished on time for delivery, how machines and employees are being utilized, whether any station in the assembly line is lagging behind the schedule and how the assembly line is doing overall [9,10]. To achieve this approach, work-time study, assembly line balancing and simulation can be applied to apparel production line to find alternative solutions to increase the efficiency of the sewing line [11]. Factories in Srilanka and India operate at 80% - 90% of efficiency, whereas in Bangladesh according to some experts, productivity is between 35- 55% of efficiency with very few exceptions. For the RMG sector in Bangladesh productivity alone can make a difference between life and death [12].
Productivity
In simple words, productivity is the relationship between output and input. The output in garments factories can be pieces of finished garments. The output of sections or departments within the garment factories could be, meters of the fabric inspected in fabric inspection section cut components in cutting room, number of garments ironed in the ironing section and so on. The examples of input are – man hours, machine hours, and meters of fabric consumed, or electricity consumed [13].
Clarification
In simple words, productivity is concerned with the efficient utilization of resources (inputs) in producing goods. This expression may also be called ‘productive efficiency.
Factor Productivity (Labor)=Output/Input(Labor)
Line balancing
The Line Balancing is to design a smooth production flowed by allotting processes to workers so as to allow each worker to complete the allotted workload within an even time. Line balancing is an effective tool to improve the throughput of assembly lines and work cells while reducing manpower requirements and costs. Assembly Line Balancing, or simply Line Balancing (LB) is the problem of as-signing operations to workstations along an assembly line, in such a way that the assignment be optimal in some sense. Ever since Henry Ford’s introduction of assembly lines, LB has been an optimization problem of significant industrial importance, the efficiency difference between an optimal and a sub-optimal assignment can yield economies (or waste) reaching millions of dollars per year. It is a system where we meet the production expectations and we can find the same amount of work in process in every operation at any point in the day.
Reasons for machine balancing
Purpose of balancing a line is to reduce operator’s idle time or maximize operator utilization. In a balanced line work will flow smoothly and no time will be lost in waiting for work. A time of line setting select operators for the operation matching operator skill history and skill required. Following this method, we will select highly skilled operators for higher work content operations. Once line is set conduct capacity study at a regular interval. We have to use pitch diagram method to find bottlenecks inside the line. We have to think how we will minimize WIP level at bottleneck operations.
• Keeping inventory costs low results in higher net income.
• Keeping normal inventory levels lets the operator work all day long giving him/her the opportunity to earn more money by increasing his/her efficiency.
• Keeping the line balanced lets the supervisors improve other areas because they can use their time better.
• Balanced production keeps prices low which turns into repeat sales.
• Balanced production means better production planning.
Materials and Methods
Required tools and materials
Different materials and methods are mainly used based on the work Experiments. Here, the following materials and tools are used to complete the testing and evaluation of this work:
• Stop Watch
• Spread Sheet
• Calculator
• Paper and Pencils
Equations

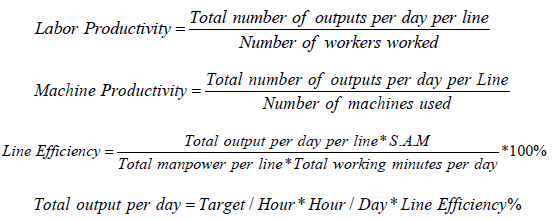
Data analysis and calculation
Before balancing line: Table 1 shows that the target per hour for the line calculating total 37 manpower worked on that line for 600 minutes with a S.A.M value of 8.90. We have standardized the Bench mark target of 200 pieces of garment at 80% efficiency. Observation before balancing the line has been reflected as labor and machine productivity is 30 and 50, line efficiency is 44%.
Table 1: Bench mark target, labor and machine productivity and line efficiency before balancing line.
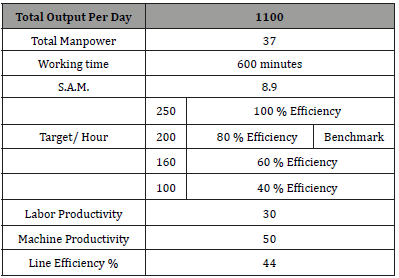
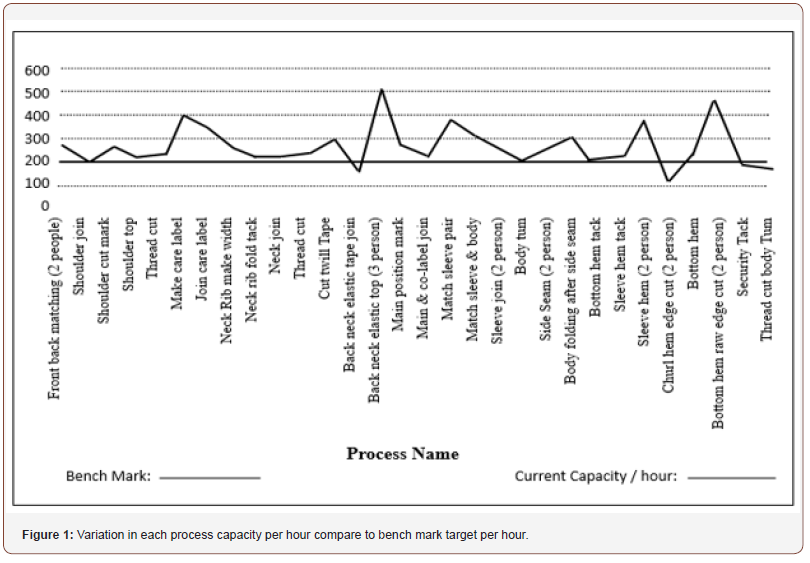
Figure 1 shows that Variation in each process capacity per hour compare to bench mark target per hour Plotting process wise capacity in a line graph shows the variation of each process from the bench mark target as the upper capacity is 490 pieces per hour where the lower capacity is only 115 pieces per hour compare to the bench mark target of 200 pieces. This shows the imbalance situation in the line and bottle neck condition throughout the process of the whole garment making as lots of WIP stations in the line.
Bottleneck processes: From Table 2 we have identified some variations in process capacity from the bench mark target and the lower capacity from the bench mark target is the bottleneck process as production flow would stuck on the bottleneck point. Comparing total capacity of each process to the 80 % bench mark target, we have identified the bottleneck processes named make and join care label, back neck elastic tape joint, match sleeve pair and sleeve and body, sleeve hem, churi hem raw edge cut, security tack and thread cut body tum. Total production has been blocked in these seven work stations and large work in process (WIP) has been stuck in these bottleneck processes.
Table 2: Proposed layout model to balance the bottleneck processes.
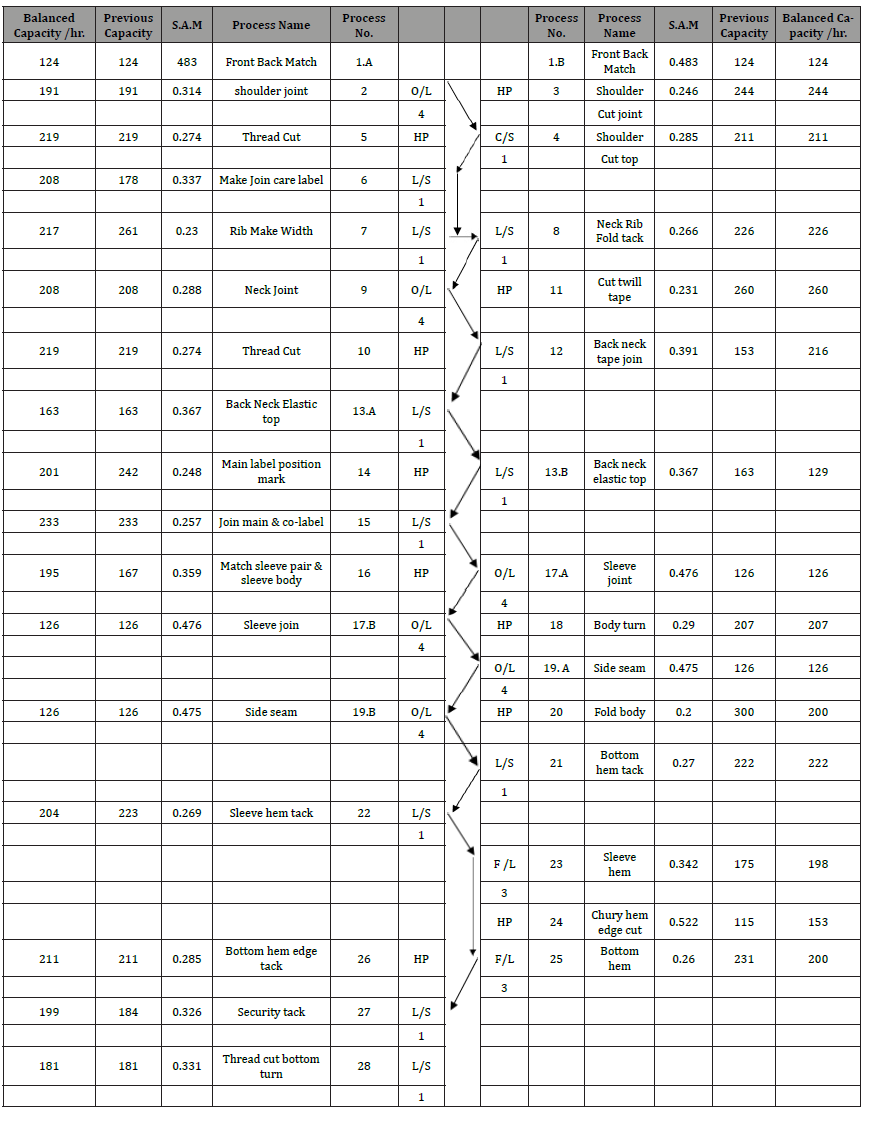
Balancing processes: Balancing method is very essential to make the production flow almost smoother compare to the previous layout. Considering working distance, type of machines and efficiency, workers who have extra time to work after completing their works, have been shared their work to complete the bottleneck processes. Previously identified seven bottleneck processes have been plotted (Table 3). Make and join care label and Back neck elastic tape joint both have been made by lock stitch machine and these have been shared by two lock stitch machine processes. Operator minutes per hour in her first process, no.7 Neck rib make width, have been worked for 50 minutes per hour in the first process, capacity 217 pieces and then have been worked in the process no.6 make and join care label for last 10 minutes to make additional 30 pieces for overall capacity of 208 pieces on process no.6. Similarly Process no.13.B back neck elastic top have been worked for 35 minutes and rest 25 minutes have been worked on process no.12 to make total capacity of 216 pieces which was originally 153 pieces shown in Table 4. Process no.14, 25, 20 and 22 have been similarly worked on the process no.16, 23, 24 and 27 for the capacity of 195, 198, 153 and 199 pieces per hour. Process no.24 churi hem raw edge cut have been suggested an extra floater to use after being shared worked from process no.20.
Table 3: Balancing Processes to equalize the bottleneck process.
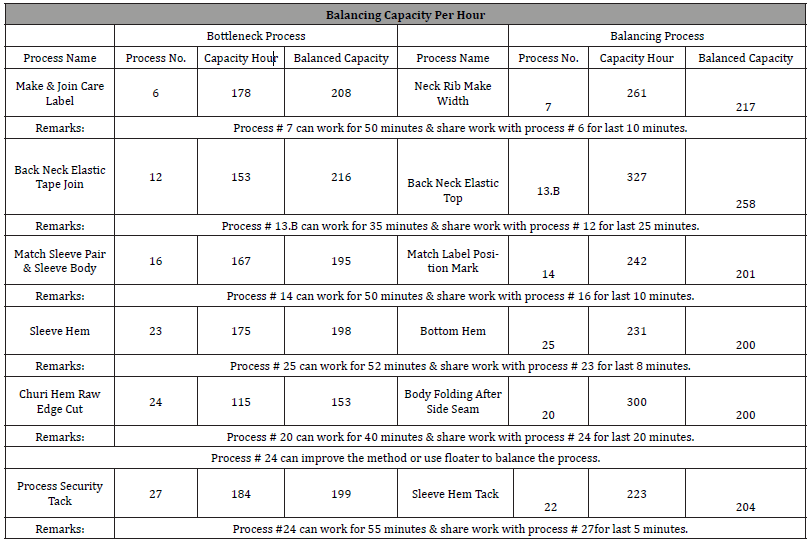
Table 4: Bench mark target, labor and machine productivity and line efficiency after line balancing.
Proposed layout: Research has been customary through this model which indicates that the processes are almost balanced from previous layout through the combination of balancing and bottleneck processes. The blue arrow on the center table indicates the production flow through the process no, as semi zigzag combination and green arrow shows the sharing of works in between balancing and bottleneck processes.
First column on both side of center table shows the machine type and then followed by process no. process name, S.A.M value, and previous capacity and after balance capacity. After first process front and back match, bundle of garments have been come to process no.2 shoulder joint, then the bundle have been passed diagonally to process no.4 shoulder top and in between the processes, one helper has been worked in process no.3 shoulder cut mark which is shown in fig 3.1.The working bundle then has been passed to process no.6 and so on. From process no.6 to 7 and process no.23 to 25, work has been flowed vertically not diagonally because of balancing out the bottleneck processes of no.6 and 23 as diagonal flow would have create the long distance and much time to balance, For balancing 6 possible stations, we have used the short possible distance, similar machines (process 6, 7, 12, 13.B, 22, 27) have been utilized in lock stitch machines, process 23 and 25 have been utilized in flat lock machines and process 14 and 16 are service operators.
Results and Discussions
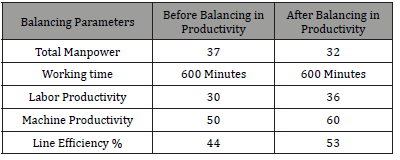
Changing from traditional layout to balanced layout model, there are considerable improvements have moved toward us. Among the three operators who were replaced to another line, have been used in the lock stitch and flat lock machines and machine productivity for these less used machines has been increased from 50 to 60 where for the total worker of 32 instead of 37, labor productivity has been increased to 36 from 30.
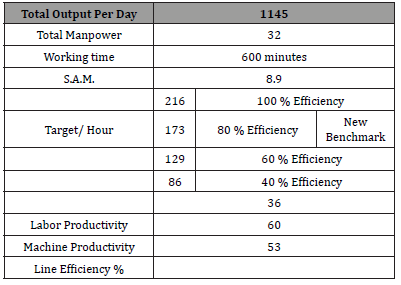
In a day we have boost up the production up to 1145 and with manpower of 32, line efficiency has been improved from 44 % to 53 % (as shown in Table 2). In the improved layout, target has been decreased at each efficiency level. At 80 % efficiency, target is now 173 pieces per hour.
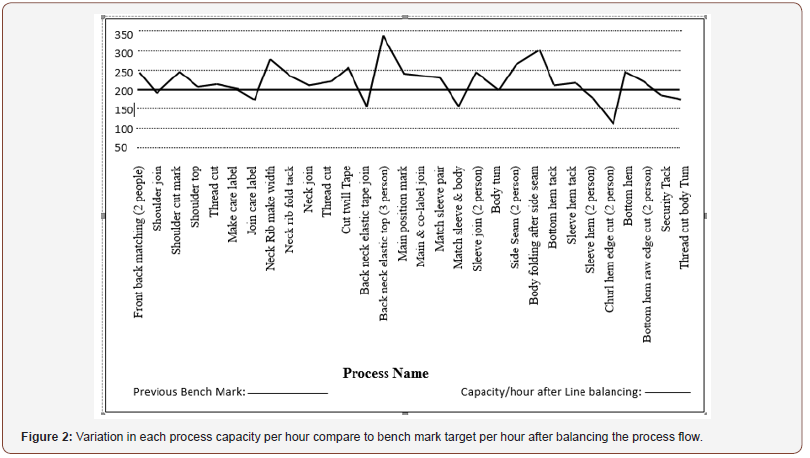
From Figure 2, it shows the less variation of each process from the bench mark target as the upper capacity is 260 (previous one was 490) pieces per hour where the lower capacity is only 153 (previous one was 115) pieces per hour compare to the benchmark target of 200 pieces which shows that the variation in each process has been decreased from the previous one and reflects much better balanced production flow in the line. For Process no.24 churi hem raw edge cut, an extra floater has been suggested to utilize (Table 5).
Table 5: Result summary.
Conclusion
Maximum outputs have been increased to 1280 pieces a day which was previously recorded to 1184 pieces a day. Before balancing the line 5664 pieces of garments have been produced for 6 days where 6880 pieces have been produced for 6 days after balancing the line. We have saved one day lead time for that style of 12000 pieces and almost 600 minutes of labor work value time. We have replaced 3 operators and 2 helpers into different lines and relatively saved 5 workers work time of 3000 minutes from that line and almost $130.
Acknowledgement
Authors would like to highly acknowledge to Dr. MA Jalil, Professor, Department of Textile Engineering, Khulna University of Engineering and Technology, Khulna, Bangladesh for his guidelines and Padma Poly Cotton Knit Fabrics Ltd. Dhaka, Bangladesh for providing some excellent characterization facilities.
Conflict of Interest
No conflict of interest.
References
- M Mizanur Rahman (2012) RMG Sector: Secret of success and causes of unrest, senior vice-president (IBBL), The Financial Express.
- Dr. Achim Berg, principal, Mekinsey’s Frank-furt, Co-ordinator, McKinsey’s Apparels, Apparel, Fashion & Luxury Practice, November 2013,p-3.
- Mucella G. Guner Can Unal, Department of Textile Engineering, faculty of Engineering. University of Ege. Imir, Turkey, Line Balancing in the Apparel industry Using Simulation tech-niques, FIBRES & TEXTILES in Eastern Eu-rope April/June 2008, Vol. 16, No. 2 (67), p- 75.
- Glock, R.F.E. Kunz,G.I. (1095). Apparel Manufacturing-Sewn Product Analysis, Pren-tice Hall,New Jersey,p:4.
- Chuter, A.J. (1988). Introduction to Clothing Production Management. Blackwell Science, Oxford, pp. 60-63.
- Cooklin, G. (1991). Introduction to Clothing Manufacturing, Blackwell Science. Oxford, p. 104.
- Tyler, D.J. (1991).Material Management in Clothing Production, BSP Professional Books Press, London.
- Eberle, H., Hermeling, H., Hornberger, M., Kilgus, R. Menzer, D. Ring, W., (2004). Clothing Technology, Beuth-Verlag GmbH,Berlin.
- Glock RE, Kunz GI (1995) Apparel Manufacturing-Sewn Product Analysis. Prentice Hall, New Jersey, USAp.4.
- Hui C, Ng S (1999) A study of the effect of time variations for assembly lime balancing in the clothing industry. International Journal of Clothing Science and Technology 11(4): 181-188.
- Kursum S, Kalaoglu F (2009) Simulation of Production Line Balancing in Apparel Manufacturing. FIBRES & TEXTILES in Eastern Europe 17(4): 68-71.
- (2001) Labor Management in Development Journal. 2(7): 1-5.
- (2000) World Bank development research group.
-
Champa Saha, Tarikul Islam. Improvement of Efficiency and Productivity Through Machine Balancing in a Sewing Line J Textile Sci & Fashion Tech. 2(4): 2019. JTSFT.MS.ID.000541. DOI: 10.33552/JTSFT.2019.02.000541.
-
Sewing, design, Bottleneck process, Productivity, Line-balancing, Apparel Industry, Efficiency, Garment
-

This work is licensed under a Creative Commons Attribution-NonCommercial 4.0 International License.


