


 Research Article
School Finance Equity, Adequacy, and the Need for Greater Rural School Funding
Received Date: May 24, 2023; Published Date: July 05, 2023
Abstract
This research reviews equity and adequacy research and then conducts an analysis of the Ohio school funding system. Consistent with literary and judicial records, the analysis finds that the school funding system is inequitable and inadequate. Utilizing a successful school’s approach to measuring adequacy, the school districts that are letter-graded A and adequately funded are high-wealth, suburban school districts. The school districts that are letter-graded D and inadequately funded are predominantly low-wealth, rural and small-town school districts. Other findings are that rural school districts make greater use of alternative revenue sources and outsourcing in comparison to suburban school districts. Recommendations are made for equity funding, excess poverty funding, and categorical funding for rural school districts. Recommendations are also made for further research that will place rural school funding challenges at the forefront of scholarship and public policy.
Introduction
Public school funding is continuously under attack. The Great Recession rationales for cutting government funding and encouraging free market policies have set-in and remain pressurized. More than a century’s progress in funding America’s schools is retracting and possibly disappearing forever. Against this backdrop, the importance of understanding school finance equity and adequacy has increased [1]. These American ideals and scholarly conceptualizations can be measured empirically, and they convey the status of America’s public school funding system. To be clear, equity and adequacy are irrevocable cornerstones of the American public school funding system.
This research reviews the underpinnings of school finance equity and adequacy, referencing several research studies and court cases. The studies and cases collectively consider several states before the emphasis turns to Ohio. The major reason for emphasizing Ohio is the state’s rich history of litigation addressing school finance equity and adequacy. There have been no less than three Ohio Supreme Court cases about school finance that span 80 years [2-4]. Collectively, the three cases convey multiple dimensions of school finance equity and adequacy in a state that is substantially rural.
Following the literature review, the equity and adequacy of Ohio school funding are measured. The measurements reveal degrees of inequity and inadequacy and are followed by the identification of school districts that are most disadvantaged. These school districts are predominantly rural and, ironically, the literature places little emphasis on rural school district finance. Based on these findings, recommendations are made to improve school finance equity and adequacy generally and to specifically remediate rural school district funding deficiencies.
Background
School finance equity and adequacy are often discussed together because both have been conjoint objects of litigation and analysis. In litigation, nationwide court cases were organized into three waves by Thro [5,6]. Briefly summarized, the first wave began in the late 1960s and ended in 1973 and emphasized equity-based arguments in federal courts. The second wave began in 1973 and ended in 1989 and emphasized equity-based arguments in state courts. The first two waves sought equal protections that in financial terms would eliminate or reduce fiscal inequities. The third wave began in 1989 and marked the beginning of adequacy-based arguments in state courts. These adequacy cases sought to secure funding that would provide adequate schooling in all school districts. While the terms equity and adequacy can be separated conceptually, they are closely related in practice. Adequacy improvements inherently improve equity. More equitable funding typically pushes towards adequacy. On the downside, a highly equitable system can be inadequate. With these metrics in mind, once a court declares a school funding system equitable the next question must be whether the school funding system is adequate.
Equity measurements can take on a variety of forms. Several of these forms were explained by Berne and Stiefel [7]. Despite the guidance these authors provided, no universal agreement emerged as to which form of measurement was the best. What emerged were perceptions that inequities were greatest in urban and rural communities. These perceptions could be associated with economies of scale for which a “U” shaped curve depicted inefficiencies inherent to large and small schools [8]. Yet, despite this commonality shared by urban and rural school districts, challenges faced by urban school districts drew greater attention in the literature [8-13]. Attenuated treatment of rural school district finance is most unfortunate because rural school districts too suffer consequences from restricted budgets, lack of funding, and associated lack of resources [14]. Rural school districts also disproportionately serve the needs of children living in poverty. For example, according to the Southern Education Foundation [15], 44% of students in attendance at rural schools across the nation are from low-income households. Associated proportions include 51% of students in attendance at rural schools in the South are from low-income households and 60% of students in attendance at rural schools in Arkansas, Louisiana, Mississippi, and Oklahoma are from low-income households.
In terms of litigation, rural school advocates have achieved some successes in the courtroom. Dayton [9] found there were 17 court opinions recognizing rural school funding challenges. Four of these opinions were rendered twice in West Virginia and once each in Georgia and Kentucky. In West Virginia, Pauly v. Kelly [16] found that education was a fundamental right and noted that the state’s school funding system was historically inequitable. This line of judicial attention continued when Pauley v. Bailey [17] found that West Virginia’s school funding system disadvantaged sparsely populated and property-poor school districts. In Georgia, McDaniel v. Thomas [18] noted that rural school districts deserved a fairer share of statewide school funding and that it was incumbent upon the legislature to make this happen. Rose v. Council for Better Education [19] found that Kentucky’s school funding system was unconstitutional and noted that all children, regardless of wealth, were entitled to equal educational opportunities. One judge in Rose v. Council for Better Education [19] wanted the court to go further to ensure that unequal property valuations and taxes would not continue to disadvantage “children of the poor and those who reside in rural areas” (p. 221).
In terms of analysis and litigation, more often than not, the equity or fairness of the overall school funding system receives the focus of attention. That is, the primary emphasis of school finance equity analysis is statewide and illustrates differences between highly funded and lowly-funded school districts. Little attention is paid to the different types of school districts. In contrast, Dayton [9] delivers cogent analysis of rural, urban, and suburban advocacies as they relate to constitutional law and the courts. This study follows suit with a similar pattern of analysis within the context of constitutional litigation. First, an analysis is conducted of statewide equity and adequacy measures. Second, different types of school districts are considered. The latter section emphasizes rural school districts and their unique funding challenges.
Adequacy measurements have been made using several different methodologies. The methodologies do not compete with each other in as much as different methodologies are adapted by different scholars and consultants for different types of analyses. Nonetheless, an instructive review of several different adequacy methodologies was proffered by Baker, Taylor, and Vedlitz [20]. These authors created a typology that included six different school finance adequacy methodologies. The methodologies were described as professional judgment, evidence-based professional judgment, modified successful schools, production function, cost function, and successful schools’ models. Among these alternative models, the one that most clearly focuses attention on educational outcomes is the successful school’s model. The successful school model has at its core performance metrics such as letter grades that are linked to school funding amounts. For example, the amount of money that is spent by school districts achieving an A level of performance can be identified as adequate. This modeling approach was classified by Ladd and Hansen [21] as “inference from outcomes by empirical observation” (p. 114).
In terms of school finance adequacy litigation, a major turning point was reached when Rose v. Council for Better Education [19] was decided. Not only did Rose v. Council for Better Education [19] cite inequitable school funding conditions, but it also emphasized adequate educational outcomes. Along with Helena Elementary School District No. 1 v. State [22] and Edgewood Independent School District v. Kirby [23], Rose v. Council for Better Education [19] marked the beginning of the third wave of school finance reform litigation that Thro [5,6] depicted. These three school finance adequacy cases took into account whether the input received by school districts was sufficient to support successful schools. As identified by Dayton [9], Edgewood Independent School District v. Kirby [23] and Rose v. Council for Better Education [19] placed special emphasis on rural school districts. By implication, Helena Elementary School District No. 1 v. State [22] addressed rural school districts because “[n]early 45% of Montana schools had enrollments of less than 100 students” (p. 687).
The powerful nature of adequacy research can be seen in the rural school funding literature. While equity research can handily identify inequitable school funding conditions in rural communities [24-27], multiple literatures explicitly or implicitly touch upon adequacy and the consequences of being rural with limited resources [12,28-31]. The gap that remains in the literature is an accounting of statewide school funding that draws attention to rural school districts. This research begins to address that gap. Moreover, the statewide context is important because rural school funding exists within the statewide school funding calculus. Rural schools need general fund adjustments or categorical funding supplements that recognize their unique needs.
Analysis of Ohio School Funding
Equity measurements began with a fiscal year 2017 dataset of Ohio school district variables. The dataset included 607 of the total 612 Ohio public school districts [32]. The 607 school districts were organized in ascending order by expenditures per pupil. Afterwards, the expenditures per pupil were organized into quintiles. This was done to observe differences in expenditures per pupil across different segments of the distribution. The segmented observations were followed by the calculation of several equity statistics. The equity statistics included the fiscal year 2017 expenditure per pupil, mean, range, standard deviation, McLoone index, restricted range, federal range ratio, and coefficient of variation. After the statistics were calculated, the dataset was expanded to include fiscal year 2012 expenditures per pupil. Comparable equity statistics were calculated for observing whether equity increased or decreased from 2012 to 2017.
Adequacy measurements began with the original fiscal year 2017 dataset that was used to calculate equity statistics. For the adequacy measurements, the dataset was expanded to include academic performance data for the academic year 2017. The performance data were used to identify successful schools that achieved state-assigned letter grades of C, B, and A. The letter grades were used as benchmarks that determined whether school districts performed successfully, i.e., adequately. Once the adequately performing school districts were identified, their expenditures per pupil were averaged. The average was used to estimate the minimum required expenditure per pupil for each school district. School districts that spent less than the average received enough funds to match the average as the minimum required adequate expenditure per pupil. Although this funding method would not guarantee successful school district performance, it provided a rational means to adequately funding opportunities for success. The successful school’s methodology produced three different adequate expenditures per pupil: one using C as the benchmark for adequate school district performance; one using B as the benchmark for adequate school district performance; and one using A as the benchmark for adequate school district performance.
Winning and losing school districts under the current school funding system were identified using results from the adequacy measurement phase of analysis. Initially, the question was: What is the price of excellence? That is, how much school funding would it take for all school districts to achieve at an A level of performance? As the analysis proceeded, the initial question was answered by the adequacy measurements methodology. Afterwards, what remained to be seen was how the highest achieving school districts compared with the lowest achieving school districts. For this reason, all of the school districts that graded A were compared to all of the school districts that graded D. The comparison was designed to reveal the types of school districts that were winning and losing under the current school funding system.
Results from the Analysis
Equity measurements that were based on different segments of the expenditure per pupil distribution revealed substantial inequities. At the low end of the distribution, one school district spent $8,016 per pupil. At the high end of the distribution, another school district spent $23,908 per pupil. This nearly threefold difference was incorporated into an average expenditure per pupil of $11,166 for the entire distribution. The average was skewed toward the high end of the distribution because nearly three entire quintiles fell below it. Also interesting, the second and third quintiles of the distribution exhibited relatively low within-quintile variation. In contrast, the first quintile and especially the fifth quintile of the distribution exhibited high within-quintile variation. These findings are reported in (Table 1).
The figures in Table 1 clearly illustrate that inequities exist among school districts and that the inequities are substantial. Within quintiles, the range of variation in quintile five was extraordinary. Its $11,580 range of variation was greater than the $11,166 average expenditure per pupil for the entire distribution. The fifth quintile’s average expenditure per pupil also indicated that there was a high degree of inequity. The $14,045 average expenditure per pupil of the fifth quintile was $2,879 or 25.8% greater than the $11,166 average expenditure per pupil of the entire distribution. These calculations and observations preceded the calculation of the expenditure per pupil mean, range, standard deviation, McLoone index, restricted range, federal range ratio, and coefficient of variation. These equity statistics are reported in Table 2 for fiscal years 2012 and 2017 (Table 2).
Table 1: Expenditure Per Pupil Quintile Measurements, Fiscal Year 2017.
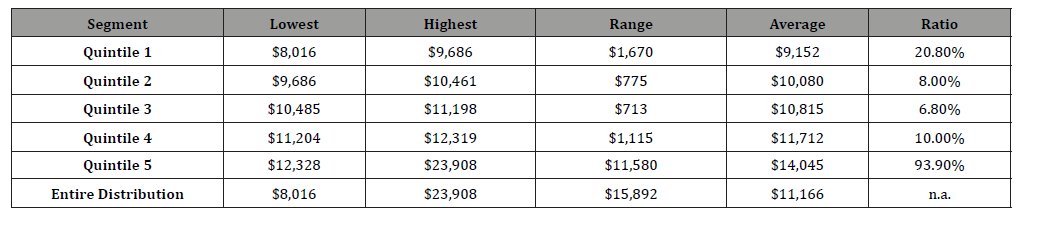
Table 2: Selected Equity Measurements, Fiscal Years 2012 and 2017.
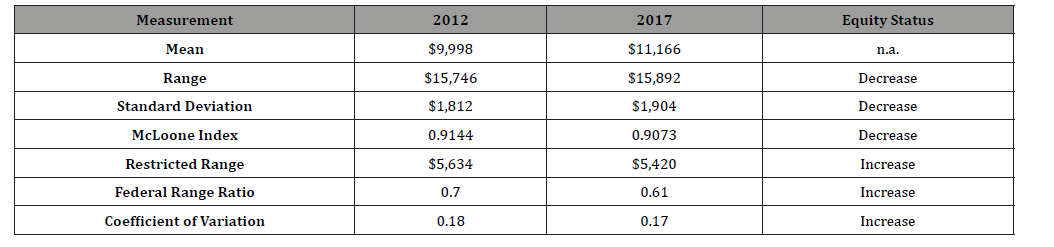
As illustrated by Table 2, the equity statistics yielded mixed results. For example, the range, standard deviation, and McLoone index statistics indicated that equity decreased from 2012 to 2017. In contradiction, the restricted range, federal range ratio, and coefficient of variation statistics indicated that equity increased from 2012 to 2017. The lack of direction that these statistics provided was less surprising when it was observed that the changes from 2012 to 2017 were quite small. For example, while the mean expenditure per pupil increased $1,168 during the period, the standard deviation increased only $92. Changes in the range and restricted range were only $146 and $214 respectively. More telling, the McLoone index decreased by only .0071 and the coefficient of variation decreased by .01. Even though the segmented observations of the distribution revealed substantial inequities, the comparison of equity statistics demonstrated that inequities were fairly stable or consistent over time.
Adequacy measurements were based on three potentially adequate letter grades of C, B, and A. With each letter grade set as the performance level for successful schools, a different adequate expenditure per pupil was estimated in association with the achievement of each letter grade. When C was considered a successful level of adequate performance, $10,897 was estimated as the adequate level of expenditure per pupil. When B was considered a successful level of adequate performance, $11,363 was estimated as the adequate level of expenditure per pupil. When A was considered a successful level of adequate performance, $14,633 was estimated as the adequate level of expenditure per pupil. As these differences in adequate expenditures per pupil grew, the differences in the numbers of school districts and students affected mounted quickly. For example, when C was set as the successful level of adequate performance, 42 school districts and 115,823 students were slated to receive financial remediation. When B was set as the successful level of adequate performance, the numbers jumped to 305 school districts and 657,684 students that were slated to receive financial remediation. When A was set as the successful level of adequate performance, the numbers jumped again to 578 school districts and 1,399,556 students that were slated to receive financial remediation. The estimated price of excellence was high. This price and those for other benchmarks of academic performance are reported in (Table 3).
Table 3: Adequacy at Different Performance Grade Levels, Fiscal Year 2017.

As illustrated by Table 3, the estimated costs of remediation are reasonable to begin with. For example, the price tag of helping 115,823 students receive adequate school funding would be about $94 million or approximately 1% of the $10 billion of stateprovided primary and secondary education funding [32]. The price tag of helping 657,684 students would be more pricey but likely manageable. The cost would be $834 million or approximately 8% of state-provided primary and secondary education funding. The price of excellence, however, would require major fiscal reforms. Helping 1,399,556 students would cost nearly $5 billion or 50% of state-provided primary and secondary education funding. In any case, the successful school’s approach to measuring school finance adequacy demonstrates that many Ohio school districts are underfunded.
Winning and losing school districts under the current school funding system were descriptively revealed by comparing school districts that graded A with school districts that graded D. Interesting in itself, only six school districts graded A. This small number of school districts gave further credence to claims that the school funding system was underfunded. Particularly pertinent to this study, none of the school districts that graded A were rural. All six were suburban. Furthermore, of the 42 school districts that graded D, 34 were rural or small-town school districts. To emphasize this characteristic of school district type, subsequent findings were broken down into three groups: 1. all school districts that graded A, 2. all school districts that graded D, and 3. all of the rural and small-town school districts that were among the school districts that graded D. The use of these three groups maintained the methodological integrity of comparing the highest and lowest performing school districts while also emphasizing the financial conditions of rural and small-town school districts.
Although the small number of school districts that graded A precluded the use of many statistical techniques, the straight averages of several variables among the three groups of school districts provided valuable insights. The most compelling and least surprising finding was that the school districts that graded A had much more money to spend than the school districts that graded D. The average expenditure of school districts that graded A was $14,628 per pupil compared to $9,944 per pupil for school districts that graded D. This spending advantage enjoyed by school districts that graded A was associated with a tax base advantage as well. The average property valuation of school districts that graded A was $284,711 per pupil compared to $131,865 per pupil for school districts that graded D. A similar pattern of fiscal ability was found in average incomes per school district. In school districts that graded A, the average income was $176,805 compared to $48,517 in school districts that graded D. On a relative basis, rural and smalltown average property valuations and incomes were slightly higher than those for the entire group of school districts that graded D. However, the rural and small-town average expenditure per pupil was slightly less than that for the entire group of school districts that graded D. These findings are reported in (Table 4).
Table 4: Comparisons Among School Districts that Graded A, Graded D, and Those that were Rural or Small Town and Graded D.
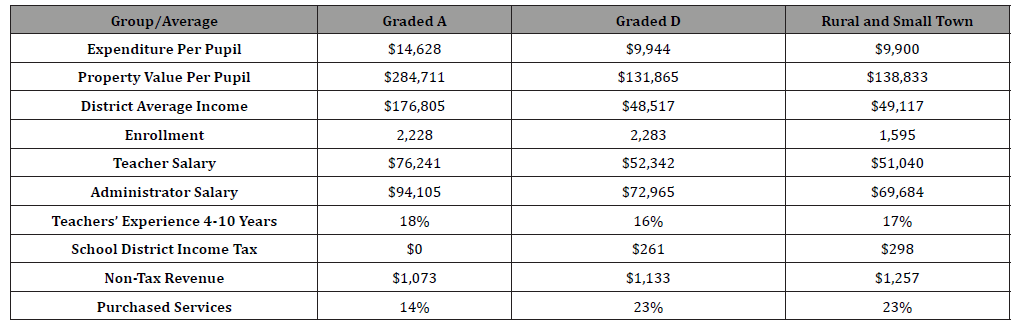
The average size of school districts was also noteworthy. The average enrollment of school districts that graded A was 2,228 while the average enrollment of school districts that graded D was 2,283. On the one hand, the average enrollment of school districts that graded D was misleading because it was skewed downward by enrollments in the large number of school districts that were rural and small town. The average enrollment for rural and smalltown school districts was 1,595. On the other hand, the school districts that graded D and had larger enrollments were small city school districts. Small city school district enrollments were not extraordinarily large and, judging from several other databased observations, small city school districts had commonalities with rural and small-town school districts. For example, small city school district teacher and administrator salaries were very closely aligned with rural and small-town school district teacher and administrator salaries. Small city and rural and small-town teacher salaries were approximately 32% lower than teacher salaries in school districts that graded A. Small city and rural and smalltown administrator salaries were approximately 24% lower than administrator salaries in school districts that graded A.
Across all three groups of school districts, similarities were found in the proportions of expenditures for fringe benefits, supplies and materials, and “other” expenses as well as pupil administrator ratios, and measures of teachers with 4 to 10 years of teaching experience. These variable measurements were nearly identical across all three groups of school districts. This suggested that what school districts spent their money on was fairly consistent. On the other hand, notable differences were found among the local school district income tax, non-tax revenue, and purchased services variables. First and foremost, none of the school districts that graded A had exercised the local school district income tax option. The local school district income tax option was however prevalent among school districts that graded D. In addition, all the school districts that graded D made greater use of non-tax revenues. Both local school district income taxes and nontax revenues were skewed toward rural and small-town school districts. Another potential indicator of fiscal stress purchased services was substantially different between school districts that graded A and school districts that graded D. School districts that graded A expended 14% of their budgets on purchased services. All school districts that graded D, that is, all rural and small town and small city school districts expended 23% of their budgets on purchased services.
Summary and Discussion
The findings of the equity and adequacy analyses as well as the breakdowns among winning and losing school districts can be summarized as follows:
1. An analysis of different segments of the expenditure per pupil distribution revealed a high degree of inequitable resourcing among Ohio school districts.
2. A successful school’s analysis of different state-assigned school district letter grades provided multiple estimates of inadequate resourcing among Ohio school districts.
3. A review of the highest and lowest state-assigned school district letter grades revealed that small city, rural, and smalltown school districts were disadvantaged in terms of Ohio school finance.
The equity findings were not inconsistent with the history of school finance reform litigation in Ohio. Consistent with Thro’s [5,6] first wave analysis, Board of Education of the City School District of the City of Cincinnati v. Walter [2] was an equity case that was argued in the state’s courts. Although the Ohio Supreme Court did not favor the plaintiffs in this case, justices recognized that there were undesirable fiscal inequities among Ohio school districts. These inequities persisted into the second wave of Thro’s [5,6] analysis when DeRolph v. State [3] was decided. DeRolph v. State [3] was a school finance adequacy case that consistently noted inequitable funding and resourcing among Ohio school districts. A follow-up study in this decade found that Ohio school funding inequities persisted [33]. The current analysis contributes further to this history of observations that declares the Ohio school funding system inequitable.
The adequacy findings buttressed the literary record that stemmed from the DeRolph v. State [3] litigation [34-40]. That Ohio school funding was inadequate became a fact of judicial and literary observation. A follow-up study in this decade found that Ohio school funding inadequacies persisted [41]. The current study contributes further to this history of observations that declares the Ohio school funding system inadequate. Where this study deviates from previous studies are in its accounting of different types of school districts that win or lose under the current school funding system. This study provides evidence that the winning school districts are high-wealth, high-expenditure, suburban school districts. Furthermore, the losing school districts are predominantly lowwealth, low-expenditure, rural and small-town school districts.
The financial issues that challenge these rural and small-town school districts are several. First, the tax bases of these rural and small-town school districts are 51% less than the tax bases of their suburban counterparts. Often considered the drivers of educational expenditures, tax bases that are inadequate can be associated with inadequate expenditures in rural and small-town school districts [27,30]. Furthermore, although local tax bases are the standard measure of financial capacity, local taxes for educational expenditures are ultimately paid for with local incomes. In this study, the resident incomes that are available to pay for educational expenditures in rural and small-town school districts are 72% less than the resident incomes found in suburban school districts. Generally speaking, relationships among property values, incomes, and educational expenditures enable human capital investments or signal inabilities to increase the stock of human capital locally [1]. A lack of human capital in the community has negative consequences for rural community economic development and reinvestment.
The small size of rural school districts is also inextricably tied to financial challenges. When it comes to raising revenue for fixed cost expenditures, small school districts typically have fewer parcels of land and fewer taxpayers to spread the costs over. When it comes to measuring fixed cost expenditures in terms of educational program delivery or on a per student basis, small school districts tend to have excessive costs. Deleterious consequences of these excessive cost measurements can be rendering some educational programs too expensive to deliver, cutting classes and courses because too few students are enrolled, or altogether eliminating advanced placement and gifted and talented experiences. Indeed, Howley, Rhodes, and Beall [42] and Puryear and Kettler [31] drew attention to the challenges of offering gifted education in rural school districts. Hartman [25] found inequitable funding in programming and services for special needs students in rural school districts. All of these curricular and programmatic issues are related, stemming financially from inadequate abilities to raise funds locally as well as small-scale organizational challenges.
An antidote to rural school district financial challenges is governmental aid. State aid can equalize educational expenditures for rural school districts and provide categorical aid for them as well. However, equalization aid will not likely be enough to conquer all financial challenges because statewide inequities are large to begin with. Categorical aid can make a difference if it is directed to the right areas, and it is enough. Some specific categories include sparsity aid that recognizes the inefficiencies associated with small scale; transportation aid that accounts for the vast distances that rural school buses travel; excess poverty aid; and supplements for special education, advanced placement programming, and gifted and talented education. In terms of excess poverty aid, the need is great. As a matter of comparison, the suburban school districts that graded A had a 7% poverty rate whereas the rural and smalltown school districts had a 55% poverty rate. Moreover, the insidious influences of poverty carryover to the financial structures of communities and, therefore, hamper the abilities of low-wealth school districts to raise funds locally. Poverty also influences the need for social services in rural schools [8]. Better known, poverty increases the need for free and reduced lunch programs that generally cost school districts more than federal and state subsidies provide. Perhaps the most expensive consequence of poverty is its negative influence on how prepared students are to learn.
Rural school districts suffer a marked disadvantage in the political sphere [9]. Rural school advocates do not have the same amount of influence as their urban and suburban counterparts. Barring other factors, wealthy, suburban communities have more money and residents who are influential in the political process. Large urban communities can have voting blocs and industrial tax base constituencies that lay claim to large amounts of governmental funding for their schools. At the federal level, massive entitlements are provided for economically disadvantaged children. Rural schools qualify for these funds based on their poverty rates. The problem is, on a per student basis, the dollar amounts of these entitlements are not enough. The money has its greatest impact when it can be pooled into accumulations of large amounts of funding. Without economies of scale working in their favor, rural school districts cannot accumulate large enough amounts of entitlement funds to overcome the costs associated with poverty.
When the financial solutions offered by state and federal governments are not enough, what is it that rural school districts can do? Based on the data presented in Table 4, it appears as though the rural and small-town school districts in this study are doing what they can do. Namely, they have established alternative revenue sources and attempted to streamline costs through purchased services, i.e., outsourcing. The alternative revenue sources that rural and small-town school districts have established include local school district income taxes and non-tax revenues. Different from the suburban school districts in this study, the rural and smalltown school districts need to rely on these alternative sources of revenue. To the greatest extent possible, rural and small-town school districts should continue seeking out alternative revenue sources. Additionally, rural and small-town school districts should seek out grants and never overlook opportunities to benefit from the benevolence of wealthy donors or citizens who would like to include the schools in their estate plans.
Outsourcing too can help stretch revenues further by reducing day-to-day expenditures. Common services that can be outsourced include food services, transportation, instructional services, and maintenance services [28]. In this study, nearly one-quarter of rural and small-town school district expenditures flowed to outsourcing. As a cost savings measure, this flow of funds indicates that rural and small-town school districts are doing what they can to save money. While the tactic of outsourcing should be encouraged as a means to addressing inadequate funding, outsourcing is not without its pitfalls. For example, how can school districts control the quality of services provided by outside vendors for things such as convenient bus routes, high quality nutritional food offerings, and frequently scheduled cleanings and maintaining of buildings and grounds? Furthermore, will the price of outsourced services be low initially and then spike after a few years? What about the employees? Will local citizens lose their jobs when essential school services are outsourced? These potentialities do not negate the benefits of outsourcing. Many problems can be avoided with thoughtful, mutually beneficial contracts. However, it stands to reason that outsourcing due to dire fiscal necessity can place school districts at a disadvantage when they are negotiating contracts for purchased services.
Looking ahead, rural, and small-town school districts need to continue pressing for alternative revenue sources and seeking ways to streamline expenditures. Pooling purchases of supplies, administrators including superintendents, and insurance and risk management have worked for some school districts. But it must be recognized that government aid is the greatest revenue source for rural and small-town school districts. Therefore, traditional government revenue sources must be attended to. Decreases in rural and small-town school district aid must be stopped and increases must be initiated. This will be difficult in the current political climate which leads to the importance of political influence and lobbying. In the political sphere, rural and small-town school districts might choose to form coalitions with other types of school districts. While several studies acknowledge the difficulties of defining “rural” [14,30,43-45], a data-based approach can identify similarities among several different types of school districts. For example, in this study, all the school districts that graded D had high poverty rates, relatively low property valuations, incomes, and expenditures per pupil, and increased dependence on alternative revenue sources and outsourced purchased services. Regardless of the “type” of school district, these school districts collectively shared much in common with each other.
An important perspective that can be learned from the results of this study is that common interests among coalited school districts can be organized around fiscal stressors rather than strictly school district typology. Poor suburbs, country cities, quasi-urban cities, townships, and multiple types of “rural” school districts share a variety of forms of impoverishment and might be able to formulate a powerful political movement. Further research can assist in this possibility. For example, what are the shared characteristics of rural school districts, and, by extension, what other types of school districts share the same characteristics? Although they are two different types, what are the common challenges that rural and urban school districts share? Do low-wealth, suburban school districts have more in common with rural school districts than high-wealth, suburban school districts? Answers to these questions will assist rural school district advocates as they disseminate information about rural school district financial challenges and lobby legislators for greater school funding.
At the ground-level, other important research questions persist. For example, even though small-scale school districts have disadvantages economically, do small-scale school districts have advantages educationally? Are there revenue-producing activities other than taxation that rural school districts can pursue to support educational programming? What forms of government or private resourcing are needed to enhance curricular offerings and services in rural school districts? Can entitlement funds be distributed on a sliding scale that adjusts for the unique needs of rural school districts? What more can be done to combat poverty in rural school districts and their surrounding communities? Which types of outsourcing are most advantageous to rural school districts and how can their cost-quality components be optimized? Can a guide be produced that assists school district administrators and school boards in assessing and contracting outsourcing opportunities? These questions are but a few of the many questions that can be researched to better understand and address rural school district financial challenges.
Conclusion
This study adds to the literature demonstrating that statewide school funding systems can be inequitable and inadequate. The study further delineates different types of school districts based on how they are letter-graded by state officials. This delineation brings to the forefront rural and small-town school districts in contrast with suburban school districts. The school districts that graded A in this study were high-wealth, suburban school districts. The school districts that graded D were predominantly low-wealth, rural and small-town school districts. While this study does not prove that more money leads to higher grades, it reveals powerful financial associations that can lead to similar conclusions.
Consistent with equity and adequacy understandings, this research draws connections between property valuations, local incomes, school district expenditures per pupil, and academic performance. Presuming that money does make a difference in educational settings, this study positively recognizes that rural and small-town school districts are seeking out alternative revenue sources and attempting to capture outsourcing efficiencies. Even with these rational economic pursuits in motion, rural and smalltown school districts continue to need assistance to overcome financial challenges. More governmental aid is needed. This research draws attention to this need and contributes to the rural school funding literature that must be better represented in future research and public policy formation.
Acknowledgment
None.
Conflict of Interest
No conflict of interest.
References
-

This work is licensed under a Creative Commons Attribution-NonCommercial 4.0 International License.