

 Research Article
America’s Learning Divide: Education Search Behaviour Across All 50 States in 2026 A Nationwide Search Behaviour Analysis Reveals the True Geography of Educational Ambition and Economic Necessity in America
Received Date:April 30, 2026; Published Date:May 21, 2026
Introduction
Every month, 1.28 million Americans search for learning. They look for tutors, test prep, piano lessons, and GED programs. They search at midnight, on a phone, from a zip code nobody has studied. Individually, these searches are invisible. Mapped across 50 states and normalized for population, they reveal something that surveys and school rankings do not: a real-time behavioural picture of who is investing in education, how urgently, and toward what end.
Educational attainment is one of the most replicated social determinants of health in the public health literature. Higher educational levels correlate with reduced mortality, lower rates of chronic disease, and stronger economic mobility.
Gaps in educational access, driven by income, geography, and structural underfunding, are associated with measurable population health deficits that compound across generations. What has received far less attention is whether digital behaviour can serve as an early proxy for these inequalities at scale.
The study by Wiingy, a tutoring marketplace offering live 1-on- 1 lessons across academics, test prep, music, languages, coding, and hundreds of other subjects, titled ‘America’s Report Card: Which States Need the Most Tutoring?’ presents three interlocking findings from a 50-state search behaviour analysis conducted between March 2025 and February 2026. First, a structural 2.4x learning demand gap exists between the highest and lowest LDI states, mirroring the geography of income inequality in America. Second, GED search clustering in rural and low-income states functions as a workforce recovery signal, not a student one.
Third, and most surprisingly, Wyoming, North Dakota, and Alaska lead all 50 states in STEM search concentration, exceeding California and Massachusetts by a factor of nearly three. Taken together, these findings suggest that learning search behaviour is not a neutral consumer activity. It is a population-scale signal shaped by the same structural forces that define social determinant inequality.
Methods
We compiled 1,746 unique search keywords spanning 25 learning subjects across 7 categories: STEM, Business and Quantitative, Technology, Languages, Music and Instruments, Wellness and Mind, and Test Preparation. Average monthly search volumes were extracted via Google Keyword Planner with location filters applied individually to each of the 50 U.S. states, covering
March 2025 through February 2026. The total dataset captured 1,280,080 average monthly searches.
Learning Demand Index (LDI): Tutoring Search Rate (TSR) was calculated as (Monthly Searches / State Population) x 100,000. The Learning Demand Index was then derived as (State TSR / National Average TSR) x 10, anchoring the national average at 10. A state scoring above 10 searches more intensely per capita than the average; a state below 10 searches less. GED search share was calculated as GED monthly searches as a percentage of each state’s total. STEM concentration was derived as the combined share of Math, Algebra, Calculus, Chemistry, Biology, Physics, and Coding searches within each state’s total volume.
Results
The Learning Demand Gap: A 2.4x Divide Across America
Vermont searches for educational help at 631 searches per 100,000 people each month. Oklahoma searches at 263. That is not a difference in population size. It is a difference in educational culture, household income, and the quiet confidence that help is something you are allowed to search for.
The Northeast dominates the top of the Learning Demand Index. All 11 Northeastern states sit above the national average of 10, with a regional average LDI of 13.19, which is 53 percent above the national benchmark. The pattern is consistent across every state in the region. New Jersey and Connecticut sit in the shadow of the most competitive college admissions corridors in America.
Massachusetts is the most degree-educated state in the country, and that orientation flows directly into how families invest in their children’s learning. The bottom 10 states cluster in the South and Midwest, where per-capita incomes are lower, school funding more constrained, and private tutoring has not become a household norm.
Table 1: Source: Wiingy Research, Google Keyword Planner, March 2025 to February 2026.
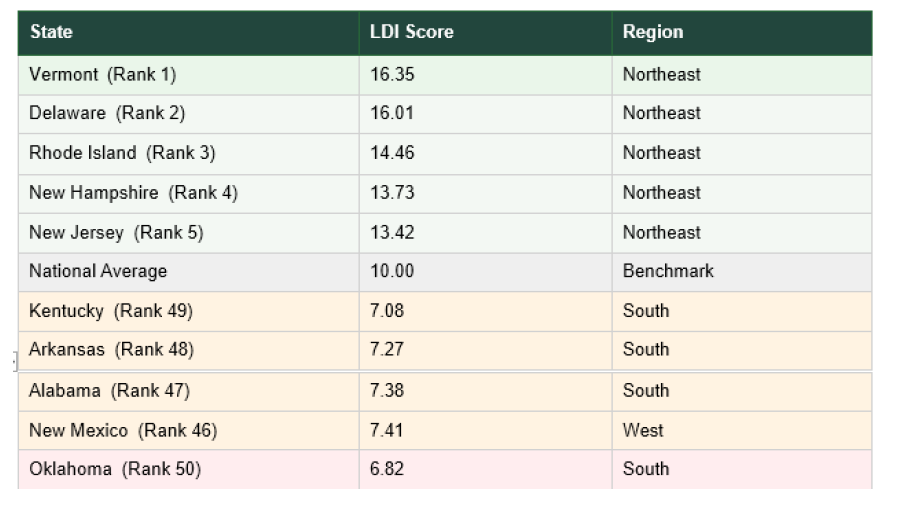
It is important to be precise about what low LDI means. In Oklahoma, Kentucky, and Arkansas, the educational need almost certainly exists. What is suppressed is the act of searching, not the need itself. This mirrors a well-documented pattern in public health: help-seeking behaviour is reduced by financial stress and limited digital infrastructure, not by the absence of need. A state that searches less is not a state that struggles less. It is often a state that has learned, over time, not to expect that help is available.
GED Search behaviour: An Economic Recovery Signal, Not a Student Signal
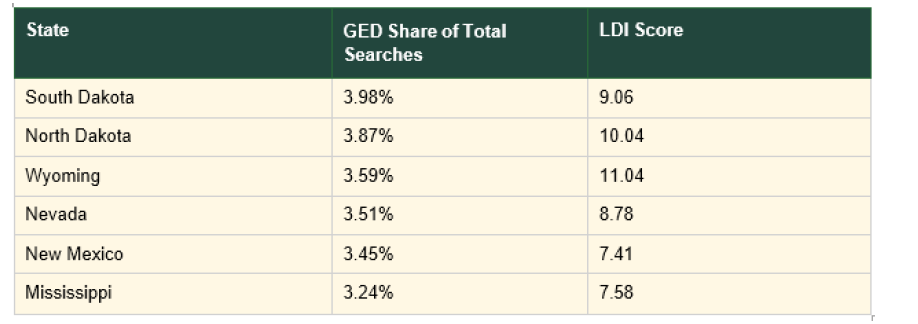
Nationally, GED-related keywords generate 27,020 monthly searches. The geographic distribution of those searches does not follow population size. It follows economic vulnerability. South Dakota leads at 3.98 percent of all state searches, followed by North Dakota (3.87%), Wyoming (3.59%), Nevada (3.51%), New Mexico (3.45%), and Mississippi (3.24%). The South as a region carries the highest GED burden nationally at 10,330 monthly searches, concentrated in states where school dropout rates, poverty rates, and healthcare access gaps are simultaneously elevated.
GED preparation is not a school-age activity. It targets adults who exited formal education before completion and are re-entering the credential system years or decades later, typically in response to job market pressure, a change in family circumstances, or a deliberate attempt to improve their economic position. In public health terms, GED search behaviour is a workforce recovery signal: a population attempting to restore employability and economic stability through credentialing.
The co-occurrence of low LDI scores and high GED search share in the same states points to a compounding disadvantage. These populations search less for educational enrichment overall, but when they do search, they are searching with urgency and economic necessity as the driver. That is a qualitatively different relationship with learning than the piano lesson searches that dominate in Vermont or New Jersey.
Table 2: Source: Wiingy Research, Google Keyword Planner, March 2025 to February 2026.
The Hidden STEM Belt: Wyoming, North Dakota, and Alaska Lead America
If you were asked to name the states where people search most intensely for STEM education, California, Massachusetts, and New York would be the obvious answers. The data says otherwise.
When STEM search volume is expressed as a share of each state’s total searches, controlling for the enrichment activity that dominates in wealthier states, a clear geographic inversion appears. Wyoming allocates 16.7 percent of all its learning searches to STEM subjects. North Dakota allocates 15.5 percent. Alaska allocates 13.9 percent. California, by comparison, allocates 5.7 percent. Massachusetts allocates 4.7 percent. New York allocates 4.4 percent.
Wyoming leads all states in Algebra and Calculus search share. North Dakota leads in Chemistry, Physics, and Coding. Iowa holds the highest single-subject Math concentration in the entire dataset at 8.0 percent of all state searches. These states do not have the raw search volume advantage that California or Texas enjoys. What they have is intent. In small states where piano lessons and yoga searches are proportionally fewer, STEM represents a larger, more deliberate share of what people choose to look for.
The interpretation matters. In states where economic diversification is limited and energy sector employment dominates; STEM search behaviour likely reflects a younger generation treating education as an economic mobility tool rather than an enrichment activity. North Dakota’s
position as the national leader in Coding searches, in a state with no significant tech industry, is not a market-driven signal. It is an aspirational one.
Discussion
These three findings describe a coherent picture of how educational demand is structured by inequality in America. The Northeast’s high LDI scores reflect populations searching from a position of existing advantage: strong household incomes, wellfunded schools, and a cultural expectation that supplementary learning is a normal investment in a child’s future.
The South’s lower LDI scores and elevated GED concentrations reflect populations where the same desire for educational advancement exists but is expressed under economic duress and typically later in life, after a period of workforce exclusion rather than in advance of it.
The hidden STEM belt introduces a more nuanced layer. Wyoming, North Dakota, and Alaska are not disadvantaged in the same way that Mississippi or Oklahoma are. They have relatively high median household incomes, driven by energy-sector employment. But they share with lower-LDI states a structural feature: limited local provision of specialized learning services, which amplifies online search as the primary access mechanism.
Their STEM concentration may reflect both genuine academic ambition and the substitution of online resources for in-person services that do not exist locally. That distinction matters for how public health and education policy practitioners think about intervention design.
From a population health perspective, search behaviour data of this scale offers a complementary surveillance instrument. Unlike survey-based assessments, which depend on self-report and sample design, search data captures revealed preferences at population scale, in real time, without social desirability bias. The patterns observed here are consistent with known social determinant frameworks and may offer earlier and lower-cost signals for identifying communities where educational intervention would have the highest health and economic return.
Limitations
This study measures search intent, not confirmed participation or program enrolment. Spanish-language searches are not captured, which may understate demand in California, Texas, and Florida. State-level LDI averages mask within-state variation between urban and rural populations. GED volume figures below 100 monthly searches in smaller states should be treated as directional rather than precise. Population normalization uses the most recent available Census estimates, and fast-growing states may reflect slight per-capita differences as populations shift.
Conclusion
Learning search behaviour is not evenly distributed across America. It is structured by income, geography, and the accumulated weight of educational access over generations. The 2.4x gap between Vermont and Oklahoma is not merely an educational data point. It is a behavioural reflection of a wider divide in health, economic opportunity, and the belief that educational help is something you are entitled to ask for.
GED searches clustering in rural, lower-income states tell a specific story: adults attempting economic recovery through credentialing, often years after formal schooling ended, in states where school funding and healthcare access are simultaneously strained. And the STEM ambition concentrated in Wyoming, North Dakota, and Alaska points to a population that is overlooked in national STEM investment narratives but is actively searching for the skills that could change their economic trajectory.
Future research should examine whether LDI scores correlate with population health outcomes at the county level, and whether targeted digital access to low-cost learning resources can shift search-to-participation conversion rates in states where the intent to learn is clear but the confidence and infrastructure to act on it remain limited.
Acknowledgment
None.
Conflict of Interest
No conflict of interest.
-

This work is licensed under a Creative Commons Attribution-NonCommercial 4.0 International License.