 Research Article
Secondary School Students’ Participation in Physical Education, Physical Activity, and Sports in Aotearoa,New Zealand
Ben Dyson1, Yanhua Shen2* and Pamela Kulinna3
1University of North Carolina at Greensboro, USA
2University of Virginia’s Collage at Wise, USA
3Arizona State University, USA
Yanhua Shen, University of Virginia’s Collage at Wise, USA.
Received Date:February 08, 2024; Published Date:March 01, 2024
Abstract
This study aims to examine the physical activity demographics of secondary school students in Aotearoa, New Zealand (NZ), and explore social-ecological factors that might influence students’ physical activity at schools. Grounded in a two-stage cluster sampling design, data from the Nationwide health survey database were collected from 27,500 secondary students in NZ. The study found that the most physically active students were 14 and 15 years old. Asian students reported significantly lower physical education (PE), physical activity (PA), and sports participation. The study also found that lower school decile, neighborhood deprivation, and urban environments led to lower participation in club and school sports. However, schools in low deciles and neighborhoods with high deprivation had increased participation in PE. To create more equitable opportunities for NZ students, efforts are needed to promote students’ engagement in PE, PA, and sports with the consideration of social-ecological factors.
Keywords:Physical education; Physical activity; Sports; New Zealand; Secondary school students
Introduction
There has been a growing emphasis in Aotearoa, New Zealand (NZ), and worldwide on teaching students how to be more physically active to improve general health and wellbeing [1–5]. In NZ, previous study found that students’ gender (i.e., male), age (i.e., younger), and socioeconomic status (i.e., higher SES) correlated to more time spent participating in sports [1]. Further, they reported more time spent in sports led to more physical activity among the students. Similarly, in Australia, previous studies reported that students who participated in club sports had higher levels of physical activity than those who did not participate [3]. In the United Kingdom, it was found that sports participation at nine years old was a strong predictor of sports participation at 12 years old. Previous study reported that participation in sports was inversely proportional to age in years nine to twelve [4]. Similarly, sports participation and physical activity were studied in the United States (US). Students who maintained sports participation from 7th (age 11-12) to 9th (age 13-14) grade (or the transition from middle to high school in the US) had significantly higher levels of moderate to vigorous physical activity (MVPA) and more total physical activity time assessed by accelerometry [6]. These findings were similar across male and female students. The authors also studied sedentary behavior and found consistent findings. The sports participants had less time spent in sedentary behavior as compared to nonparticipants with similar trends reported by females and males [6], as well as people with disabilities [7]. Sports participation by adolescents is also a strong predictor of physical activity in early adulthood [8]. These studies highlight the important role of sports participation in students’ physical activity patterns and lifelong physical activity engagement [8,9].
This paper investigated the prevalence of physical education (PE), physical activity (PA), and sports among secondary students in NZ through the social-ecological lens of schools, families, and neighborhoods. One study found that relationships with coaches, teammates, and friends were major influences on students to decide to continue or withdraw from a sport [10]. Strong social connections with others and opportunities for sports participation are positively associated with students’ physical activity engagement [11].
Findings from the current study support the findings from the Youth 2007 survey [12], which suggested that students’ physical activity interventions should address both students’ social and emotional wellbeing (opportunities for social engagement) and physical (access to recreational facilities) environments [13–15]. There have been significant changes in policies and interventions during this period to improve students’ cognitive, social, and emotional outcomes, along with their physical development and positive health behaviors. A previous study has shown positive changes brought by those interventions and policies in substance abuse, risky driving behavior, violence, sexual coercion, and abuse [16]. However, some areas still need important policy changes or evidence for future policy initiatives. For example, inconsistent condom and contraception use, bullying, being overweight or obese and significant depressive symptoms are areas where there has been either no improvement or negative changes [16]. The study also reported areas that have significantly worsened including access to family doctors and parents worrying about having enough money for food [16].
In this paper, we focus on secondary students’ participation in PE, PA, and sports. Our approach is supported by research that suggests that students who are involved in more PE, PA, and sports are healthier [17–19]. For example, the Centers for Disease Control and Prevention (CDC) indicates that the health benefits of PA for children include improved bone health, muscular and aerobic fitness, attention (or cognitive function), as well as promoting favorable body composition, and decreased risks of depression. Health-related outcomes have also been shown in PE programs. For example, students’ outcomes from the health-oriented PE (HOPE) programs have shown significantly increased MVPA, fitness, motor skills, academic achievement, favorably adiposity, and enjoyment of lessons [20]. As such, there have been multiple programs reported in recent media and scholarly papers that have attempted to engage students in more opportunities to increase their physical activity engagement [21–23]. However, these are not always successful and may not promote relationships leading to outside participation in PA and sports [24].
Scholarly work, in trying to better understand physical activity behavior, has emphasized a shift away from individual-based approaches toward more social-ecological perspectives [25]. Based on the social-ecological systems theory [26,27], individuals develop within a multi-level system of environmental and social organizations, ranging from more proximal micro-level systems to more distal macro-level systems. Thus, the development of students’ engagement in PA can be influenced by family socioeconomic status, family members, and friends in neighborhoods (microlevel system), environmental settings of residential communities (meso-level system), and society (macro-level system) [28]. Research grounded in the social-ecological systems theory focuses on how humans develop within those systems on four interrelated factors, including the process, the person, the context, and the time [29]. Among those four concepts, the process and the context are the two most important concepts that have been addressed in Bronfenbrenner’s social-ecological systems theory [30]. Bronfenbrenner and Morris described the “process” of human development as a “complex reciprocal interaction between an active, evolving biopsychological human organism and the persons, objects, and symbols in its immediate external environment” [29] (p. 996). Specifically, in the Health and PE curriculum, this socialecological approach is supported by the NZ curriculum. The NZ curriculum encourages teachers to use experiential education and pedagogical practices with a strong emphasis on education outside the classroom, health and PE, and a connection to the indigenous Māori culture.
There are several social factors and social organizations that influence students’ engagement in PE, PA, and sports, including friends, families, schools, and communities. Students’ physical activity engagement is a social product. Hohepa et al. suggested that we should help remove social deterrents such as trials and empower students with input into PE lessons and more sports teams at schools [31]. Efforts to improve students’ awareness of and access to safe facilities and opportunities to participate in a range of physical activities including but not limited to sports are suggested [31]. Previous studies in NZ have shown that quality PE with positive experiences can lead to an increase in students’ voluntary participation in sports outside the class [13,15]. A previous study showed the important role of PE classes in promoting participation in PA and sports outside of school. Sanchez-Oliva et al. studied students at 23 secondary schools in Spain framed using the Self-Determination Theory model and showed that when students perceived having basic psychological needs support from teachers, it led to positive attitudes and perceptions, as well as higher autonomous motivation, which further predicted students’ intentions to participate in PA and sports outside school [32].
Two research questions guided this study: First, what are the demographic features (age, gender, and ethnicity) for NZ secondary students’ participation in PE, PA, and sports in schools? Second, to what extent major social-ecological factors (school, home, neighborhood, and geography) may influence NZ secondary students’ participation in PE, PA, and sports by gender and age?
Based on the two research questions, the purpose of this study was to examine the physical activity demographics of secondary school students in NZ and explore social-ecological factors that might influence students’ physical activity at schools.
Methods
Research Design
This study was grounded in a two-stage cluster sampling design, ensuring a nationally representative sample of NZ secondary school students. The first sampling wave involved selecting a simple random clustered sample of NZ secondary schools. The second sampling wave involved selecting a simple random sample of secondary students from the sampled schools. The study recruited students from 91 schools, 12,503 students were randomly selected and invited to participate in the survey. Of these, 8,500 high school students (overall response rate of 68%) took part in a multimedia survey administered by computers in 2012. This is a huge data set for any country however, we consider NZ only had a reported population of 4.4 million in 2012 [13].
Context and Participants
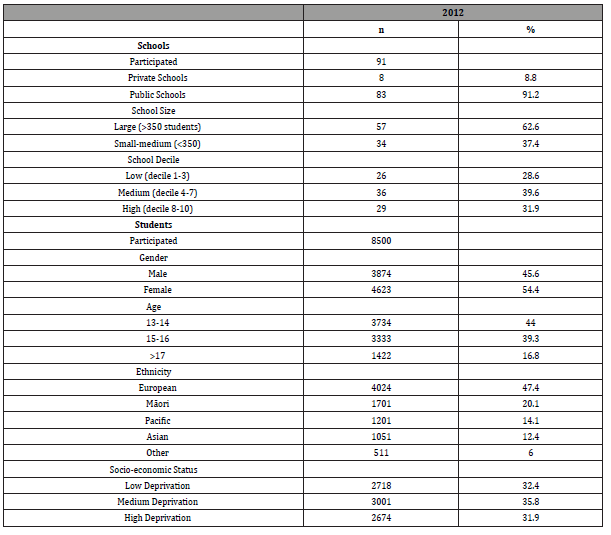
The study was conducted in NZ secondary schools in 2012. Each year, approximately 91 secondary schools were randomly selected across different regions in NZ. A total count of 301 NZ secondary schools participated in this study. Among those secondary schools, 7.6% were private schools, and 92.4% were public schools. Over 27,500 students (male = 13,199, female = 14,322) aged 13- >17years old participated in this study. The students came from a wide variety of racial backgrounds. 50.95% of the students were European, 22.78% were Maori, 10.52% were Pacific, 10.38% were Asian, and 5.37% were from other minority races. Based on the National Census data, 28.53% of the students lived in high deprivation, 37.07% lived in medium deprivation, and 34.39% lived in low deprivation. Considering the relatively small population size of New Zealand, the sample size we utilized for secondary school students is substantial and proportionate to its population. The sample included students from both public and private schools, encompassing diverse gender distributions, racial backgrounds, and socioeconomic groups. The characteristics of participating schools and students are presented in Table 1.
Table 1:Characteristics of Participating Schools and Students.
Assessments
Data for the current study was derived from a Nationwide health survey database called the Youth 2000 survey, which was administered by the Adolescent Health Research Group (AHRG) in 2012. The Youth2000 health survey program was funded by the Ministries of Youth Development, Social Development, Justice, Health, Department of Labor, Families Commission, and the Alcohol Advisory Council of New Zealand. The Youth2000 survey is a crosssectional, computer-based, self-administered, comprehensive health and well-being survey. The survey includes a wide range of themed questions related to the students’ demographics, ethnicity, family members and relationships, school academics and behaviors, physical and emotional health, food consumption, physical activities, neighborhood environment, etc. Data in the study was from the themed datasets regarding the students’ demographics, ethnicity, physical activities, family, and neighborhood.
Data Collection
The AHRG administered the Youth2000 survey with a representative sample of secondary school students throughout New Zealand in 2012. Trained data collectors helped with the survey process and provided survey instructions for the students at the participating schools. Students were asked to respond to the Youth2000 survey on the provided laptops. Each student responded to the survey questions by touching the appropriate box on the laptop screen. The questions are presented either in English or in Māori. Most of the survey questions were not forced-choice questions. Students could choose to not respond to the questions that did not apply to them or were too sensitive to respond to. For example, one question about PE, PA, and sports used was: “Why do you choose to do physical activity, sport or exercise?” (You may choose as many as you need. Choices: It’s fun, I get to hang out with friends, I like competing, I have to, or to keep fit). After completing the survey, data from each school were downloaded and compiled into a single data file for the 2012 data [13].
Data Analysis
Descriptive statistics were calculated for all variables. Bivariate analyses (using clustering and weighing) were utilized to determine the simple associations between dependent and independent variables. Dependent variables include the students’ self-reported engagement in 60 minutes of vigorous activity daily (VAD60), club sports participation, school sports participation, and school PE participation. Independent variables include the students’ age, gender, ethnic background, household deprivation, school decile, and neighborhood deprivation level. Results of data analysis are presented in percentages, and non-overlapping 95% Confidence Intervals (CI) were utilized to indicate whether or not a significant difference exists between the independent variables on a specific dependent variable. If the confidence interval for the difference in means between two groups does not contain zero, this suggests that the difference between the means is statistically significant at 95% level of confidence.
Results
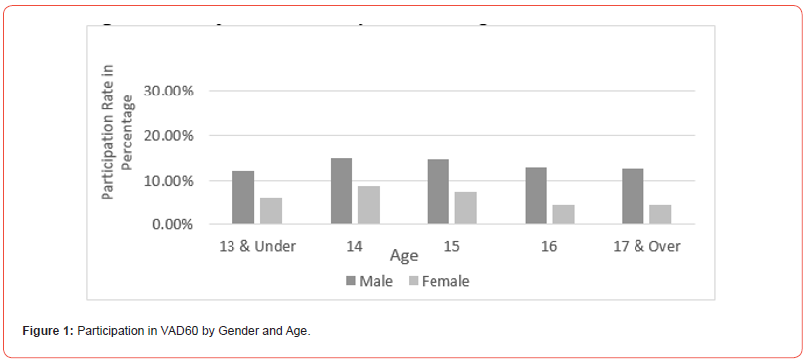
To investigate associations in physical activity patterns by gender, age, and ethnic background and relationships with social-ecological factors (i.e., school, home, neighborhood, and geography), descriptive statistics and bivariate analysis results are shown by participation in 60 minutes of daily physical activity. The engagement in 60 minutes of vigorous activity daily (VAD60) was most prevalent among 14 and 15 years old for both male and female students (see Figure 1). Within-group differences between 14 years old male students (95% CI, 11.85 – 18.15) and 15 years old male students (95% CI, 12.30 – 17.25) were not statistically significant since the difference in means between two groups contains zero. However, given the difference in means between two groups doesn’t contain zero, the 14 years old female students (95% CI, 7.17 – 10.55) reported significantly higher VAD60 than female students who were 13 years old and under (95% CI, 4.43 – 7.13) and 16 and older (95% CI, 2.99 – 5.90) (Figure 1).
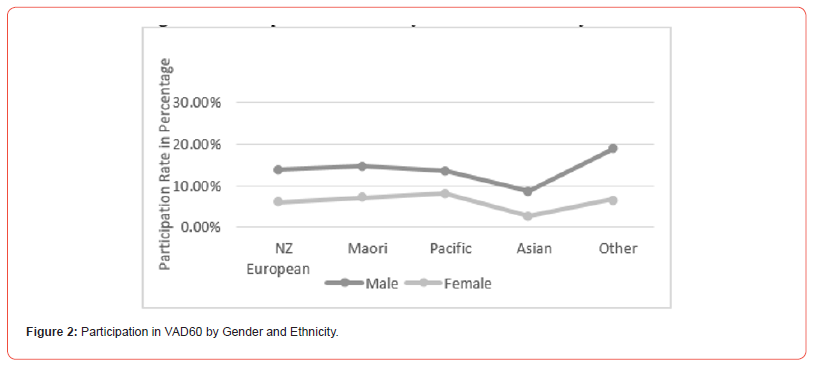
Regardless of gender, Asians reported the lowest engagement in VAD60 (Figure 2). Based on whether the difference in means between two groups contains zero or not, for Asian male students, the participation of VAD60 (95% CI, 6.42 – 10.92) was significantly lower than all other groups (95% CI, 11.97– 17.52), except for Pacific male students (95% CI, 10.67 – 16.30). Asian female students (95% CI, 1.22 – 4.29) were significantly lower than all other groups (95% CI, 5.17 – 10.23) (Figure 2).
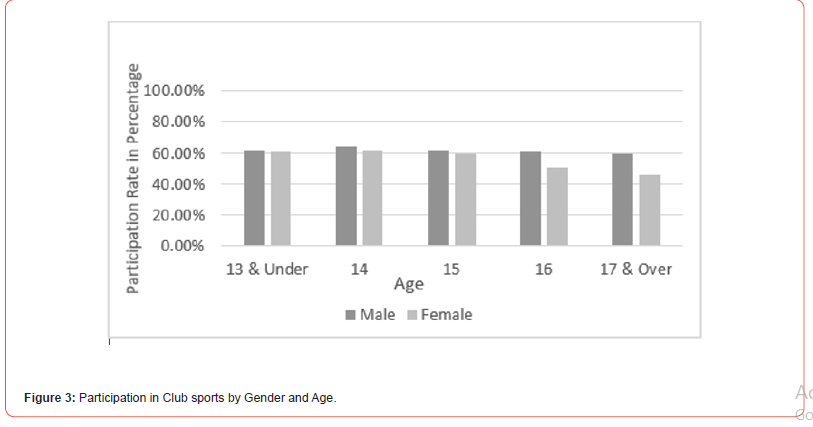
The analysis of the difference in means between two groups also indicated that the participation in club sports did not vary significantly by age among male students but did vary significantly for female students (see Figure 3). Specifically, female students in the youngest two age groups (95% CI, 56.39 – 66.21) were significantly higher than the female students in the oldest two age groups (95% CI, 41.15 – 55.30). Female students aged 15 had significantly higher participation in club sports (95% CI, 54.54 – 63.62) than those aged 17 and over (95% CI, 41.15 – 50.39), but not significantly differ from other groups (95% CI, 45.26 – 66.21) (Figure 3).
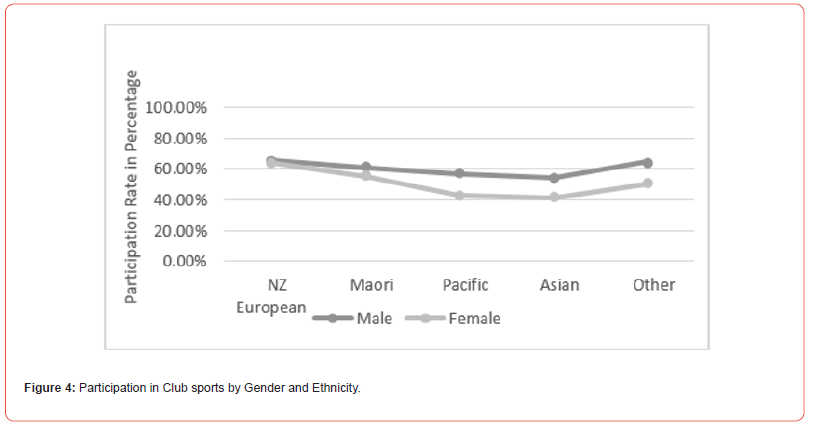
Regardless of gender, Asians reported the lowest participation rate in club sports with a 95% CI for male students [50.84 – 57.94] and 95% CI for female students [36.12 – 46.96] (Figure 4). For Asian males, the participation in club sports was significantly lower than NZ European students (95% CI, 61.74 – 69.16). For Asian females, participation in club sports was significantly lower than both NZ European and Māori females (95% CI, 50.73 – 67.94) (Figure 4).
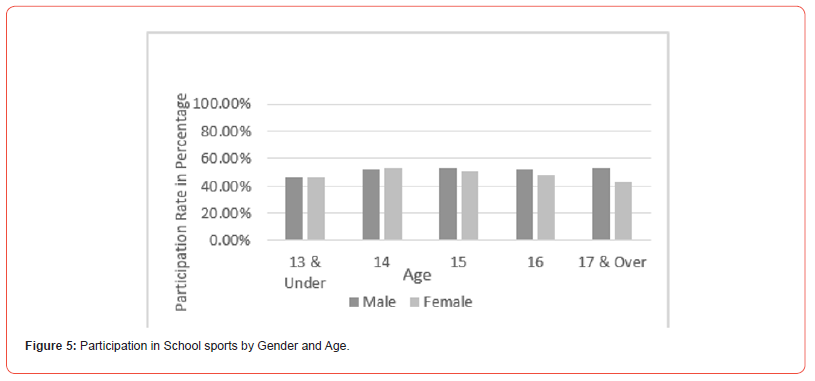
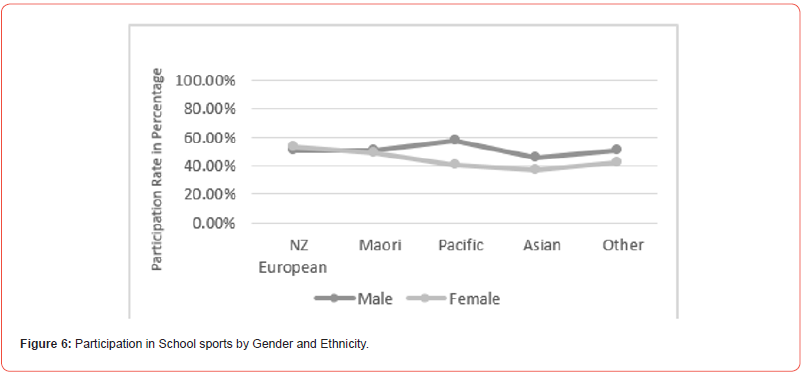
Based on Figure 5, participation in school sports did not vary significantly by age, regardless of gender based on the analysis of the difference in means between groups. However, it varied significantly by ethnicity regardless of gender (Figure 6). Asian students reported the lowest participation rates in school sports. For Asian males, the participation in school sports (95% CI, 41.10 – 50.88) was significantly lower than Pacific male students (95% CI, 53.52 – 62.08). For Asian females, the participation in school sports (95% CI, 32.26 – 42.62) was significantly lower than both NZ European (95% CI, 48.42 – 59.09) and Maori (95% CI, 43.93 – 54.50) (Figure 5,6).
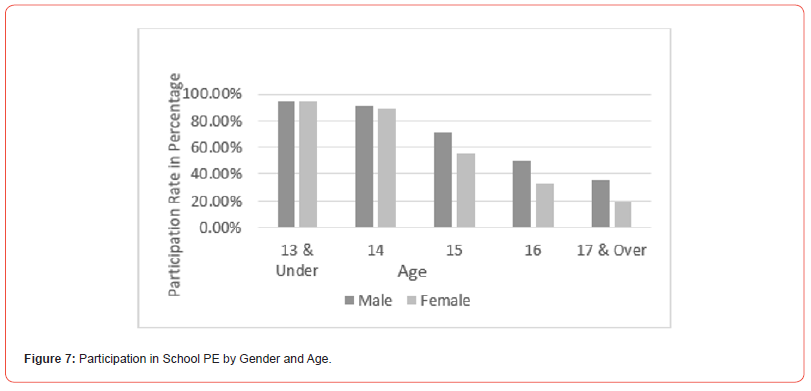
Participation rates in PE classes for both genders dropped significantly for each successive age group starting at 15 years (Figure 7). The participation rate of school PE for male students younger than 15 years old (95% CI, 85.71 – 96.18) was significantly higher than for those who were older than 15 years old (95% CI, 31.07 – 77.68). Similarly, the participation rate of school PE for female students younger than 15 years old (95% CI, 83.82 – 96.63) was also significantly higher than for those who were older than 15 years old (95% CI, 16.13 – 63.36) (Figure 7).
Regardless of gender, Asians reported the lowest participation rates in PE Class based on the comparison of the mean differences across groups (Figure 8). For Asian males, the participation rate of school PE (95% CI, 54.29 – 68.31) was significantly lower than Māori (95% CI, 72.80 – 81.49) and Pacific students (95% CI, 74.45 – 83.27). For Asian females, the participation rate of school PE (95% CI, 40.86 – 56.23) was significantly lower than NZ European (95% CI, 56.69 – 62.73), Māori (95% CI, 61.29 – 69.20), and Pacific students (95% CI, 61.29 – 72.24). Additionally, and somewhat surprisingly, NZ European male students also reported significantly lower rates of participation in PE (95% CI, 65.62 – 71.78) compared to Māori and Pacific students.
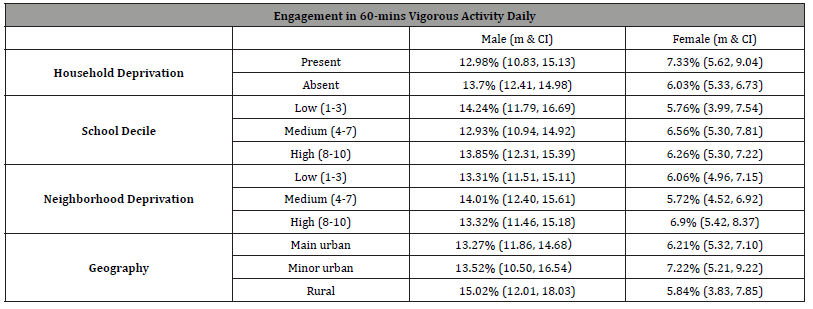
Based on the Table 2 information, all the social-ecological factors, including household deprivation, school decile, neighborhood deprivation, and geography, were not significant factors that have influenced the NZ students’ participation in VDA60 (Table 2).
Table 2:Social Factors Influencing Students’ Vigorous Activity.
* Difference in means between two groups does not contain zero which suggests statistical significance.
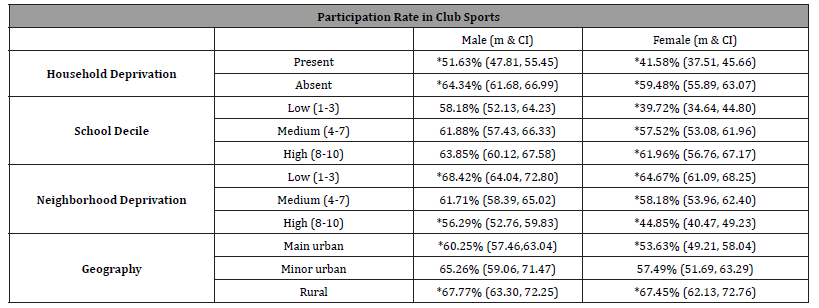
Importantly, even if not surprising, the presence of household deprivation significantly reduced participation in club sports for both male and female students (Table 3). Male students with household deprivation had a significantly lower rate of engagement in club sports (95% CI, 47.81 – 55.45) compared to those without household deprivation (95% CI, 61.68 – 66.69). Similarly, female students with household deprivation had a significantly lower rate of engagement in club sports (95% CI, 37.51 – 45.66) compared to those without household deprivation (95% CI, 55.89 – 63.07).
Table 3:Students’ Participation Rate in Club Sports.
* Difference in means between two groups does not contain zero which suggests statistical significance.
Interestingly, the school decile doesn’t significantly influence the participation rate of club sports for male students (Table 3). However, it did have a significant influence on female students. Female students who came from schools of low deciles reported significantly fewer participation rates in club sports (95% CI, 34.64 – 44.80) compared to those who came from schools of medium and high deciles (95% CI, 56.76 – 67.17).
The analysis of the means also indicated that neighborhood deprivation affects participation in club sports for both genders (Table 3). Among male students, the difference between those in the low (95% CI, 64.04 – 72.80) and high deprivation groups (95% CI, 52.76 – 59.83) was significant. Male students who lived in the medium deprivation neighborhood did not significantly differ from those who lived in the high and low deprivation neighborhoods. For female students, those in the low and medium deprivation neighborhood reported a significantly greater participation rate (95% CI, 53.96 – 68.25) compared to those in the high deprivation group (95% CI, 40.47 – 49.23).
Geography is a significant factor that influences the participation in club sports for both male and female NZ students, producing an identical linear pattern of results (Table 3). Male and female students who reside in main urban centers reported significantly lower rates of participation in club sports than those in rural areas. Those in minor urban were in the middle and not significantly different from the other two groups (Table 3).
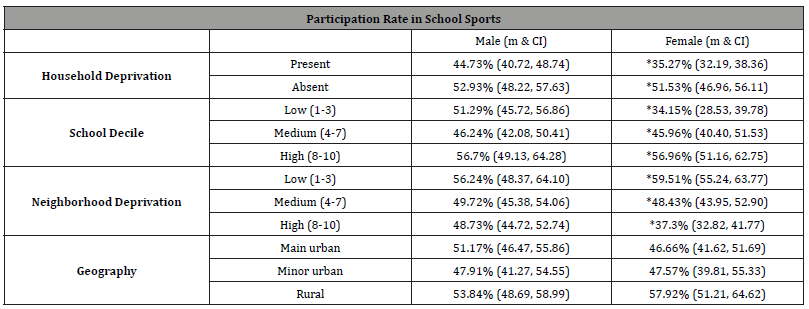
Table 4:Students’ Participation Rate in School Sports.
* Difference in means between two groups does not contain zero which suggests statistical significance.
The presence of household deprivation reduced participation in school sports for both male and female students (Table 4). Especially for female students, those with household deprivation had a significantly lower rate of engagement in school sports (95% CI, 32.19 – 38.36) compared to those without household deprivation (95% CI, 46.96 – 56.11).
School decile doesn’t significantly influence the participation rate of school sports for male students (Table 4). However, school decile significantly influenced the female students. Female students who came from schools of low deciles reported significantly fewer participation rates in school sports (95% CI, 28.53 – 39.78) compared to those who came from schools of medium and high deciles (95% CI, 40.40 – 62.75).
Similar to the household deprivation influence, neighborhood deprivation influenced participation in school sports for both genders, especially for female students (Table 4). Female students who lived in the low and medium deprivation neighborhood reported significantly greater participation rates (95% CI, 43.95 – 63.77) compared to those who lived in the high deprivation neighborhood (95% CI, 32.82 – 41.77).
Geography did not significantly affect participation in school sports for either gender, although rural females (57.92%) were 10% higher than urban females (46.66%) (Table 4).
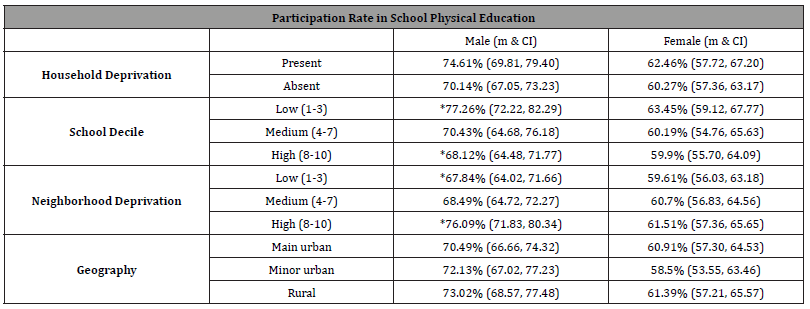
The presence of household deprivation did not significantly affect participation in PE classes for either male or female students (Table 5). Similarly, the school decile doesn’t significantly influence the participation rate of school PE for female students (Table 5). However, male students who came from schools of low deciles reported a significantly greater participation rate in school PE (95% CI, 72.22 – 82.29) compared to those who came from schools of high deciles (95% CI, 64.48 – 71.77).
Neighborhood deprivation significantly affected male students’ participation in school PE based on the mean difference analysis (Table 4). Male students who resided in the high deprivation neighborhood reported a significantly greater participation rate in school PE (95% CI, 71.83 – 80.34) compared to those who resided in the low deprivation neighborhood (95% CI, 64.02 – 71.66). Geography did not significantly affect participation in PE classes for both male and female students (Table 5).
Table 5:Students’ Participation Rate in School Physical Education.
* Difference in means between two groups does not contain zero which suggests statistical significance.
Discussion
Two research questions guided this study. First, we sought to better understand the demographic features (age, gender, and ethnicity) for NZ secondary students’ participation in PE, PA, and sports in schools. For both male and female secondary students, ages 14 and 15 were the most active with 12-18% of boys and 7-11% of girls meeting 60 minutes of vigorous physical activity daily. Findings reported that students either older or younger than 14 and 15 years old were less physically active. The result is a common trend and echoes with other studies across international settings, including the Republic of Ireland [33], New Zealand [1,34– 36] and the United States [37]. This issue is even more serious for girls who start with lower levels of PA participation. Both male and female students with Asian ethnic backgrounds were the least physically active. These findings are akin to the previous New Zealand National Youth’07 survey [38]. The previous National NZ physical activity data was reported as the number of days per week where students reached one hour per day of physical activity. The mean from the previous New Zealand National Youth’07 survey administration was 4.3 days of physical activity for an hour each week. Similar to the current findings, investigators reported that older students, female students, and students who reported their ethnic background as Asian did physical activity on fewer days than other students) [38]. Additional studies performed in Australia and New Zealand have also shown that Asian students with the lowest levels of PA [35,39,40]. We would suggest that programs that target increased students’ PA are needed. The current study found that only 7-18% of the students met the daily requirement of 60 minutes of vigorous physical activity and students’ PA engagement continued to decrease with age. Particular foci may be needed in programming for female and Asian students since both groups consistently report lower levels of PA and sports participation across settings. These findings must be addressed to promote the development of equitable social systems that provide students with the needed foundation and relationships for lifelong PE, PA, and sports participation.
NZ secondary male students did not show age-related declines in club sports or school sports. NZ girls, however, had significantly fewer club sports participation with age (e.g., 15 significantly higher than 17+). Girls reported similar levels of school sports participation across age groups. Similarly, Asian students had the least amount of club sports and school sports participation. Less participation in sports for students with an Asian ethnic background has also been shown to occur in the United States [4].
It is a very positive finding that NZ secondary male students did not decrease their club sports participation or school sports participation with age. However, girls (for club sports) and Asian students reported declines in both club and school sports participation as they became older. This result aligns with previous literature on sports participation, which shows a trend of decreased participation in sports as students get older [2,34,35]. Seabra found the frequency of male students’ participating in longer time blocks of sports increased while those with shorter time blocks of sports decreased with age [41]. Although students’ participation in sports decreases with age, those who do continue sports participation become more committed to it and spend a larger proportion of the year participating in sports [42]. Lack of excitement and opportunity to play with friends and lack of team spirit has been identified as top reasons for students withdrawing from sports [10]. A portion of the influence on participation could be attributed to the age at which they started the sports. Basterfield found that club sports participation at age 9 was strongly associated with sports participation at age 12 [3].
Similar to the overall PA, and sports trends, younger male and female secondary students were more active in PE. Participation rates dropped significantly starting at age 15 for both genders. Following consistent trends in this study’s results, Asian students reported the lowest participation rates in PE. Since students have compulsory PE at younger ages, they are more involved in it. However, students aged 11 to 13 are less likely to enroll and participate in PE consistently as PE is no longer a compulsory course in schools. The curriculum is also a factor that influences students’ participation in PE, PA, and sports. When the curriculum is delivered with high-quality pedagogical models or approaches, students’ PE, PA, and sports participation could be increased. The NZ curriculum uses a social-ecological approach in the Health and PE curriculum. The focus on education outside of the classroom and the links to the indigenous Māori culture support the healthenhancing PE, PA, and sports participation among NZ students.
In the second research question guiding this study, we sought to better understand the influence of major social-ecological factors on NZ secondary students’ participation in PE, PA, and sports by gender and age. Findings indicated that social-ecological factors, including household deprivation, school decile, neighborhood deprivation, and geography did not affect students’ overall engagement in 60 minutes of vigorous physical activity daily. However, household deprivation significantly reduced both male and female students’ participation in club sports and school sports. Other studies in New Zealand and Australia have also found higher deprivation areas with lower reported sports participation [1,43]. School decile did not affect male students in club sports and school sports participation. Female students’ sports participation rate was found significantly lower in schools with the lowest decile. Similar to household deprivation, neighborhood deprivation significantly limited both male and female students’ participation in club sports and school sports. Further, geography placed similar limitations on sports participation. Findings revealed that male and female students in urban centers or metropolitan areas had significantly lower club sports (only) participation than in rural areas. Interestingly, records of people registered with sports clubs in Victoria Australia showed higher rates for metropolitan area club sports participation for students between the ages of 4-12 and adults 19-29, while the opposite was true for adolescents ages 14- 18, and adults over 30 years of age [44]. Another study in Australia reported higher rates of sports participation for rural students but did not differentiate between school and club sports 45. Notably, geography did not significantly deter school sports participation for either male or female students.
Social-ecological factors were found to influence students’ participation rates in PE programs. Schools of low deciles had the highest PE participation for male students compared to those in schools of high deciles. Students who experienced neighborhood deprivation also had the highest participation rates in PE. This highlights the critical role of PE in providing equity opportunities for all students. Students are empowered to learn health and PE and develop healthy behaviors at school, which contributes to the development of skills, attitudes, knowledge, and behaviors needed for a lifetime of physical activity.
Findings indicated that social-ecological factors influenced students’ ability to participate in club sports, school sports, and PE.
Environmental changes are needed to remove barriers related to household deprivation, school decile, neighborhood deprivation, and geography to participation in club sports, school sports, and PE programming. Utter et al recommended that programs that address social opportunities and social and emotional wellbeing were needed, as well as physical resources (access to club sports, school sports, and recreational facilities) [12]. The improvement of those social-ecological factors could help create a safe and enjoyable environment, which would increase students’ engagement in PA and sports [13–15,46].
There are also limitations to the current study. First, findings in the current study are based on the data in 2012 and might be considered as out-of-date. Second, the data analysis is based on the analysis of the confidence intervals rather than significance tests. However, although recent data is preferable, older data can still be a valuable resource for informing current discussions and gaining insights when recent data is not available or when the topic of interest is comprehensively covered. Additionally, certain aspects of the 2012 data may still be relevant today, such as demographic and physical activity trends, and the data’s nationwide comprehensiveness and rigorous collection and analysis can provide valuable insights. We also would argue that using confidence intervals can provide information on statistical significance, direction, and strength of effect [47,48]. Confidence intervals give a plausible range for the true population parameter at the level of data measurement and can be used to compare multiple groups and conditions simultaneously. In the current study, confidence intervals are used to analyze and present multiple dependent and independent variables in a comparable and organized manner for improved readability of the data.
Conclusion/Comment
This study investigated NZ secondary school students’ PE, PA, and sports participation and demographics. Similar to many other international findings, the study found that students became less involved in PA and sports (both club sports and school sports) as they became older. Female and Asian students were less physically active across several physical activities and sporting settings. Environmental factors including lower school decile, neighborhood deprivation, and urban environments contributed to decreased club and school sports participation. Critically important was that low deciles schools and high deprivation neighborhoods had increased participation in PE, highlighting the critical role of PE in providing equity for students ‘physical development. The study also suggests that social-ecological factors need to be a part of efforts to create more equitable opportunities for NZ students’ PE, PA, and sports participation in schools.
Acknowledgment
None.
Conflict of Interest
No conflict of interest.
References
- Mandic S, Bengoechea EG, Stevens E, Leon De La Barra S, Skidmore P (2012) Getting Kids Active by Participating in Sport and Doing It More Often: Focusing on What Matters. International Journal of Behavioral Nutrition and Physical Activity 9(86).
- Telford RM, Telford RD, Cochrane T, Cunningham RB, Olive LS, et al. (2016) The Influence of Sport Club Participation on Physical Activity, Fitness and Body Fat during Childhood and Adolescence: The LOOK Longitudinal Study. Journal of Science and Medicine in Sport 19(5): 400–406.
- Basterfield L, Reilly JJK, Pearce MS, Parkinson KN, Adamson AJ, et al. (2015) Longitudinal Associations between Sports Participation, Body Composition and Physical Activity from Childhood to Adolescence. Journal of Science and Medicine in Sport 18(2): 178–182.
- Pharr J, Lough NL (2014) Considering Sport Participation as a Source for Physical Activity among Adolescents. Journal of Physical Activity & Health 11(5): 930–941.
- Cairney J, Dudley D, Kwan M, Bulten R, Kriellaars D (2019) Physical Literacy, Physical Activity and Health: Toward an Evidence-Informed Conceptual Model. Sports Med 49(3): 371–383.
- Shull ER, Dowda M, Saunders RP, McIver K, Pate RR (2020) Sport Participation, Physical Activity and Sedentary Behavior in the Transition from Middle School to High School. Journal of Science and Medicine in Sport 23(4): 385–389.
- Diaz R, Miller EK, Kraus E, Fredericson M (2019) Impact of Adaptive Sports Participation on Quality of Life. Sports Medicine and Arthroscopy Review 27(2): 73–82.
- Telama R, Yang X, Viikari J, Välimäki I, Wanne O, Raitakari O (2005) Physical Activity from Childhood to Adulthood: A 21-Year Tracking Study. American Journal of Preventive Medicine 28(3): 267–273.
- Westerbeek H, Eime R (2021) The Physical Activity and Sport Participation Framework—A Policy Model Toward Being Physically Active Across the Lifespan. Frontiers in Sports and Active Living 3: 608593.
- Rottensteiner C, Laakso L, Pihlaja T, Konttinen N (2013) Personal Reasons for Withdrawal from Team Sports and the Influence of Significant Others among Youth Athletes. International Journal of Sports Science & Coaching 8(1): 19–32.
- Utter J, Denny S, Robinson EM, Ameratunga S (2011) Social and Physical Contexts of Schools and Neighborhoods: Associations with Physical Activity among Young People in New Zealand. Am J Public Health 101(9): 1690–1695.
- Utter J, Denny S, Robinson EM, Ameratunga S, Watson P (2006) Perceived Access to Community Facilities, Social Motivation, and Physical Activity among New Zealand Youth. Journal of Adolescent Health 39(5): 770–773.
- Clark T, Fleming T, Bullen P, Crengle S, Denny S, et al. (2013) Health and Well-Being of Secondary School Students in New Zealand: Trends between 2001, 2007 and 2012. Journal of Pediatrics and Child Health 49(11): 925–934.
- Dyson B, Howley D, Shen Y (2021) ‘Being a Team, Working Together, and Being Kind’: Primary Students’ Perspectives of Cooperative Learning’s Contribution to Their Social and Emotional Learning. Physical Education and Sport Pedagogy 26(2): 137–154.
- Utter J, Denny S, Teevale T, Peiris-John R, Dyson B (2015) Prevalence and Recent Trends in Overweight, Obesity, and Severe Obesity among New Zealand Adolescents. Childhood Obesity 11(5): 585–589.
- Clark Terryann, Fleming T, Bullen P, Denny S, Crengle S, et al. (2012) Youth ’12 Overview: The Health and Wellbeing of New Zealand Secondary Students in 2012.
- García-Hermoso A, Alonso-Martínez AM, Ramírez-Vélez R, Pérez-Sousa MÁ, Ramírez-Campillo R, et al. (2020) Association of Physical Education with Improvement of Health-Related Physical Fitness Outcomes and Fundamental Motor Skills Among Youths: A Systematic Review and Meta-Analysis. JAMA Pediatrics 174(6): e200223.
- Kokkinos P, Myers J (2010) Exercise and Physical Activity: Clinical outcomes and applications. Circulation 122(16): 1637–1648.
- Culpan I, Stevens S (Susie) (2017) Olympism, Physical Education and Attitudes and Values: What Do Graduating Teachers in Aotearoa, New Zealand Know and Understand? Asia-Pacific Journal of Health, Sport, and Physical Education 8(3): 259–272.
- McKenzie TL, Sallis JF, Rosengard P, Ballard K (2016) The SPARK Programs: A Public Health Model of Physical Education Research and Dissemination. Journal of Teaching in Physical Education 35(4): 381–389.
- Kulinna P (2011) Increasing Pupil Physical Activity: A Comprehensive Professional Development Effort. Biomedical Human Kinetics 4(2012): 6–11.
- Shen Y, Rose S, Dyson B (2022) Social and Emotional Learning for Underserved Children through a Sports-Based Youth Development Program Grounded in Teaching Personal and Social Responsibility. Physical Education and Sport Pedagogy 29(1): 115–126.
- Gruno J, Gibbons SL (2020) Incorporating Nature-Based Physical Activity in Physical and Health Education. Journal of Physical Education, Recreation & Dance 91(3): 26–34.
- Burrows L, Wright J (2007) Prescribing Practices: Shaping Healthy Children in Schools. The International Journal of Children’s Rights 15(1): 83–98.
- Glanz K, Rimer BK, Viswanath K (2008) Health Behavior and Health Education: Theory, Research, and Practice. John Wiley & Sons.
- Bronfenbrenner U (1992) Ecological Systems Theory. In Six theories of child development: Revised formulations and current issues. Jessica Kingsley Publishers: London, England, pp. 187–249.
- Bronfenbrenner U (1979) The Ecology of Human Development: Experiments by Nature and Design. Harvard University Press.
- Bornstein MH, Lamb ME (2010) Developmental Science: An Advanced Textbook. Sixth Edition, Psychology Press.
- Bronfenbrenner U, Morris PA (1998) The Ecology of Developmental Processes. In Handbook of child psychology: Theoretical models of human development. Volume 1, 5th ed; John Wiley & Sons Inc: Hoboken, NJ, US, pp. 993–1028.
- Tudge JRH, Mokrova I, Hatfield BE, Karnik RB (2009) Uses and Misuses of Bronfenbrenner’s Bioecological Theory of Human Development. Journal of Family Theory & Review 1(4): 198–210.
- Hohepa M, Schofield G, Kolt GS (2006) Physical Activity: What Do High School Students Think? Journal of Adolescent Health 39 (3): 328–336.
- Sanchez-Oliva D, Sanchez-Miguel PA, Leo FM, Kinnafick FE, García-Calvo T (2014) Physical Education Lessons and Physical Activity Intentions Within Spanish Secondary Schools: A Self-Determination Perspective. Journal of Teaching in Physical Education 33(2): 232–249.
- Murphy MH, Rowe DA, Woods CB (2016) Sports Participation in Youth as a Predictor of Physical Activity: A 5-Year Longitudinal Study. Journal of Physical Activity and Health 13(7): 704–711.
- Hardie Murphy M, Rowe DA, Woods CB (2016) Sports Participation in Youth as a Predictor of Physical Activity: A 5-Year Longitudinal Study. Journal of Physical Activity & Health 13: 704–711.
- Utter J, Denny S, Robinson EM, Ameratunga S, Watson P (2006) Perceived Access to Community Facilities, Social Motivation, and Physical Activity among New Zealand Youth. Journal of Adolescent Health 39(5): 770–773.
- Oliver M, Mavoa S, Badland H, Parker K, Donovan P, et al. (2015) Associations between the Neighborhood Built Environment and out of School Physical Activity and Active Travel: An Examination from the Kids in the City Study. Health and Place 36: 57–64.
- Dishman RK, McIver KL, Dowda M, Pate RR (2018) Declining Physical Activity and Motivation from Middle School to High School. Med Sci Sports Exerc 50(6): 1206–1215.
- Utter J, Denny S, Robinson E, Ameratunga S, Milfont TL (2011) Social and Physical Contexts of Schools and Neighborhoods: Associations with Physical Activity Among Young People in New Zealand. Am J Public Health 101(9): 1690–1695.
- Oliver M, Parker K, Witten K, Mavoa S, Badland HM, et al. (2016) Children’s Out-of-School Independently Mobile Trips, Active Travel, and Physical Activity: A Cross-Sectional Examination from the Kids in the City Study. Journal of Physical Activity & Health 13(3): 318–324.
- Strugnell C, Renzaho AMN, Ridley K, Burns C (2015) Physical Activity and Sedentary Behavior among Asian and Anglo-Australian Adolescents. Health Promotion Journal of Australia 26(2): 105–114.
- Seabra AFA, Mendonça DMD, Thomis MA, Malina RM, Maia JA (2007) Sports Participation among Portuguese Youth 10 to 18 Years. Journal of Physical Activity & Health 4(4): 370–380.
- Richards R, Williams S, Poulton R, Reeder AI (2007) Tracking Club Sport Participation from Childhood to Early Adulthood. Research Quarterly for Exercise and Sport 78(5): 413–419.
- Dollman J, Lewis NR (2010) The Impact of Socioeconomic Position on Sport Participation among South Australian Youth. Journal of Science and Medicine in Sport 13(3): 318–322.
- Eime RM, Harvey JT, Charity MJ, Casey MM, Westerbeek H, et al. (2016) Age Profiles of Sport Participants. BMC Sports Science, Medicine, and Rehabilitation 8(6): 1–10.
- Vella SA, Cliff DP, Okely AD, Scully ML, Morley BC (2013) Associations between Sports Participation, Adiposity and Obesity-Related Health Behaviors in Australian Adolescents. The International Journal of Behavioral Nutrition and Physical Activity 10(1): 113.
- Andersen PL, Bakken A (2019) Social Class Differences in Youths’ Participation in Organized Sports: What Are the Mechanisms? International Review for the Sociology of Sport 54(8): 921–937.
- Du Prel JB, Hommel G, Röhrig B, Blettner M (2009) Confidence Interval or P-Value? Dtsch Arztebl Int 106(19): 335–339.
- Shakespeare TP, Gebski VJ, Veness MJ, Simes J (2001) Improving Interpretation of Clinical Studies by Use of Confidence Levels, Clinical Significance Curves, and Risk-Benefit Contours. The Lancet 357(9265): 1349–1353.
-
Ben Dyson, Yanhua Shen* and Pamela Kulinna. Secondary School Students’ Participation in Physical Education, Physical Activity, and Sports in Aotearoa, New Zealand. Iris J of Edu & Res. 2(4): 2024. IJER.MS.ID.000541.
-
Physical education, Physical activity, Sports, New Zealand, Secondary school students
-

This work is licensed under a Creative Commons Attribution-NonCommercial 4.0 International License.


