 Research Article
Short and Long Term Forecast for Lightning Strikes and Casualties in Miami, USA
Ricardo Osés Rodríguez1*, Odalys Llanes Concepción2 and Rigoberto Fimia Duarte3*
1Forecasting and Weather Department, Provincial Meteorological Center of Villa Clara, Cuba
2Municipal Directorate of Architecture and Urban Planning. Santa Clara, Villa Clara, Cuba
3Hygiene and Epidemiology Department, Faculty of Health Technology and Nursing (FHTN), University of Medical Sciences of Villa Clara (UMS-VC), Cuba
Ricardo Osés Rodríguez, Forecasting and Weather Department, Provincial Meteorological Center of Villa Clara, Cuba Rigoberto Fimia Duarte, Hygiene and Epidemiology Department, Faculty of Health Technology and Nursing (FHTN), University of Medical Sciences of Villa Clara (UMS-VC), Cuba
Received Date: June 19, 2023; Published Date: July 05, 2023
Abstract
Lightning is the leading cause of death by natural phenomena, much more than cyclones. In the following research, a modeling of the number of people who have been struck by lightning in Miami, USA and the number of victims by this cause, during the period from 2007 to 2017 was performed; in addition, a short-term forecast and a long-term forecast up to 2030 were made using the methodology of Regressive Objective Regression (ROR), which is able to explain variance beyond white noise. The trend of the number of victims was increasing in 1 case, significant at 95 %. As for people struck by lightning, the trend was negative and not significant, so there is a high correlation between those struck by lightning and the risk of death, for a value of 78.4 %. The purpose of this prognosis is to alert health agencies and entities linked to climate monitoring in the USA so that they can take preventive measures in risk areas to try to reduce, and if possible, to reduce the number of deaths caused by lightning strikes.
Keywords:Fatalities; Miami; Forecasts; Lightning; ROR Regression
Introduction
Florida is the U.S. state with the most deaths due to Lightning strikes, according to statistics from the U.S. National Oceanic and Atmospheric Administration (NOAA). There have been 53 thunderstorm-related fatalities in this state between 2007 and 2017. Out of every 100 deaths that occur in the country between 10 and 13 occur in this so-called Sunshine State. Florida is known as the lightning capital of the United States with storms occurring approximately 100 days during the year, compared to California’s minimum of only 5 days, the most dangerous area runs from St. Augustine (north) to Lake Okeechobee (south) and from the east to west coasts. According to NOAA, 94% of the state’s lightning strikes are recorded between the last days of May and the last days of September. Experts in the field state categorically that “lightning kills more people in the United States than hurricanes and tornadoes combined”. Florida is the state most prone to these accidents because of its high heat levels, high humidity and its location between the Gulf and the Atlantic Ocean. In addition, the combination of rain clouds and high temperatures creates a perfect setting for thunderstorms and lightning.
The objective of this work is to model and forecast the number of fatalities and the number of people affected by lightning in Florida so that once these values are known, measures can be taken to reduce or eliminate them completely.
Materials and Methods
In this work, a modeling of the number of people who have been struck by lightning in Miami and the number of victims for this cause in the period from 2007 to 2017, a short-term forecast and a long-term forecast up to 2030 using the methodology of Regressive Objective Regression (ROR) [1-9].
For the forecast of the variables studied, the variables were modeled using the methodology of the Regressive Objective Regression (ROR) [10], for which, in a first step, dichotomous variables DS, DI and NoC were created where:
NoC-Number of base cases,
DS = 1, if NoC is odd; DI = 0, if NoC is even,
Subsequently, the module corresponding to the Regression analysis of the statistical package SPSS version 22.0 (IBM Company) was executed, specifically the ENTER method where the predicted variable and the ERROR are obtained.
Then the autocorrelograms of the variable ERROR were obtained, paying attention to the maximums of the significant partial autocorrelations PACF. The new variables were then calculated taking into account the significant Lag of the PACF. Finally, these regressed variables were included in the new regression in a process of successive approximations until a white noise in the regression errors was obtained.
Results and Discussion
The number of victims per lightning strike is a variable that represents a white noise, since so far it is a random event, although with this methodology it is possible to foresee the number of people that may be affected, and therefore, to take measures so that this does not occur, which has been applied to other phenomena, processes and infectious entities [1-6].
First, a descriptive analysis of the data of the victims and the number of people struck by lightning was performed (Table 1), showing that an average of 28 people were struck by lightning in Miami, and of these, five died from this cause, this is in a correspondence with [11]. The correlation between these variables was 0.784, which is significant at 99%.
Table 1: Results of the descriptive analysis of the data.

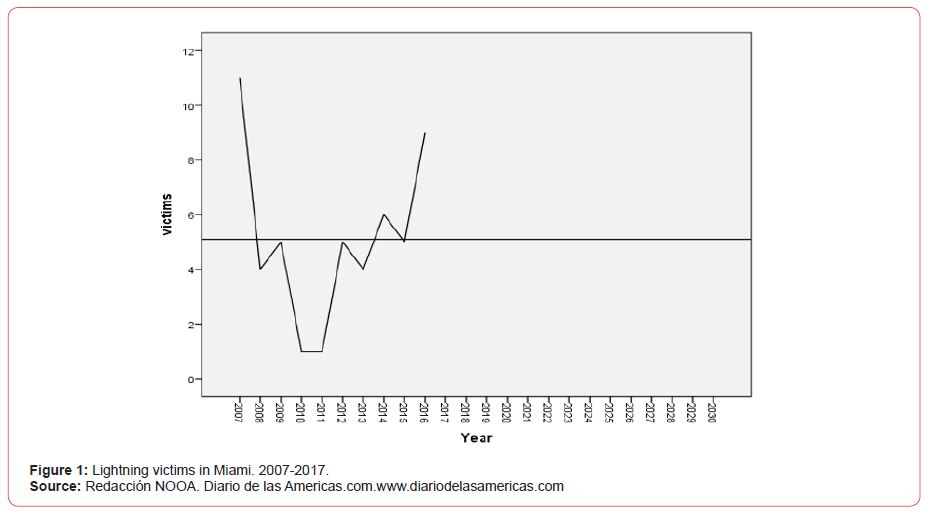
For the period studied, the maximum number of victims was 11 in 2007 (Figure 1).
Next, the models obtained for the deceased, this one explains 98.1% of the variance, with an error of 1.6 deceased. The model presents a Fisher’s F of 15.603 significant at 95%. The model depends on DS (sawtooth) and DI (inverted sawtooth), which are variables that contribute variance, although apparently not significant, while Step6 represents the importance of case 6 in the base and lag2 represents the number of victims two years ago, significant at 90%, while NoC is the trend of the series, significant at 95% (Table 2).
Table 2: Results of the models obtained for the deceased.

As for the persons struck by lightning (Table 3), the ROR model explains 98.3% of the variance in the short term, with an error of 7,138 cases, and a Fisher F of 28.940 significant at 99%. The model in question depends on the variables sawtooth (SD), and inverted sawtooth (IS), significant at 99 %, while NoC is significant to the decrease, at 90 %. Lag1 is the cases regressed in 1 year, i.e., the previous year. Step6 represents the impact of case 6, where a decrease in eight cases occurred.
Table 3: Results for cases of people struck by lightning.

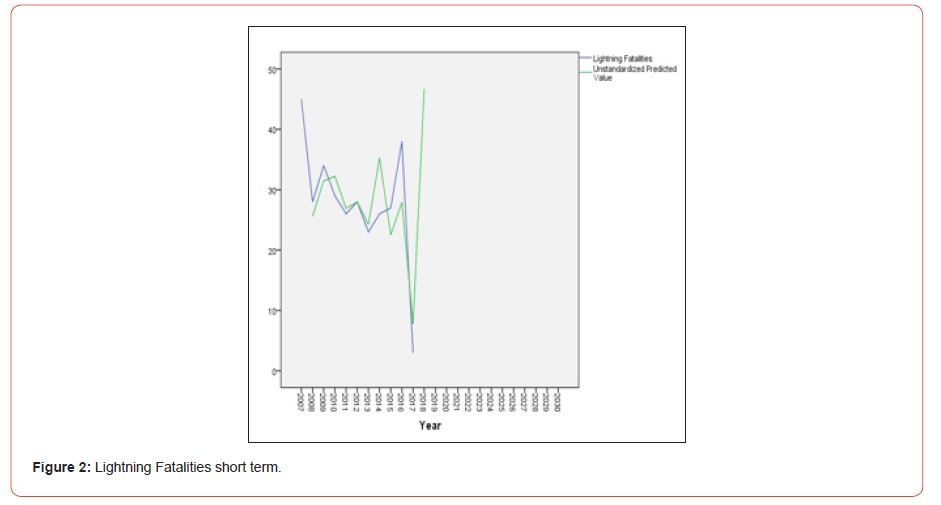
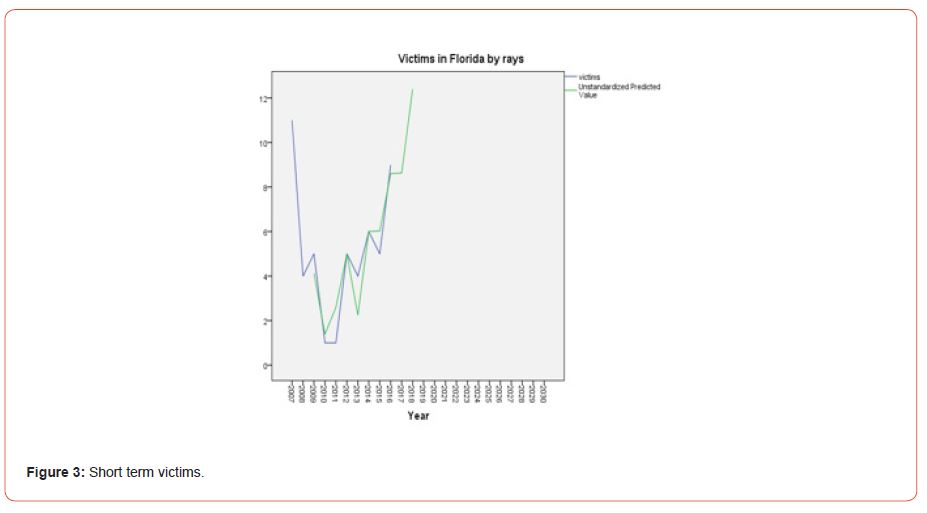
Figures 2 and 3 show the short-term forecast for the variables studied. Both variables forecast high values, despite the fact that the 2017 data for lightning strikes are preliminary.
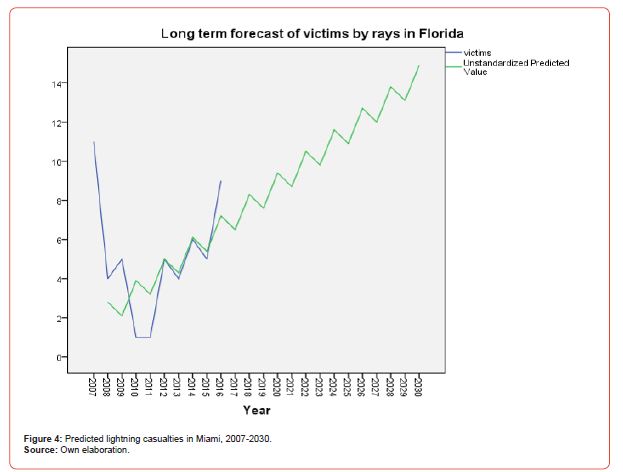
The long-term model for victims also shows an increase in the number of cases, which could reach 14 cases by the year 2030 (Figure 4).
Only the health management bodies can take measures to reduce the number of deaths and lightning strikes.
Conclusion
The tendency of the number of victims is increasing in 1 case, significant at 95%, while in relation to the people struck by lightning, the tendency was negative and not significant, so there is a high correlation between those struck by lightning and the risk of death, corroborated by the models obtained, both for the deceased and those struck by lightning.
We suggest strategies to reduce deaths due to lightning like for example campaigns of concern in the beach, where rest the boats of fishermen, to do radio and TV campaigns with the forecast of people that can be hit by lighting, to use spots with the forecast in the beach and in the risky places among others.
Acknowledgment
None.
Conflicts of Interest
No conflict of interest.
References
- Rigoberto Fimia Duarte, Ricardo Osés Rodríguez, José Iannacone, AnaiCarmenate Ramírez, Lorenzo Diéguez Fernández, et al. (2017) Modeling And Prediction Up To The Year 2020 For Total Angiostrongylosis Using Regressive Objective Regression. Villa Clara, Cuba. The Biologist (Lima) 15(1): 16.
- Maria de Lourdes Sánchez Alvarez, Ricardo Osés Rodríguez, Rigoberto Fimia Duarte, Bárbara Cecília Gascón Rodriguez, José Iannacone et al. (2017) Objective Regressive Regression Beyond White Noise for Viruses Circulating in Villa Clara Province, Cuba. The Biologist (Lima) 15(1): 127.
- Ricardo Osés Rodríguez, Rigoberto Fimia Duarte, Jaime Wilfrido Aldaz Cárdenas, José Iannacone Oliver, Yanira Zaita Ferrer, et al. (2017) Mathematical Modeling of Cholera by Regressive Objective Regression and its Relationship with Climatic Variables. Caibarien. Villa Clara, Cuba. The Biologist (Lima) 15(1): 128.
- Rigoberto Fimia Duarte, Ricardo Osés Rodríguez, AnaiCarmenate Ramirez, José Iannacone, Ramón González González, et al. Modeling And Forecasting For Mollusk's With Angiostrongilosis In The Province Villa Clara, Cuba Using Objective Regressive Regression (ROR).
- Osés Rodríguez, Burgos Alemán, OsésLlanes, Otero Martin Meylin, C Fimia Duarte, et al. How Much Methodology Ror Explains The Rain Errors In Caibarién, Cuba.
- Ricardo Osés Rodríguez (2014) Mathematical Modeling (ROR) applied to the forecast of earthquakes in the global level. Electronic Veterinary Magazine 15 (No 08B).
- Ricardo Osés Rodríguez (2017) The ROR’s Methodology and it’s possibility to find information in a White Noise. International Journal of Current Research 9(03): 47378-47382.
- Osés Rodríguez, Ricardo, Domínguez Hurtado Ismabel Maria, Pedraza Martínez Félix Alfredo, Florencia Jimenez Lorenzo (2017) Modeling and Forecast of the Tri-hour Atmospheric Pressure at sea level with 11 years in advance of the Province of Villa Clara Cuba. Provincial Meteorological Center of Villa Clara.
- Osés (2015) Division by zero, of Cristosols to estimate universe longitude. Futurology and Regressive methodology finding information beyond a white noise. Lambert Academic Publishing. Omni Scriptum GmbH & Co.KG. ISBN: 978-3-659-71469-6.
- Osés R, Grau R (2011) Regressive (ROR) versus ARIMA modeling using dichotomous variables in HIV mutations. Feijóo Editorial. ISBN: 978-959-250-652-7.
- Holle RL (2022) Lightining Death by State, National Lightning Safety Council Web site.
-
Ricardo Osés Rodríguez*, Odalys Llanes Concepción and Rigoberto Fimia Duarte*. Short and Long Term Forecast for Lightning Strikes and Casualties in Miami, USA. Iris Jour of Astro & Sat Communicat. 1(2): 2023. IJASC.MS.ID.000506.
-
Natural phenomena, Lightning strikes, Noise, Death, Variables sawtooth, Inverted sawtooth, Regression errors, Autocorrelations, Regressive Objective Regression (ROR), Thunderstorms.
-

This work is licensed under a Creative Commons Attribution-NonCommercial 4.0 International License.


