 Research Article
Quality Control of Concrete in the Southern Region of Kingdom of Saudi Arabia Using Local Materials
Hamoud A Beshr, Osama K Adwan*, Mahmoud M Kuleib and Khalid A Alkuzai
Department of Civil Engineering, Al-Baha University, Kingdom of Saudi Arabia
Osama K Adwan, Department of Civil Engineering, Al-Baha University, Kingdom of Saudi Arabia.
Received Date: March 19, 2019; Published Date: April 02, 2019
Abstract
A common concern amongst civil engineers is producing a good quality concrete on-site. This paper reports results of a study carried out to examine the quality of normal strength concrete production in the southern region of Kingdom of Saudi Arabia (KSA) made from local coarse aggregate namely Basalt. As all data were analyzed and examined statistically using Chebyshev’s theorem and the Statistical Empirical Rule (SER) method presented herein. It is concluded that, the normal distribution of all test results -in terms of the quality of concrete mix- was strongly agree with Chebyshev’s theorem and ACI 318-14 section 5.6.3. In addition, these results were considerably better than the Statistical Empirical Rule (SER) method. Overall, these concrete mixes, in this investigation, with 28 days compressive strength of 35 MPa can be used confidently in concrete structure applications.
Keywords:Compressive strength; Normal strength concrete; Quality of concrete mix; Statistical analysis; Standard deviation; Normal distribution
Introduction
Quality of concrete can be defined is to ensure to make concrete fit–for the purpose of any civil engineering projects. In addition, to get the best quality of concrete mix on-site, engineers and contractors need to take onto consideration many factors when designing and ordering such mixes [1-4]. Apart from ordering concrete mixes which entirely based on parameters such as slump and strength, civil engineers can make use of their knowledge to give greater value for money. In construction industry concrete is the most demandable material which can be acquired from combination of binding material, fine and coarse aggregate, water, and may be chemical admixtures [5-6]. It is considered one of the cheapest and most readily material which can be formed easily when it is fresh. Moreover, concrete like most other building materials, have certain amount of variability both in materials and in constructional methods [6-10]. Consequently, this results in variation of compressive strength from concrete mix to another. It becomes very difficult task to assess the compressive strength of the final product. In addition, the basis of acceptance of a sample is that a reasonable control of concrete work can be provided, by ensuring that the probability of test results falling below the design strength is not more than a specified tolerance level [10]. Hence, the aim of quality control is to limit the variability as much as practicable. Also, Statistical quality control methods provide a scientific approach to the designer to understand the realistic variability of the materials so as lay down design specifications with proper tolerance to cater for un-avoidable variations. The acceptance criteria are based on statistical evaluation of all test results of samples taken at random during testing. Thus, by devising a proper sampling technique it is possible to ensure a certain quality at a specified risk [8-12]. Overall, this investigation carried out mainly to examine and evaluate the quality of normal strength concrete production in the southern region (Al-Baha) of KSA using statistical analysis techniques.
Methodology
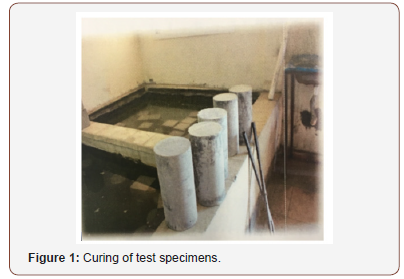
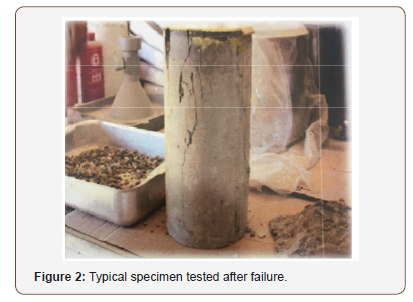
The authors have taken the opportunity of on-going construction of different main structures at Al-Baha region to follow-up the production of concrete for the purpose of investigating the material produced onsite for the implementation rather than those produced in a laboratory. This situation helped the authors to investigate quite number of concrete cylinders which were taken at different stages during the construction period. Thus, series of concrete cylinder specimens were randomly tested which in turn made the results more representative to the local industry of concrete within Al- Baha region. All concrete mixes were prepared in this study using the local materials in Al-Baha region, KSA. The target compressive strength of all concrete mixes was 35 MPa which was used as a reference for all concrete mixes. All concrete mixes were prepared using OPC, natural sand and uncrushed coarse aggregates namely Basalt with a maximum nominal size of 20 mm and specific gravity of 2.80. Overall, 280 concrete cylinders of 150 mm x 300 mm were cast and tested till failure for compressive strength. Figures 1 & 2 show some concrete cylinder specimens tested in the investigation till failure (Figures 1 & 2).
Result and Discussion
Analysis of the result
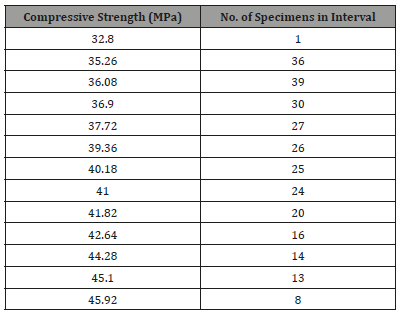
As shown in Table 1 it is clear the least compressive strength value fc′ was 32.80 MPa which is less than the characteristic compressive strength by only 2.20 MPa. Therefore, this experimental test results are strongly agree with the ACI 318-14 section 5.6.3 which states “no individual strength test (average of two cylinders) falls below fc′ by more than 3.5 MPa when fc′ is 35 MPa or less; or by more than 0.10 fc′ when fc′ is more than 35 MPa”. Moreover, the crushing compressive strength for all specimens- except for one sample- at 28 days falls within 99.64% from the characteristic compressive strength i.e. 35 MPa which is strongly considered for the structural design calculation (Table 1).
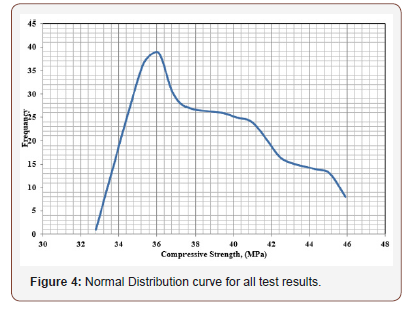
The compressive strength test cylinders from random sampling of a mix, exhibit variations, which are inherent in the various operations involved in producing and testing of concrete. If a number of cylinder test results are plotted on histogram, the results are found to follow a normal distribution curve. However, some divergence from the smooth curve can be expected, in particular if the number of results available is relatively small. Figure 3 & Figure 4 show the histogram and the normal distribution curve respectively for all experimental test results. The average number of all test results gives no indication of the extent of variation of compressive strength. However, this can be ascertained by relating the individual strength to the mean strength and determining the variation from the mean with the help of the properties of the normal distribution curve (Figures 3 & 4).
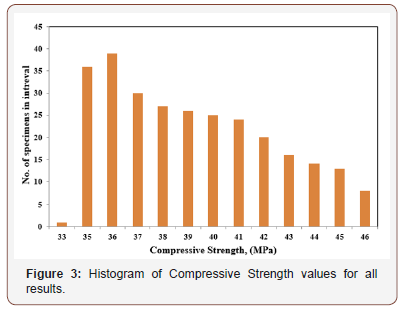
It is worth to state, that the curve is normally distributed i.e., bell shape (Figure 4). Also, the characteristic of this curve depends on the mean and the standard deviation values. For all test results the mean was 39.20 MPa and the standard deviation was 3.17 MPa respectively which gives a coefficient of variation of 8.05%. i.e., less than 10%. As a result, it should be stated, that the quality of production mixes is excellent and satisfies with the ACI 318M-14 specification. Moreover, the standard deviation value (S) can be used as an indicator for the quality of concrete mixes i.e. as the standard deviation value goes higher this indicates poor quality of concrete mixes and the visa versa is true. Overall, the quality degree of all concrete mixes was excellent. Chebyshev’s theorem states; “at least (1-1⁄K2) of the items in any data set will be within K standard deviations of the mean, where K is any value greater than 1. At least 75% of the items must be within K=2 standard deviations of the mean”. If K=2 and the mean compressive strength (fm) of all test results was 39.40 MPa and the standard deviation (S) was 3.36 MPa respectively then at least 75% of the compressive strength falls between (fm-K*S) which is 32.86 MPa, and (fm+K*S) which is 45.54 MPa respectively. Accordingly, 96.77% of the compressive strength values are between 35.26 MPa and 45.10 MPa respectively by using the two standard deviations of the mean. In addition, according to the Statistical Empirical Rule (SER), for data having a bell-shaped distribution which states “approximately 68% of the data values will be within one standard deviation of the mean”. Therefore, 74.2% of the compressive strength of test results values was between 36.04 and 42.67 MPa respectively using one standard deviation of the mean. This means that, all test results having a good bell-shaped distribution.
Discussion of hypothesis of the test results
Hypothesis can be used to determine whether the results of compressive strength are agreeing with the required goal to satisfy the characteristic strength mean which is 35 MPa or not. This can be achieved by using the one-tailed test about the characteristic strength mean for large sample case i.e. n>30; see Table 1. Thus, the null hypothesis denoted by H0, is a tentative assumption about the characteristic strength mean and the alternative hypothesis denoted by Ha is the opposite of what is stated in the null hypothesis.
The above- stated hypotheses are as follows:

Where;
X̄= 39.20 MPa (the compressive strength mean)
μ0= 35 MPa (the target compressive strength)
S = 3.17 MPa (the standard deviation)
n = Number of specimens i.e. 279
Substituting all the above stated values in equation (3) Z = 22.13.
In addition, using the level of significance α=0.05 for the test which corresponds to Z=1.645. Thus, the value 22.13 > 1.645 which reject the null hypothesis μ ≤35 MPa. Therefore, it is clear 95% confident that the test results–population-mean of compressive strength (39.20 MPa) is greater than the target compressive strength (35 MPa).
Conclusion
Based on the data obtained and analysis discussed herein, it can be concluded that, the normal distribution of all test results -in terms of the quality of concrete mix- was strongly agree with Chebyshev’s theorem and ACI 318-14 section 5.6.3. In addition, these results were considerably better than the Statistical Empirical Rule (SER) method. Thus, the statistical analysis method used provided a scientific basis of acceptance which is not only realistic but also restrictive as required by the design engineers for the concrete construction. Overall, these concrete batches, in this investigation, with 28 days compressive strength of 35 MPa can be used confidently in concrete structure purposes.
Acknowledgement
None.
Conflict of Interest
No conflict of interest.
References
- ACI Committee 318 (2014) Building Code Requirements for Structural Concrete (ACI 318-14) and Commentary (ACI 318R-14). American Concrete Institute, Farmington Hills, MI, USA, p. 519.
- ACI Committee 310 (2010) Specifications for Structural Concrete (ACI 301-10). American Concrete Institute, Farmington Hills, MI, USA, p. 77.
- Guide to Improving Specifications for Ready Mixed Concrete (2009) Publication 2PE003. National Ready Mixed Concrete Association, Silver Spring, MD, USA, p. 22.
- Pielert JH (2010) Quality Cement, Concrete, and Aggregates-The Role of the Testing Laboratories. STP 169D, ASTM International, West Conshohocken, PA, USA, pp. 51-55.
- Snell L (2003) Assessing Concrete Strength Results. Concrete International 25(12): 43-45.
- Shi-cong Kou, Chi-sun Poon (2015) Effect of the quality of parent concrete on the properties of high performance recycled aggregate concrete. Construction and Building Materials 77: 501–508.
- Beshr H, Almusallama AA, Maslehuddin M (2003) Effect of coarse aggregate quality on the mechanical properties of high strength concrete. Construction and Building Materials 17(2): 97-103.
- Kevin Kane, Todd Laker, Steve Morrical (2015) Improving the quality of concrete testing. International Concrete Abstracts Portal, USA 37(8): 33- 40.
- Maghfouri M, Shafigh P, Binti Ibrahim Z, Alimohammadi V (2017) Quality control of lightweight aggregate concrete based on initial and final water absorption tests. International Technical Postgraduate conference, IOP Conf. Series: Materials Science and Engineering 210: 6.
- Shetty MS (2008) Concrete technology theory and practice. S Chand and company limited, p. 660.
- William Navidi (2006) Statistics for Engineers and Scientists. McGraw- Hill companies, p. 231.
- Stephens LJ (1998) Beginning Statistics. Schaum’s outline, p. 380.
-
Hamoud A Beshr, Osama K Adwan, Mahmoud M Kuleib, Khalid A Alkuzai. Quality Control of Concrete in the Southern Region of Kingdom of Saudi Arabia Using Local Materials. Cur Trends Civil & Struct Eng. 2(1): 2019. CTCSE.MS.ID.000527.
-
Quality Control, Concrete, Compressive strength, Normal strength concrete, Quality of concrete mix, Statistical analysis, Standard deviation, Normal distribution, Parameters, Coarse aggregates
-

This work is licensed under a Creative Commons Attribution-NonCommercial 4.0 International License.


