 Research Article
Graphic Design and Neuroscience: The Visual Perception of Brands Graphic Signatures and its Cerebral Responses
Patrícia Ceccato* and Luiz Salomão Ribas Gomez
Federal University of Santa Catarina, Brazil
Patrícia Ceccato, Federal University of Santa Catarina, Brazil.
Received Date: April 13, 2019; Published Date: May 02, 2019
Abstract
The research presented at the Design and Graphic Expression graduation program from the Federal University of Santa Catarina answered whether the consumer’s cerebral reactive and analytical responses generated from the visual perception of brands graphic signatures can cause different valuations of them or not. The data collection involved a tablet application, that displays brand’s graphical signatures, first by a short, and then for a longer period of time each. The application’s purpose was to collect quantitative data about the fast (reactive and emotional) and slow (analytical and rational) assessments the consumer does from the visual perception of the brands graphic signatures, in order to discover if they cause any difference in the evaluations of them. It was noted at the end of the research, that although most graphic signatures presented variations between the answers given by the members of the sample in the evaluations of both exhibition times, as they were partly negative and partly positive, the final result of the difference between the average of both evaluations was a technical draw. What can be explained by a preponderance of the emotional response even after the analytical processing.
Keywords: Branding; Visual identity; Design management
Introduction
Initially, the function of brands was to name products to identify them. But this conception has evolved greatly over time, especially after the Industrial Revolution: still in the nineteenth century some brands stopped of only identifying the producer and began to symbolize other values. According to Klein [1] when goods were first produced in factories not only completely new products were introduced, but the old products - even staple foods - were emerging in new and surprising ways.” This means that the market was being flooded with uniform mass-produced products almost indistinguishable from each other. That is why they needed brands to differentiate them in terms not only of origin, but also of quality.
Competitive brand has become a necessity of the machine age - in the context of manufactured uniformity, the image-based difference had to be fabricated together with the product. Later in the late 1940s, there was the awareness that a brand was not just a mascot, slogan or image printed on the company’s product label; the whole company could have a brand identity or a “corporate conscience”, also called “brand capital”.
It is from the strengthening of the concept of brand capital that branding is established. According to Keller & Machado [2], branding means endowing products and services with brand equity, which is the set of intangible attributes that the brand can transfer from the company to the product or service. According to Serralvo (in: Keller & Machado [2]), it is represented by all the positive associations (functional or emotional) related to the brand, and it confers the degree of prestige and distinction that the offer can reach in the market. Brand equity is, thus, the equity value that a brand represents for the company that owns it. And it is - from another perspective - the value of the brand for the consumer (Pinto in: Keller & Machado [2]).
Branding can also be defined as a brand management concept that is not carried out by a specific area, being a combination of efforts in different areas, among them the main ones: marketing, advertising and design Gomez et al. [3]. Just as marketers need to manage the brand and advertisers need to sell it, it is the job of designers to represent it visually Strunck [4]. The designer needs to develop a visual identity project that explicit through shapes and colours the brand concept. If branding, or brand management (used in this study as synonyms), can be defined as the transformation in the form of identity of the set of values and essential attributes of a company, according to Mono (2006), corporate identity may include the visual manifestation of these values and the incarnation of the desired personality, as well as adopt different forms. According to the author, identity accompanies all taxonomic aspects of brands, such as the emblem, logo, icons, fonts and colours.
According to Strunck [4], to communicate the visual identity of brands, there are basically four elements: the main ones: - logo and symbol; and the secondary ones - standard color (or colors) and standard alphabet. These elements are called institutional. Their use, according to a set of standards and specifications, will build a visual identity. The combination of the logo with the symbol forms the graphic signature, and, by summarizing and transmitting the brand values, it becomes important in branding to know whether the consumer is responding to it as planned by the graphic designer.
Consumers’ brain generally respond to visual perceptions basically in two ways: the first reaction is quick and occurs in a short period of time, being called reactive or emotional; the second is a bit slower and occurs in a longer time and is called analytic or rational Rodrigues [5]. In the first, the consumer does not have time to consciously think about the graphic signature, only reacting to it; while in the second he can think analytically about it: “apparently there seem to be two mental systems that lead to the decision: one that allows more extensive forms of reflection, but which consumes more mental resources, and another more automatic, however more imprecise” [6]
Knowing that, this study aims to answer if the reactive and analytical cerebral responses of consumers generated from the visual perception of brands graphic signatures can generate different assessments of them. There so, the main objective of this research was to verify if the reactive and analytical cerebral responses generated from the visual perception of brands graphic signatures lead to different evaluations of them. To accomplish that, the specific objectives of the research were:
• Understand concepts about brands, branding, design management, graphic design, visual identity, and cerebral responses through bibliographic research carried out as theoretical foundation;
\• Develop a tablet application that collects quantitative data from the reactive and analytical responses of a significant sample of participants;
• Analyze, from the application view, the quantitative data collected, and interpret them in the light of the bibliography searched;
• To conclude if the evaluations of graphic brand signatures generated from the reactive and analytical responses generate were different or not. [7]
Development
The research summarized here, submitted as a dissertation to the Graduate Program in Design and Graphic Expression of the Federal University of Santa Catarina to obtain the master’s degree, included the following stages of development:
1. Theoretical background, which covered the themes: brands, branding, design management, graphic design, visual identity, cerebral evaluations and responses;
2. Application of the theoretical results, which included the phases of defining the sample size and planning the development of the research;
3. Development of the research itself, which included the following steps:
• Creation of the tablet application: selection of graphic signatures, definition of layout and operation, programming and installation on the tablet, and the pretest and adjustments;
• Quantitative research: use of the application for data collection with a sample of 400 people, considering, as defined: the chosen locals and the dynamics of the procedure, questioning the participants, storing and tabulating the data;
• Analysis of the data collected, which included: preliminary analysis, student “T” test, correlation index, proportion analysis, and interpretation of results.
All the methodological steps developed throughout the research were extensively described throughout the dissertation. Here we just summarized the results obtained with the work, which showed graphical signatures of brands, first for a short period of time, to capture the reactive or automatic cerebral response, and later, for a longer period of time, to capture the participants’ analytical or rational response. These should push the “Like” or “Dislike” button of the application after viewing each graphical signature in both display times.
Time 01 was defined based on the bibliography research on neuroscience, mainly based on the work of Daniel Goleman [8], who verified that the amygdala of a mouse is able to react to the visual perception in only 12 thousandths of a second, estimating that in humans this time would be the same. In addition, the author informs that the analytical, rational response, takes at least twice as long to be produced. After testing, Time 02 was set to 02 seconds.
This is because, according to Mozota [9], the consumer’s response to an image is determined by two distinct styles of information processing: the cognitive and the preferential. That is, the images imply a cognitive treatment of them (a thought process) and/or an emotional treatment of the information (a process of feeling). Therefore, the processing of information either is logical, rational and sequential, or is holistic and synthetic (idem).
Daniel Kahneman [10], receiver of the 2002 Nobel Prize in Economics for his pioneering work with Amos Tversky on decisionmaking processes, wrote that the mind operates in two systems:
• System 1 operates automatically and quickly, with little or no effort and no perception of voluntary control.
• System 2 allocates attention to laborious mental activities that require it, including complex calculations. System 2 operations are often associated with the subjective experience of activity, choice, and concentration [10].
In this sense, Rodrigues [5] explains that “when we make decisions, we can do it through a long process of deliberation on several options, considering the pros and cons before choosing the most logical solution”. In that case, decision making seems to be a rational decision, an intentional and language-based process. However, many other times, decision-making may be a different, very intuitive phenomenon that involves simply choosing the option that we “feel” is the right one. In the latter case, “the decision seems to be based on something quite different from the reflection, more visceral, more emotional, that arises spontaneously in the form of preference” (idem). “In addition to being anatomically distinct mental systems, the different processing speed is the characteristic that most distinguishes them” [11].
These two fundamentally different ways of knowing interact to build our mental life. One, the rational mind, is the way of understanding that we typically have consciousness: more prominent in attention, thoughtful, able to ponder and reflect. But next to this there is another system of knowledge: impulsive and powerful, although sometimes illogical - the emotional mind. [...] These two minds, emotional and rational, often work in perfect harmony, combining their two different modes of knowing to guide us through the world. Normally there is a balance between the rational and emotional minds in which emotion feeds and at the same time informs the operations of the rational mind, and this refines and sometimes vetoes the contributions of emotion. However, the emotional and rational minds are semi-independent faculties, reflecting each of them, the functioning of distinct but interconnected circuits within the brain [8].
In human brains, this emotional mind is related to the amygdala (from the Greek word for ‘almond’): it is a group of interconnected almond-shaped structures perched above the brainstem near the lower border of the limbic ring, as illustrated by Figure 01. There are two amygdala, one on each side of the head [8]. Joseph LeDoux, a neuroscientist at the New York University’s Center for Neuro Science, explains through his research “how the amygdala can take control of what we do while the thinking brain, the neocortex, is still trying to come to a decision” (Figure 1).
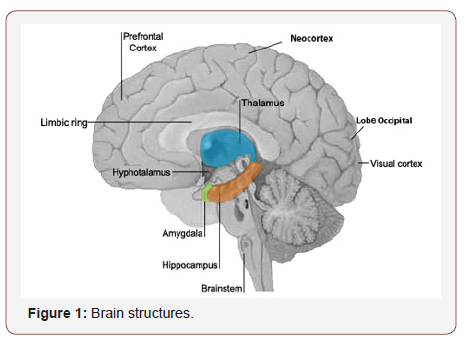
LeDoux’s investigations have shown that sensory systems from the eye and ear reach the brain by first passing through the thalamus and then- through a single synapse - by the amygdala; a second signal emitted by the thalamus is routed to the neocortex, the thinking brain. This branching allows the amygdala to begin responding before the neocortex, which analyzes the information, passing it through various levels of brain circuits, first fully understanding it and then initiating its response [8].
A visual system follows first from the retina to the thalamus, where it is translated into the brain´s language. Most of the message then passes into the visual cortex, where it is analyzed and evaluated in terms of meaning and appropriate response; if this response is emotional, it follows a signal to the amygdala, which activates the emotional centers. But a small part of the signal goes directly from the thalamus to the amygdala, in a faster transmission, allowing a faster response (although less precise). In this way, the amygdala can trigger an emotional response before the cortical centers have had time to fully understand what is happening [8].
Therefore, the amygdala can trigger an emotional response via this emergency path, while at the same time initiating a parallel circuit between it and the neocortex. The amygdala can bring us into action while the slightly slower - but much better informed - neocortex completes its most refined response plan [8]. This “direct path” has a huge advantage in terms of brain time, which is counted in milliseconds. A rat’s amygdala can begin to respond to a perception in only twelve milliseconds. The thalamus-neocortexamygdala path takes approximately twice as much. According to [8], equivalent measurements have not yet been made in respect to the human brain, but it is thought that the relationship will probably be the same.
According to the author, the value for the survival of this shortcut must have been enormous, allowing a quick response option that saves a few precious milliseconds of time in reaction to a danger [8]. “The amygdala makes us take action [...] moments prior to the neocortex have time to fully record what is happening. The emergency pathway from the eye or ear to the thalamus and amygdala is crucial: it saves time in an emergency”. And it offers an extremely quick way of connecting emotions, [...] resulting in feeling before thinking. No wonder we understand so little of our more violent emotions: [...] the amygdala can react in a delirium of fury or fear before the cortex knows what is passing - because these emotions are triggered independently, and before, of thought “(p. 44-45). This demonstrates that visual stimuli are capable of activating a large number of regions of the brain without entering in conscious perception [12].
However, “while the amygdala works by triggering an anxious and impulsive reaction, [...] the neocortical area of the brain gives a more analytical and appropriate response to our emotional impulses” [8]. The neocortical response is slower than the ‘hijack’ mechanism [...] because it involves more circuits. It can also be more judicious and thoughtful, since here thought precedes feeling.
Therefore, we may prefer/choose a brand graphic signature, that is, decide, in an unconscious (not rational) way. All these studies suggest the existence of an automatic and preconscious emotional/affective process [5]. As these preconscious emotional agitations accumulate, they become strong enough to rise to the level of consciousness “by marking their registration in the frontal cortex” [8]. Knowing that, the objective of the research was to discover if the automatic (fast and emotional) and slow (analytical and rational) responses, generated from the visual perception of the brands graphic signatures, were capable of yield different evaluations of them.
Taking into account the bibliographical data collected along the theoretical basis, the development of the research counted with the creation of a research tool: a tablet application. This was developed considering that the human brain possesses these two mental systems that lead to the negative or positive evaluation of visual perceptions. Knowing that, first, the graphical signatures were presented, through the application, in disorder, for a short period of time, seeking a reactive action, which, according to [8], occurs in milliseconds. Subsequently, they were shown again for a longer time, also in disorder, seeking a slow and analytical action, which takes “at least twice” the automatic reaction. The participant evaluating the graphic signatures had to press the “like” or “dislike” button of the application within the defined short and long times for each of the graphic signatures that he viewed on the tablet screen.
After collecting the quantitative data, through the display of the tablet application that exhibited for a short, and subsequently a long period of time, the brands graphic signatures for evaluation for a sample of participants, they have been described and was made their interpretation in the light of the bibliography collected on neuroscience and brain functioning, as well as on brands, branding, graphic design and graphic signature, in order to identify possible differences in the evaluations of brands graphic signatures caused by the fast and slow responses of consumers. For the collection of quantitative data, as our population had 23,381 elements, which corresponded to the number of undergraduate students of the Trindade campus of the Federal University of Santa Catarina, we applied the second formula of the below listed, used in research with a population higher than 10,000 elements. Thus, the unknowns of the formula were replaced by the following values:
n = sample size = (the value we were looking for)
S = confidence level chosen, expressed as standard deviations = 95%, in standard deviations = 1.96 [13]
p = percentage with which the phenomenon is verified - percentage of the elements of the sample favorable to the attribute searched = 50
q = complementary percentage, ie (100 - p) - percentage of unfavorable sample elements = 50
e = maximum permissible error = 5% (Figure 2)
• Finite population (less than 10,000elements)

• Finite population (more than 10,000elements)

Sample calculation. Source: GIESEN, Tarcísio A. Lição Matemática Nº 13: Como Calcular o Tamanho da Amostra em uma Pesquisa. Available in: http://kantega.wordpress. com/2011/10/26/%C2%AC-como-determinar-o-tamanho-daamostra- em-uma-pesquisa/ - accessed in 11/11/2012
After replacing the unknowns with the values listed above, the following result obtained for n was = 384.16. This value corresponds to the minimum number of members required in the sample to obtain a result at a confidence level of 95.5%, used in the research. This means that, in obtaining a result from the four hundred participates (defined number) sample survey, we can say with a 95.5% ‘security’ (probability) that the real population average falls in the interval (confidence interval) that is between the average of the sample calculated plus (or less) the sampling error of 5%. For the selection of the 20 graphic signatures to be displayed by the application, all the brand rankings published by Interbrand between 2010 and 2012 were analyzed. Most of them, being international or from European, North American or Asian countries, contained many brands known in Brazil, which certainly have graphic signatures that would be easily recognized by the research population. The ranking that the company had published that presented brands with lower chances of being recognized by the participants of the survey was the ranking of “Best Russian Brands 2010”, published on the Interbrand website on 12/12/2010 [7].
After each participant responds to the application by pressing the “Like” or “Dislike” buttons after viewing each of the graphical signatures by 12 thousandths and then by 02 seconds, the data was automatically stored in the database, a spreadsheet created in Microsoft Office Excel 2007. At the end of the quantitative research with the sample, we had the following results regarding the evaluations: (Table 1)
Table 1: Final Database. Source: authors.
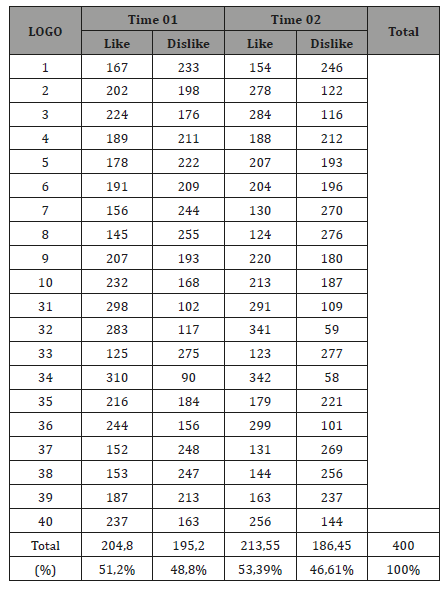
In this way, the data collected were automatically tabulated, and the answers given by each of the 400 sample members were added. The “Like” number in the Time 01 and Time 02 columns corresponds to the number of participants who answered “yes” in the dialog boxes that appeared in the application just after the display of each graphical signature (in the table called “logos” and numbered from 1 to 10 and 31 to 40), and the “Dislike” number corresponds to the number of participants who answered “no”. The “Total” corresponds to the average of positive (“Like”) and negative (“Dislike”) responses given to all graphic signatures. For the calculation of this value, all the “Like” numbers of Time 01 were added and divided by the number of graphical signatures (twenty). The same procedure was done in the Time 02 column. Likewise the average was calculated for “Not Like”.
The calculation of these values in percentage, appearing in line 24 of the spreadsheet, was done by dividing the values of line 23, “Total”, by 400, which is the number of members of the sample, and multiplying that result by 100, adding the percentage sign at the end. All calculations were done automatically by Microsoft Office Excel 2007 software.
After a preliminary analysis of the data, Student’s “T” test was applied, the most used method to evaluate the differences between the averages of two groups. The test can be used for the same group of people in two different situations, which is the case of the research performed. The T-Test, in this case, is called the T-Test for Paired Samples, that is, in pairs. Malhotra [14] explains that in many researches, observations for two groups are not drawn from independent samples. On the contrary, the observations relate to paired samples, in the sense that the two sets of observations refer to the same interviewees. As the author explains, this is how a sample of respondents can evaluate two competing brands, indicate the relative importance of two attributes of a product or evaluate a particular brand at different times (p. 452). This last one is the case of the present research, in which the participants evaluated in two different moments the brands graphic signatures.
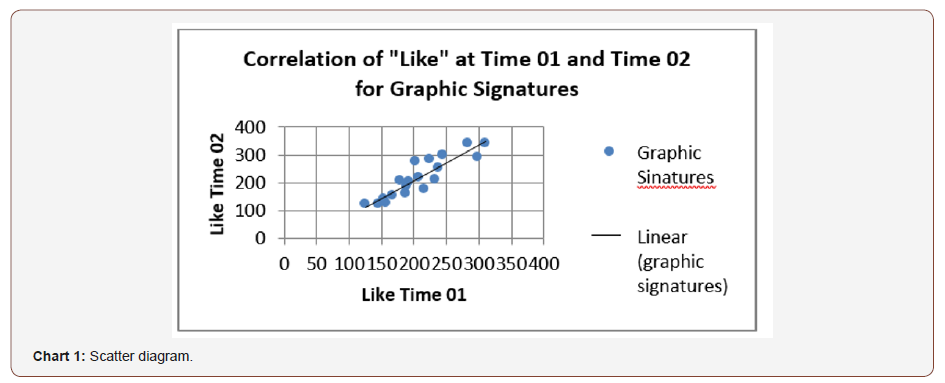
For a more detailed analysis of the data, a scatter plot was also generated [Chart 01], to explain the correlation between the evaluations made in Time 01 and Time 02 for each graphical signature. “We say that two variables are positively correlated when they walk in the same direction, that is, elements with small values in X tend to have small values in Y” [13]. In the case of this research, X is representing the set of “Like” responses given by the sample members in Time 01, and Y is representing the number of “Like” responses given in Time 02.
As the value found in this research was +0.911464, very close to +1, we can affirm that the correlation index between the two variables is high. High values for “Like” responses at Time 01 correspond to values also high in the evaluations made at Time 02. This means that graphical signatures that generated very positive evaluations at Time 01 of visualization (high number of responses “Like”) also generated evaluations very positive in the time of visualization 02 (high number of answers “Like” again). Chart 01 below illustrates the linear correlation between the two variables: (Chart 1)
In order to elucidate the results obtained in the previous analyses, mainly from the calculation of the correlation index and the analysis of the dispersion diagram, it was necessary to calculate statistically if the difference between the proportions of the evaluation made in Time 01 and Time 02 is significant. To perform the calculations, the software Pestatis - Statistical software, developed by Professor Pedro Ernesto Andreazza, from the Catholic University of Pelotas (UCPEL) was used.
For this purpose, the significance level of 0.05 was selected, which corresponds to a confidence level of 95.5%, adopted in the social sciences. Likewise, the type of calculation with two samples, corresponding to the evaluation in Time 01 and the evaluation in Time 02, was selected. The type of curve requested was two-tailed to determine the difference between proportions. In the twotailed test the alternative hypothesis to the null hypothesis is not expressed in a directional way.
According to Malhorta, the null hypothesis is “an assertion in which no difference or effect is expected”, and the alternative hypothesis is “an assertion in which some difference or effect is expected. Acceptance of the alternative hypothesis leads to the modification of opinions or attitudes. In this research, the null hypothesis corresponds to say that the difference between the evaluations made in Time 01 and Time 02 are not significant. The alternative hypothesis is that the difference between the two ratios is rather significant.
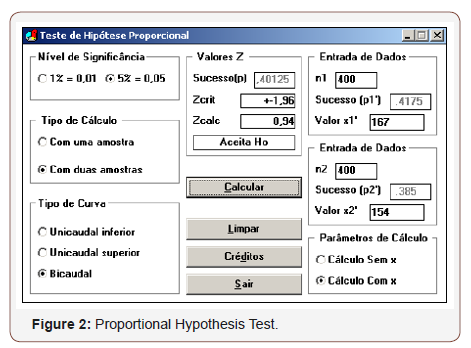
In the data entry in the Pestatis software the sample size of four hundred members was informed, and the values of the number of responses “Like” in the evaluation made in Time 01 as X1 and, and the number of responses “Like” in the evaluation 02 as X2, for each graphic signature. The software automatically calculated the values of ɀ for each of them. A screen (Figure 2) demonstrates how this calculation was performed in the statistical model “Proportional Hypothesis Test” of Pestatis software: (Figure 2)
The value of ɀ calculated is automatically compared to the critical value, which corresponds to the level of significance of the search, in this case 95.5%, represented by standard deviations: 1.96. Thus, the software verifies if the value of ɀ calculated for each graphic signature is within the critical range (+ or - 1.96). If the value of ɀ calculated is within the range of ɀ critical, it is said to be within the acceptance area, thus accepting the null hypothesis (H0). If it is outside the area if acceptance (outside the critical range), the null hypothesis (H0) is rejected.
Table 2: Final Database. Source: authors.
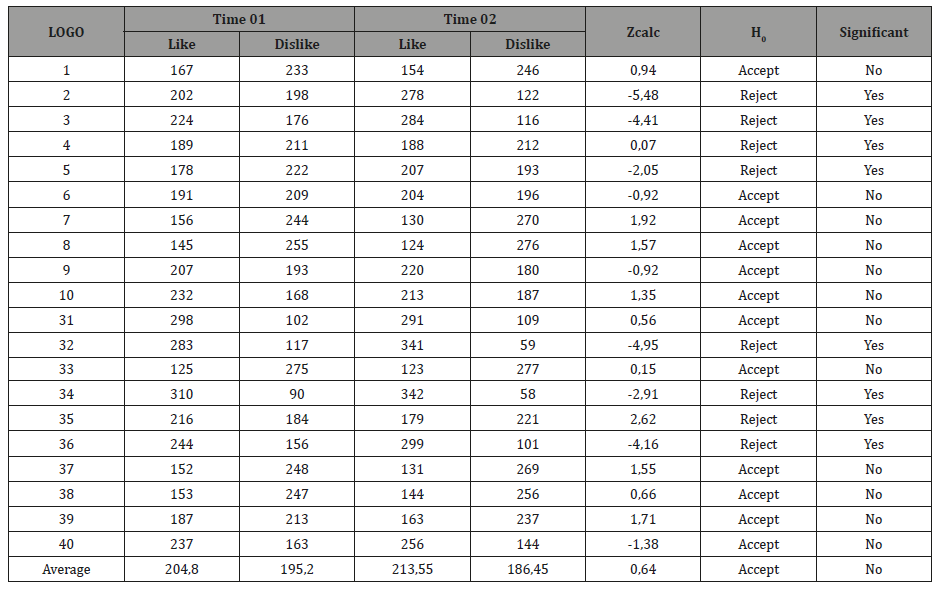
The calculation was done by inserting the values of “Like” responses from the evaluation made in Time 01 and the values of “Like” responses of the evaluation made in the Display Time 02 of each graphic signature, separately. The values calculated for each one of them are recorded in Table 02. The column next to the one corresponding to the calculated ɀ informs if the Null Hypothesis (H0) is therefore rejected or accepted. In addition, the following column further informs if, from these values, the difference between the two evaluations is or is not significant for one of the graphical signatures. In the last line it is indicated if the difference between the average “Like” responses of the 01 and 02 evaluations is also significant, that is, if the Null Hypothesis is rejected or not, if there is no significant difference between the evaluations made at times 01 and display 02 (Table 2).
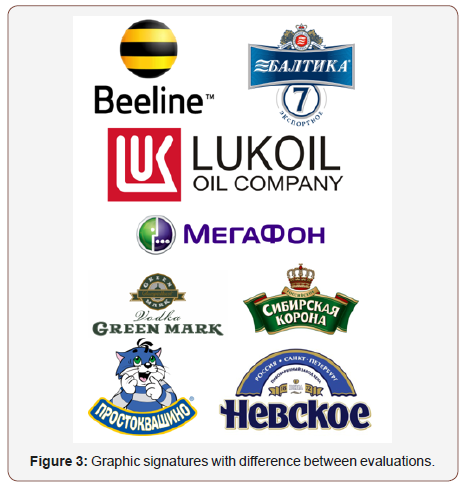
From the data presented in Table 02, it can be seen that the graphic signatures of the brands 02- Beeline, 03- Baltika, 04- Lukoil, 05- Megafon, 32- Green Mark, 34- Sibirskaya Corona, 35- Prostokvashino and 36- Nevskoe, presented significant difference between the evaluations made in Time 01 and Time 02, totaling eight graphical signatures with difference between the two evaluations generated by the reactive and analytical responses of the participants. Among them, six had a positive variation between the evaluations made, increasing the number of responses “Like” in the evaluation of Time 02. Only two of them had a negative variation between the two evaluations, having increased the number of “Dislike” at time 02, which are the graphic signatures of Lukoil and Prostokvashino. Regardless of whether the variation was positive or negative, here is the set of the graphic signatures that had a significant difference between the two evaluations see (Figure 03):
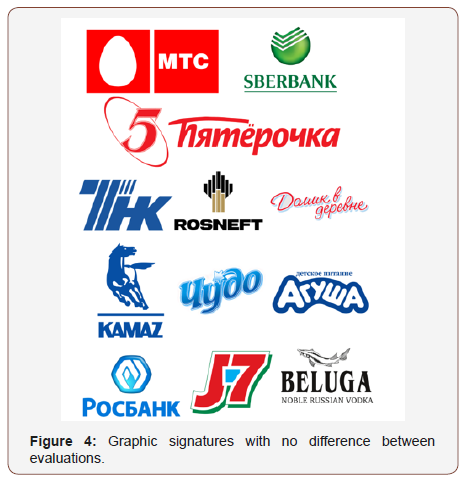
For the other graphic signatures of the brands 01- MTS, 06- Sberbank, 07- Pyaterochka, 08- TNK, 09- Rosneft, 10- Domik V Derevne, 31- Kamaz, 33- Chudo, 37- Agucha, 38- Rosbank, 39- J7 and 40- Beluga, the difference between the two evaluations does not allow us to reject the Null Hypothesis, which does not allow us to state that there is a difference between the number of responses “Like” in the evaluations made in Time 01 and Time 02. We only compare in this test the difference between the “Like” response because the “Dislike” responses varied in the same intensity, only in the opposite direction. While the number of one has increased, the number of one has decreased. The illustrations of the graphical signatures that did not have a significant difference between the two evaluations are shown in Figure 04.
Result
“The stimuli result in emotional and rational responses in the minds of individuals” [15]. From the analysis of the positive and negative variation of the assessments made in Time 01 and 02 to the graphic signatures of the brands 02- Beeline, 03- Baltika, 04- Lukoil, 05- Megafon, 32- Green Mark, 34- Sibirskaya Corona, Prostokvashino and Nevskoe, selected in the research, it is possible to perceive the existence of these “two routes of cognition (or knowledge) - one affective and the other rational”. The work of Daniel Kahnemam distinguishes ‘effortless intuition’ from ‘deliberative rationality’. The difference between them can be observed in the present research, in which, for eight of the 20 graphical signatures, these two neuro cerebral responses generated different evaluations by the research participants.
However, for twelve graphical signatures, there was no variation between the reactive and analytical evaluations of them. Why does this difference occur? [15] Chaudhuri explains that emotion can be a cause as well as an effect of information processing [...] and intuition can often promote and improve effective decision-making influencing, in this way, the analytical, deliberative and rational decision. That is why, often, both responses, reactive and analytical, are similar.
From the commentaries of the authors [15,8,12] cited above, the analytic response is influenced by the reactive/emotional, as well as influence it in return. Although they are processed by distinct circuits of the brain, they interact to produce decision making. Thus, when the reactive response prevails in decision making, there is an impulsive decision-making, based more on emotion than on deliberative judgment after rational analysis. In this case, the reactive response prevails even after the analytical evaluation. Kahneman [10] explains that “System 1 [reactive] exerts a greater influence on behaviour when System 2 is occupied.” This is what is observed in relation to the graphic signatures of the brands 1 - MTS, 4 - Lukoil, 6 - Sberbank, 9 - Rosneft, 10 - Domik V Derevne, 31 - Kamaz, 33 - Chudo, 38 - Rosbank, 40 - Beluga.
However, when the analytical response prevails in decision making, although it is influenced by the reactive response that acts in the consumer’s subconscious, it is because the deliberative evaluation considers other aspects more relevant to the decision making, thus producing an evaluation sometimes different from the reactive. This is what is observed in relation to the graphic signatures of the brands 02- Beeline, 03- Baltika, 04- Lukoil, 05- Megafon, 32- Green Mark, 34- Sibirskaya Corona, 35- Prostokvashino and 36- Nevskoe.
Chaudhuri [15] elucidates that the image of the graphic signature itself can lead to the prevalence of one of the two responses, reactive or analytical, after analytical evaluation by the consumer, as well as the image of the goods they represent: hedonic goods provide enjoyment, pleasure, fun for the consumer, while utilitarian goods provide functionality and practicality. But, as Okada points out, “hedonic and utilitarian goods are not opposite ends of a line, because it is quite possible for a good to be both hedonic and utilitarian” (p. 42).
Any classification of goods as hedonic or utilitarian must rely on the perception of consumers if the consumption of that good is hedonic or utilitarian. Thus, hedonic and utilitarian goods, in the model, refer to the perception of the consumers of the goods and services, consequently, the units of analysis for all the constructions of the model are individual consumers. The model tries to understand the place of perceptions in product categorization, brand beliefs, brand appraisal, and brand attitudes in the brand intentions of individual consumers [15].
The emotional response is based on “non-tangible brand beliefs (‘this brand is fun’), which leads to emotional evaluation of the brand (‘this brand is different from other brands’) and affective attitudes (‘I love this brand’ )” [15]. A similar route followed the emotional evaluation of brand signatures in which, even after the analytical response, the reactive/emotional response prevailed, culminating with two similar evaluations by the participants in Time 01 and Time 02.
However, rational or tangible beliefs (‘this brand has fluorine’) lead to a rational brand evaluation (‘benefits of this brand are worth the price’) and utilitarian attitudes (‘this is a good brand’) [15] (Chaudhuri 2006; p. 42). In this type of processing, the analytical response prevails, even after the reactive response. Often because the emotion it caused was not so strong to influence the deliberative response. That is what is observed in relation to the graphic signatures of the brands 02- Beeline, 03- Baltika, 04- Lukoil, 05- Megafon, 32- Green Mark, 34- Sibirskaya Corona, 35- Prostokvashino and 36- Nevskoe.
The conceptualization of Chaudhuri [15] (2006, p. 42) of the two types of evaluation, emotional and rational, and their relations with utilitarian and affective attitudes, is based on specific theories on the structuring of evaluations by Mandler [16] and others. The author quotes Mandler when saying that we form assessments based on the interaction between external events (graphic brand signatures, in our case) and our existing mental schemas. “A scheme is a cognitive structure or abstract representation of the reality that individuals use to guide thinking and behaviour and works to provide an understanding of the environment” (p. 44). In this research, individuals evaluated brands graphic signatures based on the reactive and analytical responses generated from their visual perception, based on parameters such as the compatibility with graphical signatures with already stored mental schemas. The level of congruence between external evidence (the graphical signatures) and their existing schemas (for example, certain shapes and colours associated with brand signatures of particular market segments) determines the assessments. “Thus, any assessment is determined by the level of congruence or incongruity of the stimulus encountered with our existing schemes” [15].
Thus, I define emotional assessment as the positive or negative evaluation of a brand based on the level of incongruity between the brand and other brands. As discussed, emotional evaluation results in some level of arousal based on the level of incongruity and the individual’s ability to assimilate or accommodate this incongruity. When the incongruity is small, a process of assimilation results in a positive evaluation and a lower level of arousal and affection. When the incongruity is greater, a successful accommodation process can lead to a positive or negative evaluation and higher levels of arousal and affective attitude. I do not model these processes of assimilation and accommodation here because Mandler clearly states that these processes are largely unconscious [15].
In the case of these twelve graphic signatures, whose evaluations 01 and 02, corresponding to the reactive/emotional and analytical/ rational answers of the consumers, remained the same, it is possible to affirm that the emotional response of each participant to each of them was so strong in terms of excitement and affective attitude, possibly caused by an incongruence with their stored mental schemas [16], that ended up influencing and determining decision-making even after analytical and rational deliberation, thus causing no significant variation between the two evaluations. The opposite is observed in concern to the other eight graphic signatures researched, in which the reactive response, possibly due to a congruence of their visual perception with the stored mental schemas, was weaker in terms of arousal and affective attitude, not being strong enough to influence the analytical response and determine decision-making. Thus, it is observed that the opinion given after analytical deliberation was different from the evaluation made based only on the reactive emotional response, possibly because utilitarian factors were predominant in relation to the hedonic ones in the rational evaluation [15].
Conclusive Aspects
After the preliminary data analysis and the Student’s “T” Test, a test was performed to verify if the difference between the evaluations made in Time 01 and Time 02 on each of the graphical signatures was or was not significant. For this, the software Pestatis was used, more specifically the statistical model media “Proportional Hypothesis Test”, capable of calculating whether the difference between two proportions is significant or not. With a significance level of 95%, it was concluded that there were no significant differences between the evaluations made in Time 01 and Time 02 of visualization of twelve of the graphic signatures selected in this research, since in this case it was not possible to reject the null hypothesis. For the other eight signatures, it is possible to state the opposite, since the difference between the number of responses “Like” of the two evaluations was significant, as indicated by the critical value ɀ calculated for each of them. It is not the purpose of this research to infer about the reasons for some graphic signatures having presented difference between the evaluations and others not. That is why we do not deepen the discussion about this topic. More important was to conclude whether, overall, considering the assessments made of all the graphical signatures, there was or was not a difference between the average of their assessments, generated from the reactive and emotional responses of the consumers.
For this, it was necessary to find the difference between the average “Like” responses given in Time 01 for all the graphical signatures, and their average in Time 02, and to verify if the difference between them would be significant or not to represent the opinion of the totality of the population surveyed. In order to do so, it was found that the average “Like” responses given to all graphic signatures increased from 204.8 to 213.55. From the calculation of the difference between the proportion of two samples carried out in the Pestatis software, it was concluded, with 95% confidence, that there were no significant differences between the evaluations made from the reactive and analytical neurocerebral responses of the consumers.
This result confirms the hypothesis launched from the Student’s “T” Test. Thus, since the null hypothesis cannot be ruled out, it is stated that the reactive and analytical neurocerebral responses generated from the visual perception of brands graphic signatures did not generate different evaluations of them. This outcome may indicate that, in the developed research, the reactive/emotional/ automatic responses were, on average, so strong in terms of arousal and affective attitude that, for the average of the total graphic signatures, also affected the analytic/rational/deliberative responses given by the participants, culminating in two significantly similar evaluations. According to Goleman [8] and [5], the emotions that are awakened by visual perception and act in our subconscious exert a hidden force in our assessments, acting as a state of mind that sometimes is so strong that it influences our actions and decisions. Most of the time, emotions that bubble below the threshold of consciousness determine our preference or opinion long before the neocortex ponder and decide rationally. However, in some of these occasions, even the neocortex making different decisions of the emotional response, the emotional reaction prevails in the evaluation made even after rational deliberation. It is the emotion deciding instead of reason [5,8,15].
Acknowledgemnet
None.
Conflict of Interest
No conflict of interest.
References
- Klein N (2006) No Logo: Tyranny the Brands In to Planet Sold. Rio de Janeiro: Record.
- Keller Kl, Machado M (2006) Management Strategic of Brands. São Paulo: Pearson Prentice Hall Brazil.
- Gomez Ls, R Olhats, M Floriano, J Vieira Mlh (2011) The DNA of the Mark of Fashion: The Process. Port: Other Economic.
- Strunck GLTL (2007) Como Create Identities Visual for Brands of Success: um Guide About o Marketing of Brands and as Represent Graphically Your Values. Rio de Janeiro: Rio Books.
- Rodrigues F (2011) Influence of Neuromarketing Us Processes of Taken of Decision. Viseu: PsicoSoma, p. 84.
- Ledoux J (2000) Emotion Circuits in the Brain. In: Annual Review of Neuroscience 23.
- Ceccato P, Gomez lsr (2013) O Design Graphic and the Neuroscience: A Perception Visual of Signatures Graphic of March and Your Answers neurocerebrais. Florianopolis: UFSC.
- Goleman D (2012) Intelligence Emotional: A Theory Revolutionary That defines what it is to be Smart. Rio de Janeiro: Objective.
- Mozota B, Costa Fc, Klopsch C (2011). Management do Design: Using the design for Build Value of March and Innovation Corporate. Porto Alegre: Bookman.
- Kahneman D (2012) Fast and Slowly: Two Forms of Think. Rio de Janeiro: Objective.
- Lieberman MD (2007) The X- and C-systems: The neural basis of automatic and controlled social cognition. In: E Harmon-Jones & P Winkielman (Eds.), Social Neuroscience: Integrating biological and psychological explanations for social behavior. New York: Guilford Press, USA.
- Aamodt S, Wang S (2009) Brain: Manual of the User. Lisbon: Scroll.
- Barbetta Pa (2010) Statistics Applied to Sciences Social. Florianópolis: UFSC.
- Malhotra NK (2011) Research Marketing: A Guidance Applied. 6ed. Porto Alegre: Bookman.
- Chaudhuri A (2006) Emotion and Reason in Consumer Behavior. Burlington: Butterworth-Heinemann.
- Mandler G (1882) The structure of value: Accounting for taste. In: Margaret Sydnor Clark and Susan T Fiske (Eds.), Cognition and affect. Hillsdale: Lawrence Erlbaum.
- Asset Y I (2010) O Meaning of the Brand: how the Brands Win Life Na Mind of Consumers. Rio de Janeiro: Best Buniness.
- Monkey (2006) Identity Corporate: From Brief to Solution End. Barcelona: Gustavo Gilli.
-
Patrícia Ceccato, Luiz Salomão Ribas Gomez. Graphic Design and Neuroscience: The Visual Perception of Brands Graphic Signatures and its Cerebral Responses. Arch Neurol & Neurosci. 3(3): 2019. ANN.MS.ID.000563.
-
Branding; Visual identity; Design management, Graphic Design, Neuroscience, Cerebral Responses, Brain.
-

This work is licensed under a Creative Commons Attribution-NonCommercial 4.0 International License.


