 Research Article
Survival Rate Estimation of Advanced Carcinoma Prostate Patients by using Bone Scan Quantitative Parameters
Nayab Mustansar, Assistant Professor, Consultant Nuclear Physician, Women Medical College, Abbottabad, Pakistan.
Received Date: July 11 , 2019; Published Date: July 16, 2019
Abstract
There are several methods to-date which can be used to analyze the extent of such lesions. For example, quantitation of the bone scan using quantitation methods i.e. % BSI (Bone scan index), % PAB (Positive area on bone scans), EOD (extent of disease) and BLS (Bone lesion scoring). These methods are used for prognostication of survival and response to treatment on serial scans. 40 patients with histopathologically proved prostate cancer were chosen to implement all the four quantitative parameters on individual baseline bone scans and serial follow up scan were performed to calculate 2-years survival rate. After which, survival rate was calculated. The dataset was again analyzed using the four bone scan quantitative parameters and the cut off were calculated as % BSI: 1, % PAB: 0.5, EOD: grade 0 & 1, grade2, 3 & 4 and BLS: 5. It was found out that the %PAB and % BSI methods are good prognostic indicator in baseline scans. Moreover, the prostate cancer patients with the cut off % BSI >1, %PAB > 0.5, BLS >5 and EOD with grade 2, 3 & 4 showed increase risk of disease progression and less survival.
Keywords: Prostate cancer; Tumours; Cancer; PAB; BSI; Carcinoma
Introduction
Prostate cancer is cancer that occurs in the prostate a small walnut-shaped gland in men that produces the seminal fluid that nourishes and transports sperm. Prostate cancer is one of the most common types of cancer in men. Usually prostate cancer grows slowly and is initially confined to the prostate gland, where it may not cause serious harm. However, while some types of prostate cancer grow slowly and may need minimal or even no treatment, other types are aggressive and can spread quickly. Prostate cancer that’s detected early when it’s still confined to the prostate gland has a better chance of successful treatment.
Aims and Objectives
To determine the survival rate in advanced prostate cancer using different quantitative parameters.
Materials and Methods
The study was conducted at N.O.R.I (Nuclear Medicine Oncology and Radiotherapy Institute Islamabad)
Study design: Cross Sectional Study
Place of study:Nuclear Medicine department of NORI
Duration: Six months.
Sampling Method: Nonprobability purposive sampling method.
Sample size: 40 Patients with histopathologically proved Prostate Cancer. (Baseline and Follow up scans with hormonal treatment were selected.
Sample Selection
Inclusion criterion
1. Histological confirmed prostate cancer patients referred for evaluation of osseous metastasis within three months of diagnosis.
2. Written informed consent.
Exclusion criterion
1. < 18 years.
2. Patients in which PSA levels was not available
3. Patients having other co-morbids.
Every patient included in our study underwent Bone Scintigraphy and later the quantitative parameters were applied on the bone scan. We have applied different methods of quantitative parameters for the assessment of tumor burden on the bone scan baseline and follow up bones can. These methods include:
1. % BSI (Bone Scan Index).
2. Extent of Disease (EOD)
3. %PAB (Positive areas on bone scan).
4. Bone Lesion Scoring (BLS) Method.
%BSI (Bone Scan Index) method
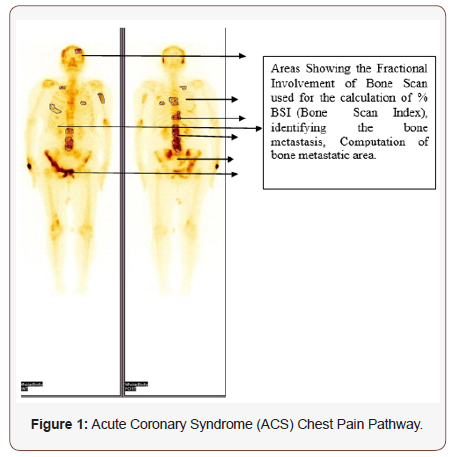
%BSI is one of the most frequently used quantitation methods and is also available as commercial software. Based on ICRP Publication No.23, 158 bones were listed by name and the weight of each bone was expressed as a fraction of the weight of the entire skeleton. The fractional involvement of each bone was calculated subjectively on each bone scan. BSI was calculated by summing the product of the weight and the fractional involvement. So, it has been carried out manually by designing a BSI calculator in Microsoft excel such that the weight in grams of each bone is multiplied with the percentage of the bone involvement and then is divided by the total percentage of the respective bone i-e 100 % (Figure 1).
Formula used

% of total fresh skeletal mass in grams used for calculation is shown in the table below [ICRP-23] [1] (Table1).
Table 1: Percentage of Total Fresh Skeletal Mass in Grams.
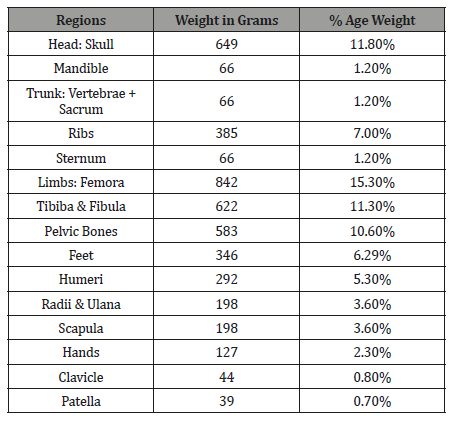
This method of quantitation was applied to 141 patient’s baseline scan and also to 40 patients with both the baseline and follow up scans. Value of 1 was used as cut off, below that patients were considered low risk for disease progression and above that were considered as high risk for disease progression. This value was chosen based on the previously published study in which the cut off was used for the purpose of calculation.
Extent of disease (EOD) -grading
This method of quantitation is based on the subjective assessment of osseous metastasis on the bone scan the number of osseous metastasis is labelled as a specific grade, grade 0 means no evidence of bone metastasis, and grade 1 to 4 represents increasing osseous metastasis respectively as mentioned in table 2 (Table 2).
Table 2: Extent of Disease (Grading).
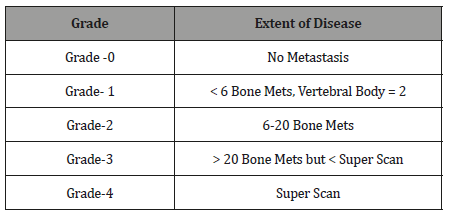
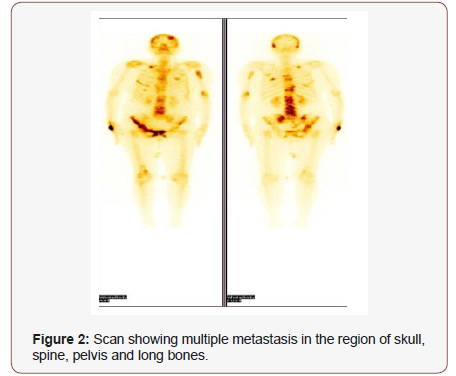
The method of calculating ‘Extent of Disease’ is subjective assessment of bone metastasis on skeletal scintigraphy. The number of lesions determines the extent of disease as explained in the table above. The arbitrary cut off for the purpose of quantitation and analysis of survival was taken as grade 0&1 and grade 2, 3&4. The patients with grade 0&1 were considered low risk whereas those with grade 2, 3 & 4 were considered high risk. Soloway et. al used the same method for the bone metastasis quantitation and survival analysis. Extent of Disease- Grading was calculated as: (Figure 2)
%PAB (Positive area on bone scan)
Positive area on bone scan is a quantitative method in which the osseous metastasis is considered as the positive area. The same method was applied to the dataset of patients using the formula given below:

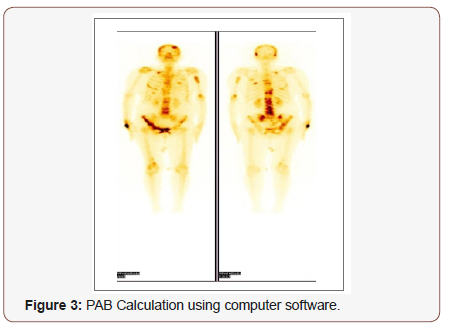
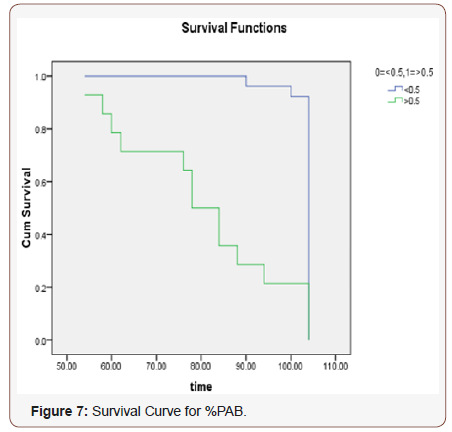
In this method the involved areas on the bone scan of a patient were measured using the computer software and are summed up; used as a numerator as mentioned in the above formula, whereas using the same software the width of the hip bone and the height of the skeleton was measured on the same bone scan; using as a denominator as per mentioned in formula and finally the percentage was calculated. The arbitrary cut off for %PAB method was taken as 0.5.The patients with %PAB above this cut off values were considered high risk as compared to the dataset of patients having % PAB values below this cut off. M. Nogouchi et. al used the same method of %PAB for osseous metastasis quantitation and survival analysis.
% PAB Calculation was calculated using following steps using computer software.
Step 1

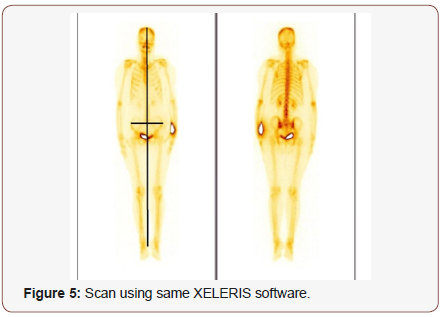
Step-3: Calculating the height of the Skeleton along with the width from the gluteal region on the Scan using same XELERIS software in mm units. (The Height is taken from vertex till heel of the skeleton whereas the width is calculated using the bilateral anterior superior ileac spine) (Figure 5).
Step-4: Calculating the % PAB of the Scan by Applying the Formula:

Bone lesion scoring
The bone lesion scoring is also a subjective method in which numbers of lesions are assessed clinically at different regions of the skeleton and is then summed up to find out the exact scoring of the scan (Proposed by Prof. Guiliano Mariani, Universtiy di Pisa Italy, verbal Communication).The following regions have been given score as shown in the table below: (Table 3)
Table 3: Bone Lesion Scoring.

The cut off for BLS was taken arbitrarily as 5 for the purpose of survival analysis and prognosis evaluation. The patients with baseline bone scan bone lesion scoring (BLS)>5 were considered as high risk whereas those with BLS < 5 were considered low risk.
Results
Quantitative parameters and survival curves
The survival curves were generated by using the respective cut off values to the data set of 40 patients for a period of two years (Figure 6).
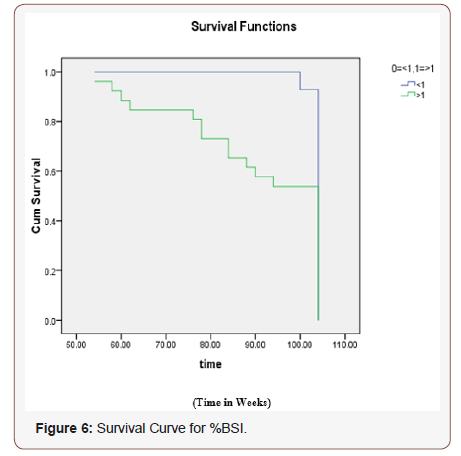
Ho: There is no difference regarding survival among two levels. H1: There is difference regarding survival among two levels. The Chi-squared statistic of log rank test is 6.232 with associated P-value (0.013) of less than 0.05 rejects null hypothesis. The conclusion therefore is that, statistically, the two survival curves differ significantly, or that the grouping variable has a significant influence on survival time. Rejection of null hypothesis shows that two levels <1 and > 1 are not identical regarding survival. The conclusion is that the curve representing the patients with the decrease tumour burden (<1) has low risk and good survival then with the curve representing the patients (>1) with more tumour burden.
Figure 7 Ho: There is no difference regarding survival among two levels. H1: There is difference regarding survival among two levels. The Chi-squared statistic of log rank test is 28.257 with associated P-value 0.000 less than 0.05 rejects null hypothesis. The conclusion therefore is that, statistically, the two survival curves differ significantly, or that the grouping variable has a significant influence on survival time. Rejection of null hypothesis shows that two levels <0.5 and > 0.5 are not identical regarding survival. The conclusion is that the curve representing the patients with the decrease tumour burden (<0.5) has low risk and better survival then the patients with %PAB values >0.5.
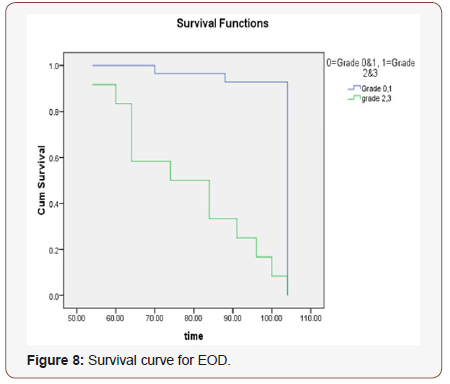
(Figure 8)
Ho: There is no difference regarding survival among two levels. H1: There is difference regarding survival among two levels. The Chi-squared statistic of log rank test is 79.615 with associated P-value 0.000 less than 0.05 rejects null hypothesis. The conclusion therefore is that, statistically, the two survival curves differ significantly, or that the grouping variable has a significant influence on survival time. Rejection of null hypothesis shows that two levels 0=grade 0&1 and 1= grade 2&3 are not identical regarding survival. The conclusion is that the curve representing the patients with the decrease tumour burden (grade 0&1) has decrease risk then with the curve representing the patients (grade 2&3) with more tumour burden.
(Figure 9)
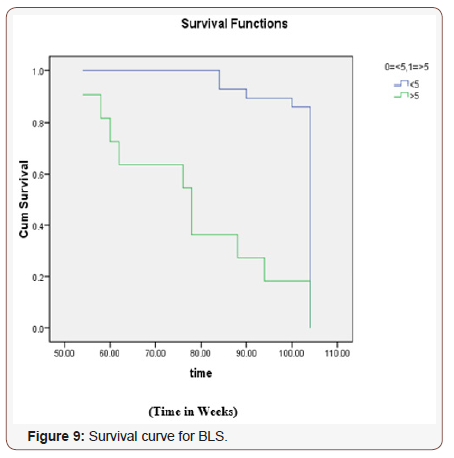
Ho: There is no difference regarding survival among two levels. H1: There is difference regarding survival among two levels. The Chi-squared statistic of log rank test is 26.88 with associated P-value 0.000 less than 0.05 rejects null hypothesis. The conclusion therefore is that, statistically, the two survival curves differ significantly, or that the grouping variable has a significant influence on survival time. Rejection of null hypothesis shows that two levels <5 and >5 are not identical regarding survival. The conclusion is that the curve representing the patients with the decrease tumour burden (<5) has good survival and decrease risk then with the curve representing the patients (>5) with more tumour burden.
Discussion
To quantitative all bone metastasis in patients is a timeconsuming task, since the patients with metastatic involvement usually have more than one disease site. Several studies have evaluated different ways to quantify the extent of bone involvement during therapy. Interpretation of the bone scans is a tedious procedure for the physicians and often leads to misinterpretation either as overestimation or underestimation of the metastasis. To minimize the risk of misinterpretation, one of the careful methods is quantitative analysis of the bone scans in order to ascertain, whether a metastatic lesion is present or not. There are several methods to-date which can be used to analyze the extent of such lesions. For example, quantitation of the bone scan i-e % BSI (Bone scan index) [2], % PAB (Positive area on bone scans) [3], EOD (extent of disease) [4] and BLS (Bone lesion scoring) [5]. Among these, %BSI has most frequently been used and validated in various studies. Novel automated software based on %BSI quantitative calculations has been developed and is in clinical use in many nuclear medicine departments. Despite all these shortcomings there is body of evidence that these quantitative bone scan parameters not only increase interpretation accuracy but can also serve as image biomarkers. Most of the published literature focuses on determining accuracy of either one or two parameters at a time. But to date there is not study comparing all these parameters. Based on this premise this study was designed to evaluate the accuracy of different bone scan qualitative methods namely %BSI, %PAB, EOD and BLS. Study also explored each quantitative parameter as a prognostic indicator in prostate cancer patients. In our study we applied four quantitative parameters on baseline bone scans and follow up to evaluate the efficacy of all these parameters as effective prognostic indicator. For purpose of quantification arbitrary cut off were applied for each parameter. Cut offs were % BSI: <1 low risk and >1 high risk , % PAB: <0.5 was low risk while >0.5 means high risk patients, EOD: grade 0&1 were considered low risk , grade2, 3&4 were considered as high risk, and in BLS: score of <5 was considered low risk and >5 was vice versa.
The conclusion of % BSI is that the curve representing the patients with the decrease tumour burden (<1) has low risk and good survival then with the curve representing the patients (>1) with more tumour burden. For BLS 5 was taken as cut off. In BLS the conclusion is that the curve representing the patients with the decrease tumour burden (<5) has good survival and decrease risk then with the curve representing the patients (>5) with more tumour burden. Similarly, % PAB with cut off > 0.5 showed less survival and increased tumour burden similarly EOD with grade 2 & 3 shows increased tumour burden and less survival. An overall trend seen in all serial scanning patients was that, there was decline in quantitative parameter numerical values or it remained stable in comparison with the patient which died where quantitative parameter numerical values were mostly increased. Although all parameters were able to predict survival and prognosis on change of parameter quantification results however, parameters which were based on number of lesions and not on involvement of skeletal percentage were not able to predict survival as accurately as others did. For example, in EOD and in BLS the change of grade from 1 category to another was not that overt and many a time’s patients were in the same group in which they were at baseline. Similarly, when we see correlation with PSA, %BSI and %PAB performed better than the EOD and BLS. In survival analysis all parameters performed well and at give cut off point it was seen that low and high-risk patient have marked difference in survival at 2 years. So all quantitative parameters are strong predictors risk stratification. The changes seen on serial bone scans reflected metastatic activity in the skeleton. Deterioration on the bone scan indicated disease progression or poor prognosis. Improvement on scan reflects regression of metastatic disease and usually implied a favorable survival. Consistent stabilization on the scan Correlated with clinical stable disease and was associated with better survival than for the progressing patients.
Limitations
The limitation of our project is that we have included all the baseline bone scans of Carcinoma Prostate Patients irrespective of the treatment (Hormonal- Non-Hormonal). Due to less time tenure of the project it was not possible to collect both the Baseline and the follow up scans of all the patients, though we have included 40 patients with both baseline and follow up scan (on hormonal treatment only) data. But in such small group of patients we cannot comment on the prognostic value and survival of the patients accurately.
The results are analyzed irrespective of the ‘Flare Phenomenon’ and that’s why a lot of variation is observed. The scans have been analyzed subjectively via visual inspection without any aid of automated software in most quantitation methods except one. So, there are chances of human error too.
Conclusion
All the four quantitative parameters (% PAB, %BSI, BLS and EOD) are good in quantifying the tumor burden and are good indicator in determining the disease status. %PAB and % BSI quantitative parameters are comparatively more accurate as compared to the EOD and BLS method. The prostate cancer patients with the cut off % BSI >1, %PAB > 0.5, BLS >5 and EOD with grade 2, 3 & 4 showed disease progression and less survival.
Acknowledgment
None.
Conflict of Interest
No conflict of interest.
References
- Richmond CR (1985) International Journal of Radiation Biology ICRP 48(2): 285.
- Dennis, Xiaoyu J, Irina SM, Ryan DS, Heiko S, et al. (2012) Bone scan index: A quantitative a treatment response biomarker for castration resistant prostate cancer patients. J Clin Oncol 30: 519-523.
- Noguchi M, Ishibashi M, Noda S (2003) Percentage of the positive area of bone metastasis is an independent predictor of disease death in advanced prostate cancer. Br J Cancer 88: 195–201.
- Soloway MS, Hardeman SW, Hickey D, Raymond J, Todd B, et al. (1988) Stratification of patients with metastatic prostate cancer based on extent of disease on initial bone scan. Cancer 61(1): 195-202.
- Mariana R, Anders B, Mattias O , Lars E , Elin T, et al. (2014) Increase in bone scan index during abiraterone treatment in relation to reduced survival in mCRPC patients. J Clin Oncol 32(4): 244.
-
Nayab Mustansar. Survival Rate Estimation of Advanced Carcinoma Prostate Patients by using Bone Scan Quantitative Parameters. Adv Can Res & Clinical Imag. 2(1): 2019. ACRCI.MS.ID.000529.
-
Prostate cancer , Tumors , Cancer , PAB , Carcinoma, Osteochondroma Osteoid osteoma, Giant cell tumor, Osteoblastoma, Enchondroma
-

This work is licensed under a Creative Commons Attribution-NonCommercial 4.0 International License.


