 Research Article
Trends in Soil Measurement Performance of Australasian Laboratories by Methods and Time
George E Rayment1* and David J Lyons2
1Former ASPAC Chairperson, Australia
2Immediate past ASPAC Chairperson, Australia
George E Rayment, Former ASPAC Chairperson, Queensland, Australia.
Received Date: February 04, 2019; Published Date: March 06, 2019
Abstract
This paper describes Australasian soil-measurement performance using data from inter-laboratory soil proficiency programs of the Australasian Soil and Plant Analysis Council Inc. Rapid assessments focused only on grand median percent robust coefficients of variation (%CVs) from 2004-05 through to 2014-15 inclusive, where grand medians by method were calculated across 12 soil samples annually. The %CV data were subdivided into three groupings (2005-2008, 2009-2012, 2013-2015). For 19 soil tests, CVs declined from 12.8% to 10.6% to 8.8%, suggestive of small improvements in measurement quality with time. Detailed assessments used data from 2009-10 to 2014-15 and included tests regulated for use in “reef catchments” of North-east Australia. Relationships between median-concentrations and associated robust %CVs were initially assessed with power-functions, with each subsequently solved for realistic analyte levels. Predicted trends for each method for the six years were then plotted. From these, soil tests with most variation were Total P, Bray-1P and Acid P. The findings confirm improvements are needed before between-laboratories’ measurement uncertainties for the “reef-preferred” Acid P soil test approach those for Olsen-P, Colwell-P and Mehlich-3P. Also, measurement improvements across the six years for Mehlich-3 P exceeded those of the other empirical soil P tests. Measurements of Walkley-Black Organic C were disappointing in 2009-10 but improved to 2014-15. By 2014-15, soil P tests with lowest to highest predicted robust %CVs were Mehlich-3 , Olsen P, Colwell P, Acid P and Bray-1P, respectively. On this evidence, regulators should be more flexible when specifying preferred diagnostic soil P tests for use on sugarcane farms in “reef catchments”.
Keywords: Diagnostic soil tests; Reef regulations; Mehlich-3; Measure quality; Trend analysis
Introduction
Successive Australian and Queensland Governments for over 25 years have made policy commitments to protect The Great Barrier Reef and its Marine Park from adverse downstream effects of land uses in the river catchments of eastern Queensland that drain to the Coral Sea. The nutrients nitrogen (N) and phosphorus (P) have attracted close attention, including when used in fertilizers to grow sugarcane on around 400,000 ha of coastal soils.
Nowadays, N and P fertilizer used for sugarcane in “reef catchments” is regulated by the Queensland Government through its Environmental Protection Act 1994 [the Act] and Environmental Protection Regulation 2008; current as at 27 November 2015. Associated documentation titled “Reef Water Quality – Farming in Reef Catchments” (Environment and Heritage Protection 2016) specifies use of four soil tests to guide N and P fertilizer recommendations for plant crops of sugarcane, those being (i) Walkley and Black Organic C; (ii) Acid (BSES) P; (iii) Colwell P (when soils are alkaline); and (iv) Phosphate Buffer Index (with Colwell P). All of these plus other mentioned soil tests are described and coded by [1].
Also specified in the Reef Water Quality documentation is a requirement that “suitable laboratories performing the chemical analysis of soil samples are required to participate in Australasian Soil and Plant Analysis Council Inc (ASPAC) proficiency trials and maintain certification for the nominated methods where available”. Practitioners are then referred to the ASPAC Website, which lists laboratories certified as proficient in those soil test methods in the most recent year of ASPAC’s inter-laboratory proficiency programs for soils. A further recommendation is that “laboratories are able to demonstrate that their operations comply with the Australian Standard AS ISO/IEC 17025-2005 ‘General requirements for the competence of testing and calibration laboratories’ and have technical expertise for the specified methods”. National Association of Testing Authorities accreditation is mentioned but not demanded.
It follows that fertilizer advisers and end-users in “reef catchments” should be aware of between-laboratories’ measurement quality of soil testing services that accept and analyze soil samples for diagnostic purposes from North-east Australia, irrespective of where those laboratories locate. Concurrently, the Executive of ASPAC has sought contemporary briefings on trends in laboratory measurement performance. Indeed, measurementperformance audits [2-4] of the program in earlier years have been used to revise the structure of present programs and to provide alerts to laboratory managers on where measurement improvements were needed.
This paper describes findings and implications from quick and detailed assessments of more-recent data on soil method performance to help address issues raised in this Introduction. The data examined were from inter-laboratory proficiency programs of ASPAC that mostly targeted commercial and government laboratories from Australia, New Zealand and, to a lesser extent, Fiji, Papua New Guinea, Philippines and Vietnam. The study significantly extends earlier interlaboratory comparisons of soil P tests involving 9 separate laboratories and 24 soils from across the United States [5].
Materials and Methods
Data used for this study were all sourced from soil annual inter-laboratory proficiency program reports of ASPAC [6] plus unpublished data summaries from 2013-14 and 2014-15 program years. The latter are intended for inclusion in future ASPAC annual reports. Typically, pdf versions of annual reports are downloaded onto the ASPAC web-site, in the public domain, at www.aspacaustralasia. com.
Both quick assessments and more-detailed assessments of method-specific performance over time were undertaken. For each method, second-iteration grand median percent robust coefficients of variation (%CVs) [and sometimes grand median concentrations (or equivalent)] were obtained following the application of a nonparametric median / MAD statistical methodology [7-9] to soil test results from multiple participating laboratories. These were supplied in-confidence on 12 test samples annually. In all cases, soil test results associated directly with first iteration “outliers” and “stragglers” on a method-by-method basis were excluded from all second-iteration calculations. In addition, there was a slight tightening of the median / MAD statistical methodology around 2010 that occasionally excluded a few more laboratories from second-iteration statistics than had earlier been the case. The second-iteration data best associate with laboratories that achieve ASPAC certification for their test results.
Quick assessment of trends in method-specific performance
These assessments used second-iteration robust grand median data for %CVs from program-years 2004-05 through to 2014-15, compiled into three program-year clusters. Column 1 of Table 1 lists the soil test methods and corresponding %CVs displayed in Figure 1. Other methods included in the assessments but not displayed are listed in Table 1 of [6] with one notable exception. The omission was all Mehlich-3 soil test parameters, since this universal test was not introduced routinely into the soils’ program until 2008-09.
Table 1: Test methods and corresponding soil method codes [1] for soil tests used for evaluations of quick (Column 1) and detailed (Column 2) measurement performance trends.
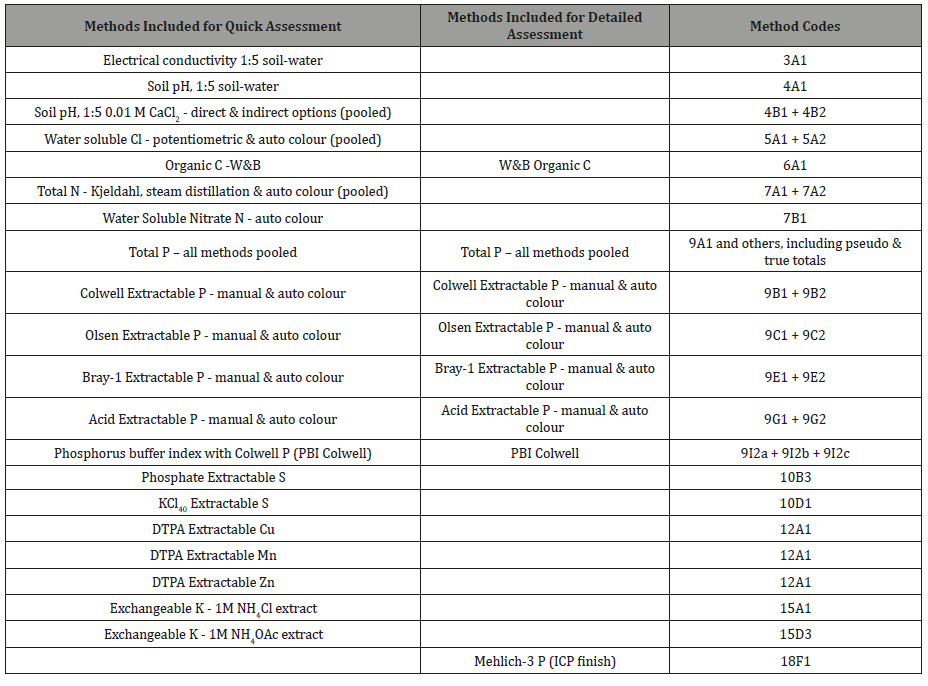
Column 2 of Table 1 lists the soil tests selected for detailed assessment of measurement-performance trends, particularly to demonstrate how second-iteration, grand median robust %CVs were affected by grand median analyte concentrations by soil test and program year. Most focus was directed to soil tests regulated for use in “reef catchments”, extended to include other soil P methods commonly used across Australia for diagnostic and research purposes. All 72 grand medians from soil-program years 2009-10 to 2014-15 and the specified tests were included.
Following their assembly, data for median concentrations for each test and associated robust %CVs were plotted and statistically assessed for continuous trends: positive values for all robust %CVs made it appropriate to use continuous power functions throughout. Next, each power-function equation was solved for a range of realistic analyte concentrations, then continuous predicted trends for each year (separately for each method and irrespective of goodness-of-fits) were plotted to assess apparent year-byyear improvements or otherwise in measurement performance. These plots cover six years of inter-laboratory proficiency testing separately for each of the eight selected methods.
In addition, and for soil-test concentrations up to 150 mg P/ kg, predicted robust %CVs for each of the five most-common diagnostic soil P tests used in Australasia were plotted together, using data only from the 2014-15 program year. This was done to provide a modern Australasian rating of best-performed to leastwell performed diagnostic soil P tests, with most emphasis on concentration ranges from 20 to 100 mg P/kg.
Finally, linear regressions were used on soil-program median data from 2009-10 to 2014-15 to established relationships: (i) between Acid P and Mehlich-3 P (ICP finish) on acidic to neutral soils (to pH 7.5); and (ii) between Bray-1 P and Mehlich-3 P (ICP finish) on all 72 soils.
Results and Discussion
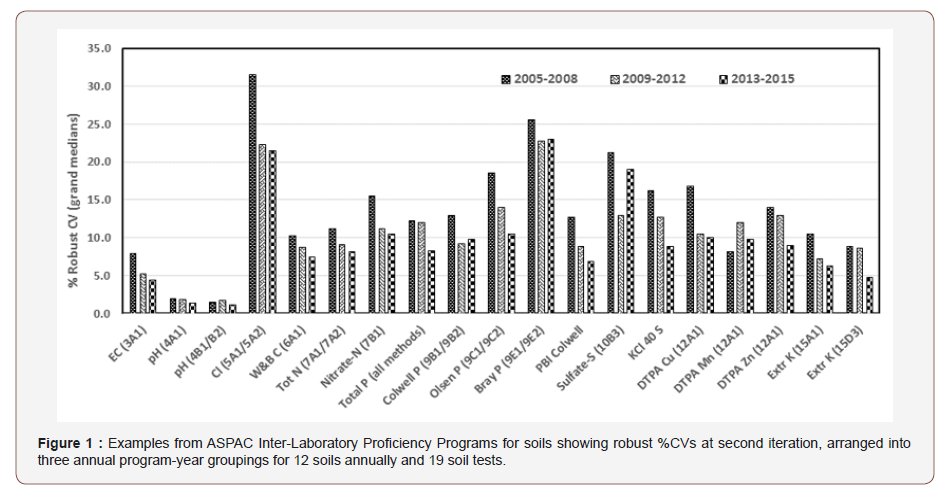
Figure 1 shows that for almost all of the soil tests displayed (and also for 13 other soil tests or test combinations not displayed), robust %CVs compiled into three clusters (years 2005-2008, 2009- 2012, 2013-2015) declined from a grand median of 11.6% to 9.9% and finally to 8.6%. For the 19 tests or test combinations in Figure 1, the decline in robust CV values was from 12.8% to 10.6% to 8.8% for the three program-year clusters, respectively (Figure 1).
Figure 1 and similar non-displayed findings are suggestive of improving soil measurement performances, attributable to corrective actions taken by laboratories based on results from regular sample exchanges (three “rounds”, each involving four soils annually plus speedy feed-back of statistical evaluations and results to multiple participating laboratories) This program-improvement was first raised by [3]. The assumption, as a reason for apparent measurement improvement, ignores expected associations between decreasing analyte concentrations and increasing %CVs, as observed by many [1,3,10]. That said, the use of grand median data across the 12 test samples annually should lessen expected inverse relationships between concentrations and corresponding %CVs, as grand median concentrations annually would likely be of similar magnitude. The fact clients had open, web-based access to listings of ASPAC-certified laboratories for particular tests may also have encouraged participating laboratories to continuously improve their analytical quality. Occasional technical-training workshops offered by ASPAC on methodology would also have helped [11].
Nevertheless, the large numeric differences in %CV values that still exist across the suite of methods displayed remain a disappointment. For example, %CVs at second iteration for soil pH (codes 4A and 4B) were always <4% (good), while for water soluble chloride (5A codes) CVs for all three groupings consistently exceeded a disappointing 20%, the latter known to be linked to multiple test samples low in water-soluble chloride (Rayment and Lyons 2004).
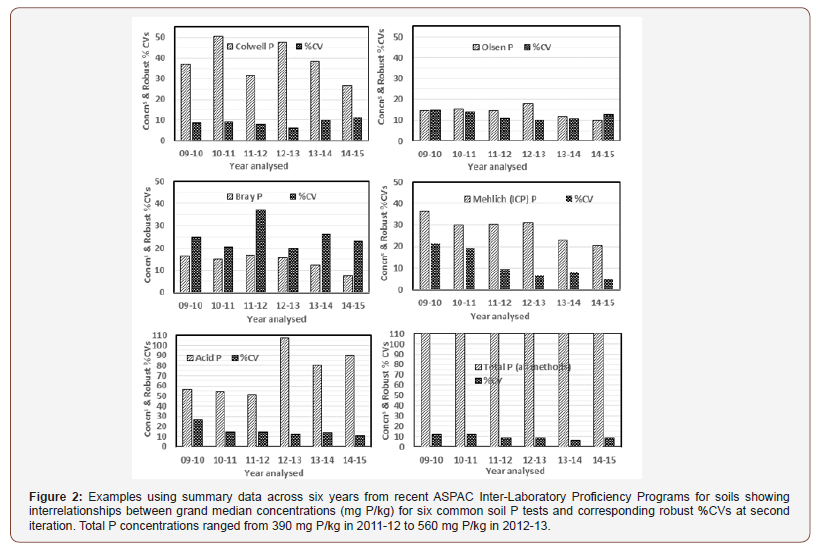
For Total P plus the five most common empirical soil P tests used in Australia (includes Mehlich-3 P with ICP finish; code 18F1), differences in measured concentrations and in calculated %CVs varied within and among the methods examined for all soil program years from 2009-10 to 2014-15. Across those years, grand median P concentrations (all as mg P/kg) were 14.5 (Olsen), 15.3 (Bray-1), 30.3 (Mehlich-3), 37.6 (Colwell), 68 (Acid) and 490 (Total). Corresponding robust %CVs were 12, 24, 8.8, 8.9, 14.5 and 8.7, respectively, noting that %CV trends declined consistently with time only for the Mehlich-3 and Acid P tests (Figure 2). Clearly, measurement issues other than analyte concentrations alone seem associated with the recorded uncertainties, with Bray-1 P and Acid P constantly the least-well performed empirical soil P tests indicated by relatively high %CVs (Figure 2).
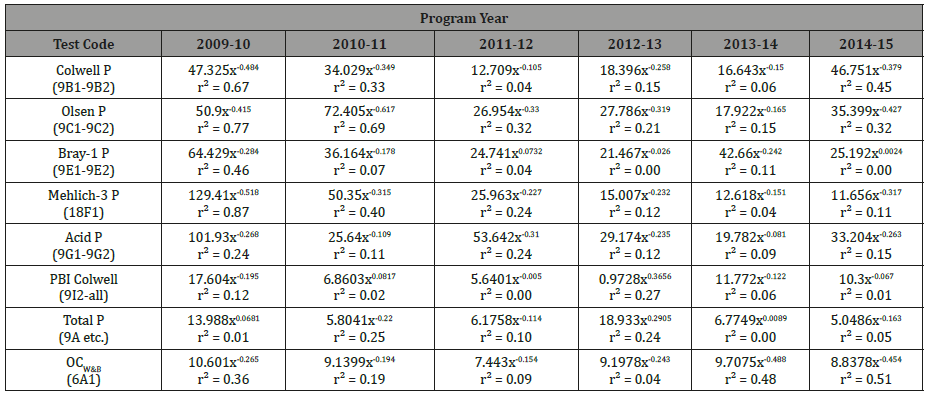
For detailed assessment, Table 2 lists all power-function parameters and coefficients of determination for the eight selected, commonly-performed methods across eight sequential years to 2014-15. Many were but not all trends were statistically significant, noting that n=12 applied to all except for Acid P in 2009-10, when n=7 applied (Table 2).
Table 2: Parameters and corresponding coefficients of determination for continuous power functions separately between median concentrations for each of eight soil test methods [1] and for six sequential inter-laboratory program years versus corresponding median values for second-iteration robust %CVs..
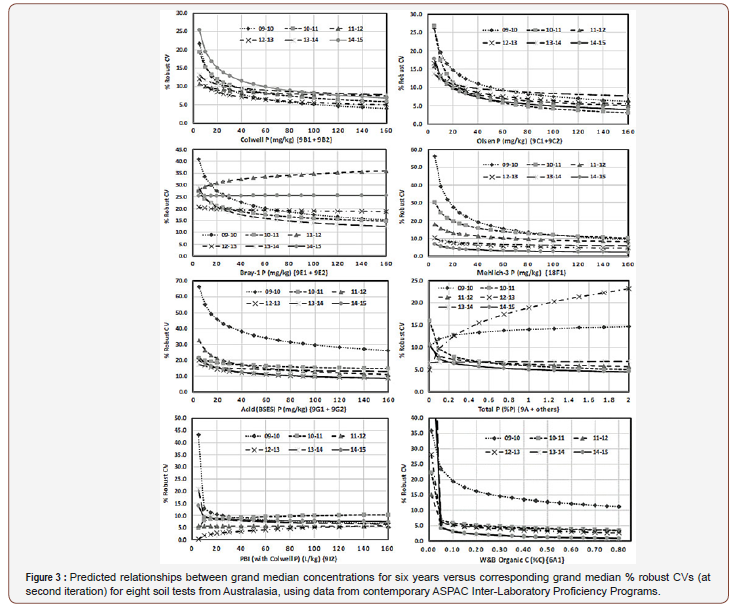
Plots of predicted trends for each year (separately for the eight selected soil tests) and shown in Figure 3 were obtained by solving each equation listed in Table 2 across a range of realistic analyte concentrations. The six-continuous trend-lines for each soil test reflect the magnitude and consistency of year-by-year measurement improvements or otherwise (Figure 3).
From the shape and magnitude of predicted trend lines by method, the worst-performed across the six-year interrogation period were tests for Total P, Bray-1 P and Acid P. There is visual evidence, however, of slight improvements in the betweenlaboratory measurements of Acid P since 2009-10, although there is still a long way to go before between-laboratories’ measurement uncertainties associated with this “reef-preferred” soil P test reach levels of measurement quality comparable with those presently associated with Olsen-P, Colwell-P and Mehlich-3 P (ICP finish). Moreover, measurement improvements across the six years for Mehlich-3 P (ICP finish), as indicated by declining %CV values, predicted from second-iteration data, exceeded those predicted for all other empirical soil P tests. The worst performed empirical soil P test was Bray-1, which had predicted robust %CVs at 40 mg P/ kg of 17.5% to 24.5%. Total P measurements were reasonable in most years for predicted concentrations up to at least 2% P, except for 2009-10 and particularly in 2012-13, when measurementperformance trends were opposite to those expected, suggestive of methodology issues, likely due to including pseudo total P results with true total P data. Apart from 2009-10 when measurementperformance was disappointing, Walkley-Black Organic C was reasonably-well and consistently performed at concentrations from 0.1%C to at least 0.8%C (Figure 3).
More valuable than recent multi-year trends to participating laboratories and also to end-users (includes government regulators) is the most-recently available information (the 2014-15 data) on particular soil tests. And for agricultural-extension purposes, the measurement quality of empirical (diagnostic) soil P tests are of particular interest. These details are collated in Figure 4.
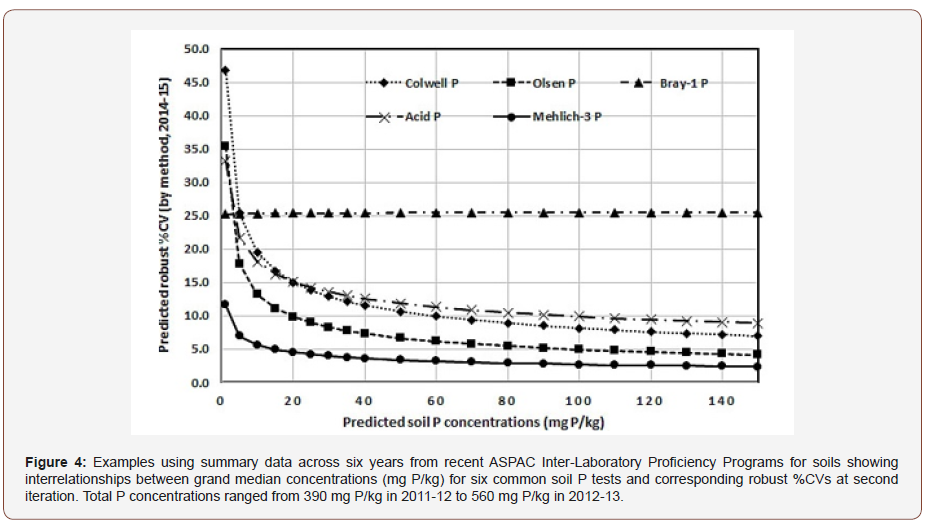
Figure 4 shows that by 2014-15, predicted %CVs for Mehlich-3 P (ICP finish) were lower at all concentration ranges to at least 150 mg P/kg than was the case for the other diagnostic soil P tests examined from Australasia. Within the important predicted concentration ranges of 20 mg P/kg to 100 mg P/kg, the best to worst measured soil P tests across participating laboratories were Mehlich-3 P, Olsen P, Colwell P, Acid-P and Bray-1 P, respectively.
On this evidence, regulators should be more flexible when specifying preferred diagnostic soil P tests for use on sugarcane farms in “reef catchments”, with Mehlich-3 P (ICP finish) emerging as a useful addition or alternative to the Acid P test. Cross-over relationships between the two methods, such as those published for local sugarcane-growing soils by [12], support this suggestion. In addition, there is a significant (r2 = 0.56) linear relationship [Mehlich-3 P = 0.385 Acid P; units of mg P/kg] for 53 pairs of acidic to neutral (to pH 7.5) grand median soil data from program years 2009-10 to 2014-15. Noting the Code of Practice for Sustainable Cane Growing in Queensland [13] gives a P fertilizer cut-off range of 21–40 mg of Acid P/kg for ratoon cane, corresponding Mehlich-3 P values would be around 8–15 mg P/kg. If Mehlich-3 P (ICP finish) is offered, laboratories committed to measurement quality should heed the detailed methodology of [1,14].
Similarly, use of the Bray-1 P test across Australasia warrants replacement with either Mehlich-3 P, Olsen P, or Colwell P, noting there is a good (r2 = 0.89), local (72 pairs of sample grand median data from program years 2009-10 to 2014-15) linear correlation between Bray-1 P test values and corresponding values for Mehlich-3 P (ICP finish) [Mehlich-3 P = 1.579 Bray-1 P + 6.0535; units of mg P/kg]. One possible reason for large, between-laboratory differences in reported values for Bray-1 P is the wide range of standing times known to occur between the test’s 60 sec extraction time and the usual time allowed to elapse between soil extraction and final analysis, sometimes up to 24 hours. Interestingly, in the interlaboratory comparisons of soil P tests undertaken in the United States by [5], Olsen P had greater measurement uncertainty than Bray-1 P, confirming the value of regional assessments of soil measurement quality.
Conclusion
The findings here-in reveal merit in both quick and detailed assessments of laboratory measurement quality using seconditeration, inter-laboratory proficiency data from multiple laboratories and years.
An advantage of the program-year clustering approach using robust %CVs for the various methods annually (three annual groupings on this occasion) is its simplicity and speed. Moreover, future annual data could build on present yearly groupings, or the starting dates for each grouping could advance annually. Main weakness is the technique’s failure to take account of variations in grand-median analyte values.
This weakness is mostly circumvented by the detailed assessment undertaken, although these are reliant on good quality predictions of continuous relations between analyte concentrations and predicted robust %CVs, which was not always the case [15-17]. A strength is the ability to compare / contrast performance trends of competing methods annually, such as for the diagnostic P tests used in Australasia. Such trends warrant updating on an annual basis to guide follow-up actions. There is also merit in examining non-compliance data from laboratories who had their results for particular methods excluded as ”outliers” or “stragglers”, even when due to use of inappropriate units of reporting.
Finally, the profession (ASPAC across Australasia) should rampup its “profile” in the “reef catchments” of North-east Australia, and interact closely and often with those who regulate, perform and utilize the presently specified soil tests. In addition, it should invigorate a campaign to supersede the Bray-1 P diagnostic soil P test in this region, with one or more alternatives with superior measurement quality. Also, ASPAC should separate “pseudo” and “total” P methods’ data in future soil interlaboratory proficiency programs to put more rigor into the quality of Total P measurements.
Acknowledgement
None.
Conflict of Interest
No conflict of interest.
References
- Rayment GE, Lyons DJ (2011) Soil Chemical Methods – Australasia.
- Rayment GE (2005) Statistical aspects of soil and plant test measurement and calibration in Australia. Communications in Soil Science and Plant Analysis 36(1-3): 107-120.
- Rayment GE, Miller RO, Sulaeman E (2000) Proficiency testing and other interactive measures to enhance analytical quality in soil and plant laboratories. Communications in Soil Science and Plant Analysis 31(11- 14): 1513-1530.
- Rayment GE, Peverill KI (2002) Proficiency testing for soil and plant analysis in Australasia. Communications in Soil Science and Plant Analysis 33(15-18): 2441-2455.
- Kleinman PJA, Sharpley AN, Gartley K, Jarrell WM, Kuo S, et al. (2001) Interlaboratory comparison of soil phosphorus extracted by various soil test methods. Communications in Soil Science and Plant Analysis 32: 2325-2345.
- Rayment GE, Lyons DJ, Hill RJ (2017) ASPAC Soil Proficiency Testing Program Report 2011-12. ASPAC, Melbourne, Victoria.
- Houba VJG, Uittenbogaard J, Pellen P (1996) Wageningen evaluating programmes for analytical laboratories (WEPAL), organization and purpose. Communications in Soil Science and Plant Analysis 27: 421- 429.
- Montford MAJ Van (1996) Statistical remarks on laboratory - evaluating programs for comparing laboratories and methods. Communications in Soil Science and Plant Analysis 27(3,4): 463-478.
- Whitehouse MW (1987) Medians and MADs - Statistical methodology used at Wageningen, The Netherlands, for interlaboratory comparisons in the plant exchange program. Agricultural Chemistry Branch Report, ACU87/36. 10 pp. (Queensland Department of Primary Industries, Brisbane).
- Horwitz W (1982) Evaluation of analytical methods used for regulation. Analytical Chemists 65: 525-530.
- The Laboratory Proficiency Committee (2016) ASPAC Inter-Laboratory Proficiency Programs – are they ‘delivering the goods’? ASPAC Digest, October, 3-5.
- Ostatek Boczynski ZA, Lee Steere P (2012) Evaluation of Mehlich 3 as a universal nutrient extractant for Australian sugarcane soils. Communications in Soil Science and Plant Analysis 43(4): 623-630.
- Anon (1998) Code of practice. Sustainable Cane Growing in Queensland. Canegrowers, Queensland, Australia.
- Shahandeh H, Hons FM, Provin TL, Pitt JL, Waskom JS (2017) Factors affecting Mehlich III soil test methodology for extractable P. Communications in Soil Science and Plant Analysis 48(4): 423-438.
- (2016) Environment and heritage protection. Reef water quality - Farming in reef catchments. The method for soil sampling and analysis for sugarcane properties regulated under the Environmental Protection Act 1994. Reef Water Quality, Environmental Policy and Planning Division, Department of Environment and Heritage Protection, The State of Queensland.15 pp. March 2016.
- Horwitz W (1982) The problems of utilizing trace analysis in regulatory analytical chemistry. Chemistry in Australia 49: 56-63.
- Rayment GE, Lyons DJ (2004) Australasian performance of laboratory methods for soil and plant salinity. In: Salinity Under the Sun – Investing in the Prevention and Rehabilitation of Saline Lands in Australia. Proceedings of 9th PUR$L National Conference – 29th September - 2nd October 2003, Yeppoon. Theme 1 (Sharing a common understanding) poster paper, 3 pp.
-
George E Rayment, David J Lyons. Trends in Soil Measurement Performance of Australasian Laboratories by Methods and Times. World J Agri & Soil Sci. 1(4): 2019. WJASS.MS.ID.000519.
-
Diagnostic soil tests, Reef regulations, Mehlich-3, Measure quality, Trend analysis, Sugarcane, Reef catchments, Soil, Pooling
-

This work is licensed under a Creative Commons Attribution-NonCommercial 4.0 International License.


