 Research Article
Role of Stratospheric Temperature and Humidity in Occurrence of 2011 Spring Ozone Anomaly in the Arctic and on the Northern Territory of Russia Using Aura OMI/ MLS Observations
Oleg E Bazhenov, VE Zuev Institute of Atmospheric Optics, Russian Academy of Sciences, Russia.
Received Date: January 23, 2019; Published Date: March 01, 2019
Abstract
In March-April 2011, the М-124 ozonometer observations recorded an anomalous decrease in the level of the total ozone (TO) content over Tomsk. The decrease reached 30% as compared to multiyear average. The paper studies the temperature, humidity, and ozone anomalies, recorded in March 2011 by the Aura OMI/MLS instrumentation in the stratosphere of Arctic latitudes and on the northern territory of Russia. Their relation to the decrease in the ozone concentration over Tomsk in April 2011 is analyzed. It is hypothesized that the Arctic phenomena are the result of ozone loss due to heterogeneous reactions on the surfaces of particles in polar stratospheric clouds after a return of sunlight during spring. Supposedly, irreversible growth of water vapor content at heights of ozone maximum in the second half of March had raised the temperature threshold for formation of PSCs that persisted until late March; this probably promoted the chlorine activation and, thereby, delayed the chlorine deactivation, resulting in even greater overall ozone losses during March 2011. The subsequent midlatitude phenomena seem to be due to synoptic-scale export of the ozone-depleted humid Arctic air masses.
Introduction
Present-day estimates indicate that the total ozone (TO) column has a positive trend since 2000 at most latitudes, but this trend is not statistically different from zero in many regions [1]. The meteorological conditions in 2010-2011 were unusual for the Arctic and resulted in record-low ozone. If analogous conditions were to arise again in the Arctic while stratospheric chlorine loading remains high, similar severe chemical ozone losses would take place again. A stable stratospheric polar vortex was extremely long-lived in the winter-spring of 2010-2011 in Arctic. The transport barrier at the edge of polar vortex in February-March was the strongest in the last 30 years [2]. The temperatures below TNAT~195 K (the temperature threshold for formation of polar stratospheric clouds (PSCs) Ia) persisted until late March in the altitude interval of 15-23 km [2]. The temperature in the Arctic stratosphere in March 2011 was the second least in the period of 1979-2011, and the Arctic polar vortex was the third or fourth longest of the satellite era [3].
Unusually weak tropospheric planetary wave driving allowed the vortex to remain strong, stable, and cold for an extended period, with its mid-April breakup date one of the latest in the satellite era. Daily minimum temperatures were only moderately low (i.e., rarely below ice PSC formation thresholds), but the cold region was uncommonly long lasting and vertically extensive, leading to a winter-mean vortex fractional volume of air with the potential for PSC formation that was the largest ever observed in the Arctic [2]. An irreversible cooling speeded up diabatic subsidence of air masses from overlying layers which, in particular, had led to ever growing abundance of water vapor, produced in high layers by methane oxidation and explaining qualitatively the positive water vapor anomaly [4].
In contrast to previous cold Arctic winters, when chlorine deactivation had already been completed by mid-March, in 2011 chlorine monoxide ClO began decreasing rapidly only about a week earlier than is typical in the corresponding season in the Antarctic. Accordingly, the content of HCl reached a minimum on March 12, and then gradually grew. It is argued [2] that denitrification persisted into late March and reached a level comparable to Antarctica. Content of HNO3 in the 2011 lower stratosphere was about 40% lower than the 2003-2010 multiyear average and remained so until late March. Depending on the available amount of HNO3, the chlorine radical is deactivated either through formation of HCl or ClONO2, with the latter reaction proceeding faster. However, at the end of the 2011 PSC season, the two reservoir molecules are reformed identically due to deficit of nitrogen species [2].
Water vapor in the stratosphere actively participates in chemical reactions and, in particular, in reactions of ozone destruction, either by producing odd-oxygen species, which can destroy odd oxygen, or by promoting the formation of PSC particles, enabling efficient conversion of chlorine reservoir species to chlorine radicals. In the winter polar vortex, water vapor may condense to form (ice) PSC II. Water vapor content may also influence the formation of PSC I because the H2O and HNO3 contents are important for formation of both nitric acid trihydrate (NAT, HNO3 . 3H2O) [5] and supercooled ternary solution (STS, H2So4/HNO3/H2O) [6] particles. In addition, rate constants of reactions on STS particles depend on their composition, determined by water vapor content [7].
The higher the water vapor concentration, the larger the ice PSC area in the stratosphere; on the contrary, in a dry vortex no ice PSCs form even when temperatures are low enough [8]. In addition, growth of water vapor concentration in the atmosphere raises the threshold temperature for halogen activation, thus prolonging the period of heterogeneous reactions and elevated ClO concentrations. During warm winters with temperatures close to threshold for chlorine activation, increases in water vapor may shift this threshold toward higher temperatures. Thus, a likely tendency of the coming decades will be non-unique dependence of Arctic ozone losses on still high chlorine loading in the stratosphere [9].
The authors of works [10-12] showed that the level of ozone destruction in Arctic can depend on variations in water vapor content in the stratosphere, caused either by the increase of methane content, or by changes in the water vapor inflow through the tropical tropopause. Their calculations indicate that the effect on ozone loss of 1 ppmv increase in water vapor is comparable to a 1K cooling. It is argued [12] that, if the mixing ratio of water vapor H2O increases by 0.25ppmv, from 5 to 5.25ppm, temperature below the ice frost point Tice (~185K at 20 km) will persist 299 hours longer than for reference conditions (normal stratospheric winter conditions, beginning of the winter, thus prevailing gas-phase abundances of 5ppmv H2O and 7ppmv HNO3). If water vapor increases further from 5 to 5.5 or 6 ppmv, this situation will persist 669 and 1728 hours longer respectively. Thus, the effect of the water vapor will be enhanced with its growth in the stratosphere. In the extreme case when H2O mixing ratio increased by 1 ppmv and the temperature decreased by 1 K, the period of time with temperature below Tice increased from 571 to 6789 hours, i.e., by ~6000 hours or, more specifically, by a factor of 12.
Present-day changes in concentrations of greenhouse gases such as carbon dioxide, water vapor, and ozone warm the troposphere and cool the stratosphere. It is suggested [10] that the stratosphere may cool further, thus favoring elongation of PSC season in Arctic. It is also argued that PSCs may live longer in the humid Arctic stratosphere. In this paper, data of Ozone Monitoring Instrument (OMI) and Microwave Limb Sounder (MLS) observations on Aura satellite [13] are used to analyze 2011 spring ozone anomalies on the territory of Russia and to study the effect of anomalously low temperatures and anomalously high humidity’s in the Arctic stratosphere on ozone depletion at Arctic latitudes and over Tomsk in March-April 2011.
Data
The total ozone (TO) content has been measured with the help of М-124 ozonometer at the Siberian Lidar Station of VE Zuev Institute of Atmospheric Optics, Siberian Branch, Russian Academy of Sciences (Tomsk: 56.48° N, 85.05° E) since 1993. In our measurements, we recorded a TO decrease in March - April 2011 over Tomsk and compared it to OMI observations. There is a good agreement between measurements, with maximal TO decrease in April. We should note that the relative average difference between ground-based (М-124) and satellite (OMI) measurements had been 15 DU (~4%) in 2017. For consistency of presentation, we will analyze Aura OMI and MLS satellite observations.
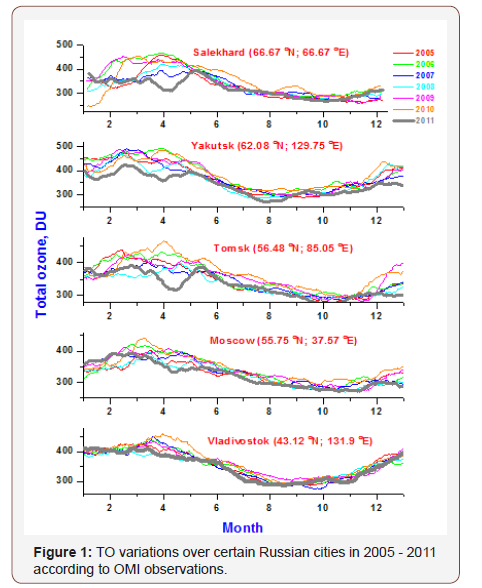
Figure 1 compares the 2005-2011 OMI data for five Russian cities. From the figure it can be seen that the effect of TO decrease as compared to multiyear average levels for March - April is most pronounced at northern latitudes and weakens equatorward. Our previous measurements [14] show that the multiyear annual average TO norm for Tomsk is about 400 DU in March and 390 DU in April. The М-124 ozonometer measurements indicate that TO over Tomsk decreased to 290 DU on April 14, 2011 (by 30% as compared to 2000-2010 average value of 414 DU for this date). From Figure 1 it follows that the situation became normal in May, and ozone returned to its usual seasonal behavior at all these observation sites.
The Aura MLS diurnal measurements of the profiles of temperature and ozone and water vapour mixing ratios were used to calculate the diurnally average profiles, which were then used to obtain the annual data records at different altitudes in the stratosphere. The Eureka, Canada (80.04° N; 86.17° W; EUR); Ny-Ålesund, Norway (78.93° N; 11.88° E; NAD); Thule, Greenland (76.53° N; 68.74° W; THU); Summit, Greenland (72.58° N; 38.48° W; SUM); Alomar, Norway (69.28° N; 16.02° E; ALO); Sodankylä, Finland (67.37° N; 26.63° E; SDA); Sondrestrom, Greenland (67° N; 50.62° W; SDM); and Tomsk, Russia (56.48° N; 85.05° E; TSK) sites were examined for the presence of temperature, humidity, and ozone anomalies. These anomalies had been detected at all sites, but found to be most pronounced at latitudes poleward of 70° N.
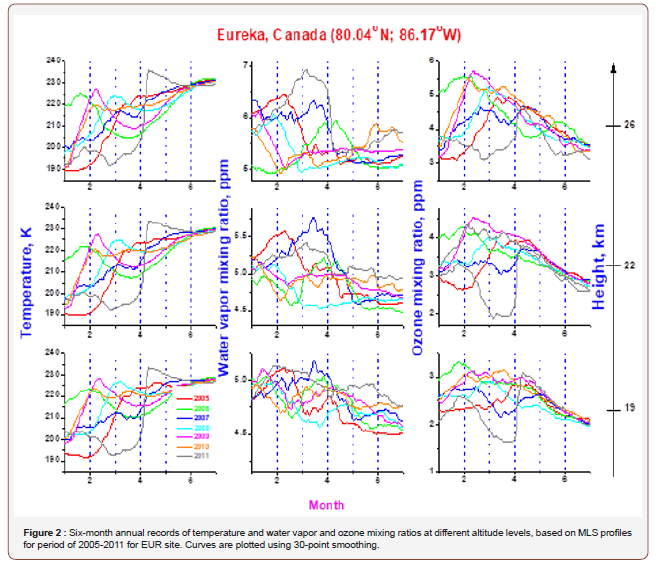
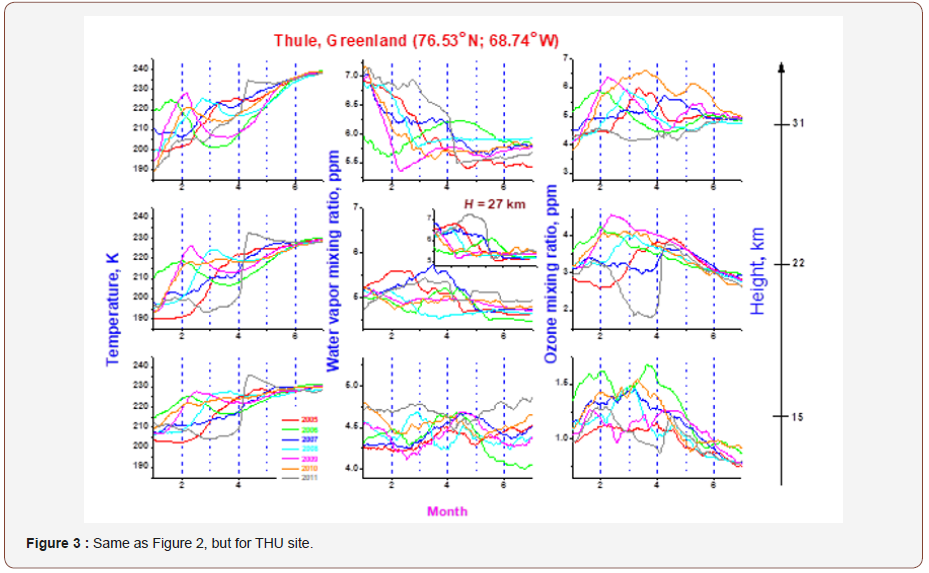
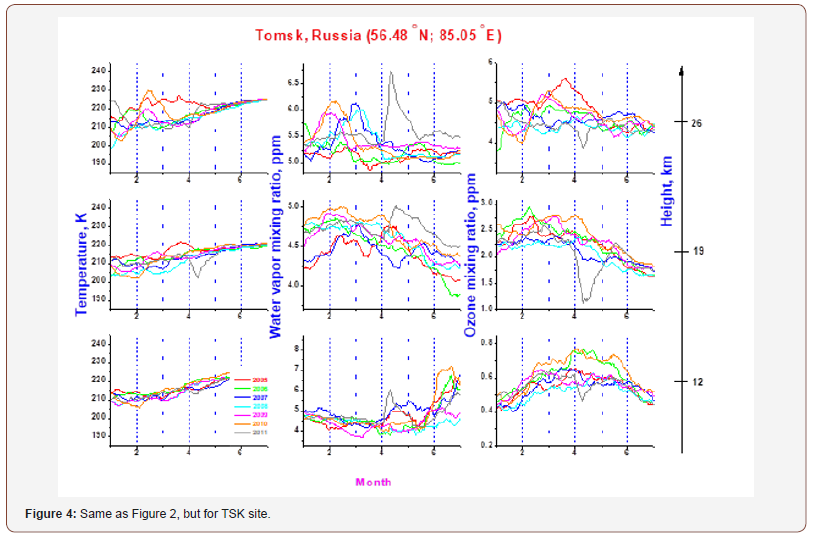
The figures below present the altitude profiles of temperature and water vapour and ozone mixing ratios for EUR (Figure 2), THU (Figure 3), and TSK (Figure 4) sites. The altitude profiles are represented as annual records of these parameters at separate altitudinal levels, shortened, for a more clarity, to the interval of first six months of the year, when ozone anomalies were observed. Individual measurements were averaged to give daily mean, and smoothing over 30 points was used in plotting. The altitude levels in the figures were selected primarily with the purpose of illustrating the scales of ozone anomaly. The parameters, considered here, have different annual variations at diverse altitudes. Therefore, for THU site, the annual behaviour of water vapour mixing ratio is additionally presented at 27-km level (see inset in Figure 3), where its anomaly is maximal.
In works [15,16] we studied the enhanced ozone destruction due to elevated humidity in the stratosphere; the temperature dependence in the relative concentration units was eliminated by converting the mixing ratios to the number concentrations [17].
Discussion of Results
From analysis of the figures it follows that, in the period of time considered here, there were anomalous behaviours of temperature and water vapour and ozone mixing ratios in broad altitude intervals over observation sites examined. As compared to previous years, anomalously low temperatures and ozone concentrations, as well as elevated water vapour mixing ratios, were observed for an extended (about 1.5-month) time interval over Arctic sites. By considering the annual behaviour of these parameters at fixed altitude levels, we can conclude that ozone in the stratosphere primarily responds to temperature decreases to 195K, the threshold temperatures for PSC formation. Therefore, the temperature in the Arctic stratosphere can be considered as a dominating factor of ozone destruction [18,19]. It is also interesting to note that all Arctic anomalies, considered here, ended almost simultaneously. Probably, low-temperature period concluded with sudden stratospheric warming, leading to polar vortex breakup and mixing of ozone-poor humid air with newly supplied air masses.
Table illustrates the scales of altitudinal and spatial spread of Arctic ozone anomaly and its effect on part of the Northern Eurasian territory; it presents maximal and minimal heights of anomalies in temperature (H1 and H2), water vapour (H3 and H4), and ozone (H5 and H6) for EUR, NAD, SUM, THU, and TSK sites.
Table 1: Maximal and minimal heights (in km) of anomalies of temperature T (H1 and H2), water vapor H2O (H3 and H4), and ozone O3 (H5 and H6).
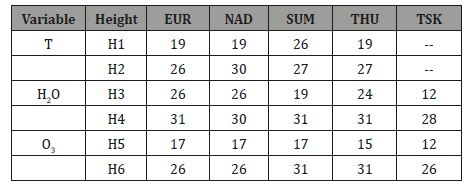
From simultaneous analysis of figures and table we can conclude that temperature decreases in the stratosphere to below 195K in March 2011 over Arctic are almost invariably accompanied by drops in ozone concentration. The water vapour anomaly may extend to heights a few kilometers higher than ozone anomaly (cf. H3 versus H5 and H4 versus H6 for EUR and NAD). For EUR and NAD, the ozone anomaly ends (H6) where water vapour anomaly begins (H3) (possibly signifying dehydration). On the other hand, ozone depletion may extend down to heights where temperatures are already too warm for PSC formation (higher than 195K) (cf. H1 and H5 for SUM and THU).
The temperatures in the stratosphere over TSK do not attain the anomalous levels; and the altitude ranges of water vapour and ozone anomalies widen to lower heights as compared to Arctic latitudes. Moreover, a later response of water vapour and ozone over TSK indicates an export of wet and ozone-poor air masses from Arctic regions to midlatitudes. An extra argument in favor of this speculation may be a shorter-term character of anomalies of these three variables as compared to Arctic latitudes.
From Aura MLS data for 2011, used in this paper, it follows that the temperature at the height of 20km was 200K at EUR site and 199 K at THU site on March 21. Nonetheless, the maximal deviations of the mixing ratio of water vapour/ozone from norm had been 1.85/-2.74 ppm for EUR and 1.74/-2.75 ppm for THU. Here, it should be stressed that TNAT can differ from 195K, when calculated from satellite data on the basis of H2O and HNO3 contents [20], increasing with growing water vapour abundance [21]. This is in agreement with observations, performed by the Cloud-Aerosol Lidar with Orthogonal Polarization (CALIOP) on Cloud-Aerosol Lidar and Infrared Pathfinder Satellite Observations (CALIPSO) satellite; the averaged altitude profiles of the contents of PSC and aerosol particles indicate that PSCs had disappeared as late as March 23-29 in 2011. In the late March, the center of cold shifted to the region between Greenland and Scandinavia, so that the maximal deviations in mixing ratios of water vapour/ozone at the 1.66/-2.64 ppm level for the temperature of 197K persisted until March 23 at the SUM site, at the 1.49/-2.03 ppm level for the temperature of 198 K until March 24 at the NAD site, and at the 1.29/-2.70 ppm level for the temperature of 195 K until March 26 at the SDA site. The corresponding Aura OMI total ozone contents were 274 DU, 268 DU, and 267 DU respectively [13]. Also, the total ozone maps [22] show qualitatively that ozone-poor area over the Spitsbergen Archipelago and Northern Scandinavia (NAD, ALO, and SDA sites) persisted into early April, in support of the fact that PSCs existed until late March and promoted dehydration (and denitrification).
It is argued [10] that a mere 1K cooling of the lower stratosphere per decade will be sufficient to promote widespread Arctic denitrification in the future. The development of a persistently cold and stable vortex is not required for this; rather, longer PSC lifetimes, similar to those of the Antarctic during mid to late June, need to be maintained only for periods less than 2 weeks. It is thought that the widespread severe denitrification can enhance future Arctic ozone loss by up to 30%. Thus, denitrification in the Arctic can occur as a result of both the cooling trends associated with greenhouse gases and the increase in water vapour concentration that directly enhances PCS formation [10]. In late March 2011, the HNO3 mixing ratio in Arctic was only 6 ppbv [2]; nonetheless, the H2O content of 5 ppmv at heights of ozone maximum (Figures 2&3) might have been sufficient to raise the threshold temperature of PSC formation to 197K at height of 18 km [21]. From work [16] it follows that it is the second half of March when the water vapour mixing ratio in the Arctic stratosphere was 1.3-1.9 ppm larger than the multiyear norm which, as argued in [10], could be equivalent to the effect of temperature decrease by 1.3-1.9K. Thus, the increased humidity in the stratosphere might have raised the threshold temperature of formation of PSCs that persisted until late March; this promoted the chlorine activation and, thereby, delayed the chlorine deactivation.
Of course it should be remembered that PSCs are unnecessary to exist all the time for the prolonged ozone destruction. The current understanding suggests that denitrification on longer-lived PSCs can increase ozone destruction somewhat, but chlorine activation can continue to occur on liquid aerosols in spring, keeping the chlorine active in sunlit air whether denitrified or not [23].
Conclusion
From analysis of OMI and MLS satellite-based observations and M-124 ground-based ozonometer measurements we can conclude that:
• During March 2011, decreased temperatures and ozone mixing ratios and increased water vapour mixing ratios were observed in the Arctic stratosphere, which may indicate PSC formation and ozone destruction;
• The largest ozone losses were observed in March. This was primarily due to photochemical release of chlorine radicals that avoided deactivation in view of nitrogen deficit caused by denitrification;
• Supposedly, irreversible growth of water vapour content at heights of ozone maximum in the second half of March had raised the temperature threshold for formation of PSCs that persisted until late March; this probably promoted the chlorine activation and, thereby, delayed the chlorine deactivation, resulting in even greater overall ozone losses during March 2011.
• During April 2011, anomalous (up to 30% lower than multiyear norm) decreases of TO level were recorded over Tomsk and a part of the northern territory of Russia, as a consequence of ozone destruction in polar Arctic stratosphere and export of ozone-depleted Arctic air masses to extra-polar regions after vortex breakup;
• In May 2011, TO returned back to its normal average seasonal values, both at Arctic and middle latitudes.
Acknowledgement
None.
Conflict of Interest
The author declares that there is no conflict of interest regarding the publication of this paper.
References
- (2014) World Meteorological Organization (WMO). Scientific Assessment of Ozone Depletion: Global Ozone Research and Monitoring. Project 55: 416, Geneva, Switzerland.
- GL Manney, ML Santee, M Rex, , Livesey NJ, Pitts MC, et al. (2011) Unprecedented Arctic ozone loss in 2011. Nature 478(7370): 469-475.
- MM Hurwitz, PA Newman, CI Garfinkel (2011) The Arctic vortex in March 2011: A dynamical perspective. Atmospheric Chemistry and Physics 11(22): 11447-11453.
- SM Khaykin, I Engel, H Vömel, IM Formanyuk, R Kivi, et al. (2013) Arctic stratospheric dehydration - Part 1: Unprecedented observation of Vertical redistribution of water. Atmospheric Chemistry and Physics 13: 11503-11517.
- D Hanson, K Mauersberger (1988) Vapor pressures of HNO3/H2O solutions at low temperatures. The Journal of Physical Chemistry 92: 6167-6170.
- KS Carslaw, B Luo, T Peter (1995) An analytic expression for the composition of aqueous HNO3-H2So4 stratospheric aerosols including gas phase removal of HNO3. Geophysical Research Letters 22: 1877- 1880.
- SP Sander, J Abbatt, JR Barker, Barker JR, Huie RE, et al. (2011) Chemical kinetics and photochemical data for use in atmospheric studies: Evaluation18.
- L Thölix, L Backman, R Kivi, A Yu Karpechko (2016) Variability of water vapor in the Arctic stratosphere. Atmospheric Chemistry and Physics 16: 4307-4321.
- DB Kirk Davidoff, JG Anderson, EJ Hintsa, DW Keith (1999) The effect of climate change on ozone depletion through changes in stratospheric water vapor. Nature 402: 399-401.
- A Tabazadeh, ML Santee, MY Danilin, Pumphrey HC, Newman PA, et al. (2000) Quantifying denitrification and its effect on ozone recovery. Science 288(5470): 1407-1411.
- BM Sinnhuber, G Stiller, R Ruhnke, T Von Clarmann, S Kellmann, et al. (2011) Arctic winter 2010/2011 at the brink of an ozone hole. Geophysical Research Letters 38(24): L24814.
- F Khosrawi, J Urban, S Lossow, G Stiller, K Weigel, P Braesicke, et al. (2016) Sensitivity of polar stratospheric cloud formation to changes in water vapour and temperature. Atmospheric Chemistry and Physics 16: 101-121.
- http://avdc.gsfc.nasa.gov/
- VV Zuev, SI Dolgii, OE Bazhenov (2004) Climatology and trends of stratospheric ozone over Tomsk during the period from 1996 to 2002. Atmospheric and Oceanic Optics 17(4): 274-278.
- OE Bazhenov (2018) Elevated humidity in the stratosphere as a gain factor of ozone depletion in the Arctic according to Aura MLS observations. Atmospheric and Oceanic Optics 31(3): 311-316.
- OE Bazhenov, Increased humidity in the stratosphere as a possible factor of ozone destruction in Arctic during spring 2011 using Aura MLS observations. International Journal of Remote Sensing; 1547449.
- http://wdc.dlr.de/data_products/SERVICES/PROMOTE_O3/vmr.html
- OE Bazhenov, VD Burlakov (2011) Anomalous decrease of the level of the total ozone content over Tomsk and northern territory of Russia in March-April 2011. Optika Atmosfery i Okeana 24(10): 915-919.
- OE Bazhenov (2012) Assessing the effects of humidity and temperature in the stratosphere on the occurrence of ozone anomaly in spring of 2011 in Arctic and over northern territory of Russia. Optika Atmosfery i Okeana 25(7): 589-593.
- D Hanson, K Mauersberger (1988) Laboratory studies of the nitric acid trihydrate: Implications for the south polar stratosphere. Geophysical Research Letters 15(8): 855-858.
- AJ Mc Donald, SE George, RM Woollands (2009) Can gravity waves significantly impact PSC occurrence in the Antarctic? Atmospheric Chemistry and Physics 9: 8825-8840.
- http://exp-studies.tor.ec.gc.ca/cgi-bin/selectMap
- S Solomon (1999) Stratospheric ozone depletion: A review of concepts and history. Reviews of Geophysics37(3): 275-316.
-
Oleg E Bazhenov. Role of Stratospheric Temperature and Humidity in Occurrence of 2011 Spring Ozone Anomaly in the Arctic and on the Northern Territory of Russia Using Aura OMI/MLS Observations. World J Agri & Soil Sci. 1(4): 2019. WJASS.MS.ID.000517.
-
Water vapor, Methane, Stratospheric winter, Temperature, Ozone, Stratosphere, Parameter, Ozon meter, Polar Arctic
-

This work is licensed under a Creative Commons Attribution-NonCommercial 4.0 International License.


