

 Research Article
Analysis of Growth Performance Data in Sheep using Linear Mixed Model
Received Date: June 06, 2019; Published Date: June 20, 2019
Abstract
The annual Ethiopian goat meat and mutton production is very low. Major causes contributing to such low meat production include slaughtering animals at immature body-weights, poor genetic potential of the local breeds, poor feeding conditions and policy issues. Increasing the current level of productivity is essential to provide meat to the ever-increasing human population and to satisfy the huge demand of live-animal export to neighboring countries. Ethiopian Sheep and Goat Productivity Improvement Program has imported Dorper sheep and Boer goat from South Africa to cross with local sheep and goats for the purpose of upgrading the productivity of local breeds. In order to promote the merit of such crossbreeding activities it is important to have data on growth potential characteristics. Accordingly, the objectives of this study was to apply linear mixed model for evaluating body-weight gain of pure and crossbred lambs and test their difference in weight gain. A linear mixed model was used to analyze repeated data on boy-weight obtained from three breed-groups, i.e., Pure Central Highland Sheep, 50%Central Highland Sheep 50%Dorper Sheep, and 75%Central Highland Sheep 25%Dorper Sheep. The pure Central Highland Sheep show a significantly lower body-weight gain than the two crossbreds. This increased body-weight gain of the crossbreds in comparison to Central Highland Sheep is justified by the higher blood-level of the crossbreds and their ability to efficiently utilize the feeds as compared to the Central Highland Sheep. This result suggests the impact of cross breeding on increased body-weight gain and thereby increasing meat production of growing lambs.
Keywords: Body-weight gain; Breed-group; Covariance structure; Model selection
Introduction
Human population growth in Ethiopia is forcing the conversion of many former grazing areas into cropland needs for increased food production. Raising ruminants is becoming increasingly difficult as a result of shortage of grazing areas. The annual Ethiopian goat meat and mutton production is 67580 and 86500 tons, respectively for goats and sheep which contributes 16.98 and 21.73% of the total ruminant livestock meat output [1]. Annual meat production is estimated 8–10kg per sheep and goats slaughtered. A major cause contributing to such low meat production is that animals are commonly slaughtered at immature body weights, 16–20kg [2]. The low level of production is also due to another constraint namely poor genetic potential of the local breeds, poor feeding conditions and policy issues [3].
Increasing the current level of productivity is essential to provide meat to the ever-increasing human population, to satisfy the huge demand of live-animal export to neighboring countries and to raise earnings and household incomes of smallholder farmers [4,5]. According to Momani et al., 2010 and Singh and Acharaya, 1982 two alternative methods of production development exist: using the knowledge of genetics (selection of local breed and cross them with exotic breeds) and improvement of environmental conditions (management, feeding and health care). Ethiopian Sheep and Goat Productivity Improvement Program (ESGPIP) has imported Dorper sheep and Boer goat from South Africa for crossbreeding purpose to upgrading the productivity of local breeds in the country. In order to promote the merit of such crossbreeding activities it is important to have data on growth potential characteristics and evaluate animals accordingly. Performance evaluation of pure and crossbred lambs will provided vital information that demonstrates opportunity for the genetic improvement of production performance under specific feeding and management conditions [6].
Accordingly, the objectives of this study was to apply linear mixed model for evaluating body-weight gain of pure and crossbred lambs and test their difference in body-weight gain.
Materials and Methods
Description of the study area
This study was conducted on station at Sirinka agricultural research center which is located 508 km away from Addis Ababa. The site is located at an altitude of 1850 m.a.s.l and at 110 451 0011N and 390 361 3611E. The rainfall pattern is bimodal, with two-rainfall season, belg (February - April) and meher (July – November) and the mean annual rainfall amount is on average about 950 mm. The area is a moderate warm temperature zone with mean daily temperature ranges from 16-21 °C.
Experimental animals and their feeding
Based on their blood-level, the experimental ram lambs for this study consisted of three breed-groups, i.e., I: pure (local) Central Highland Sheep (CHS), II: 50%CHS50%Dorper Sheep, and III: 75%CHS25%Dorper Sheep. For each of the three breed-groups, nine growing lambs were available. The pure CHS were purchased from the local markets in the study area. The 50%CHS50%Dorper were obtained from Sirinka agricultural research center farm and the 75%CHS25%Dorper were purchased from farmers participating in sheep and goat improvement program respectively.
The animals used were of similar size, young age and sound health conditions. The ages of the animals were obtained from farm record data of Sirinka agricultural research center while the remaining breed-groups age was estimated through interviewing farmers and observing dentition. The ages of the animals were thus in the range of 3 to 5 months.
Before the beginning of the experiment, animals were dewormed and sprayed against internal and external parasites and brought indoors after the pens had been properly washed and disinfected. They were individually housed in individual cages with removable feeders and water troughs.
Experiment animals had free access to water, and were allowed ad libitum intake of the native grass hay but with restricted amount of concentrate mixture considering 2% of their body-weight on dry matter basis which were adjusted every ten days following regular weight measurement of the animals. The native grass hays were chopped to pieces to encourage intake. Concentrate mixtures (i.e., noug seed cake, wheat bran, crushed sorghum grain and common salt with a proportion of 46%, 28%, 24% and 2%, respectively) was formulated before the start of the experiment by using Winfeed 2.84 software program and it was given twice daily at 0800 h and at 1400.
Table 1: Experimental breed-groups.

The experiment lasted for 90 days from July to October 2011. The table below describes these arrangements (Table 1).
Body-weight measurements
Following a 14-day acclimatization period, each growing lamb was weighed at the beginning of the experiment (initial bodyweight, IBW) and every successive ten-day thereafter. All lambs were weighed during morning hours after overnight fasting using suspended weighing scale having sensitivity of 50 grams.
Statistical Methods
SAS-program version 9.4 (SAS 2015) was used for all statistical analysis in this study.
Modelling approach
In this study, for analyzing the data on repeated records of bodyweight gains using linear mixed model, dependencies between repeated body-weight gains of a lamb have to be modelled. In order to realize this, lamb-specific random regression coefficients al0 – aln are introduced.

In model (1), all random effects are assumed to be normally distributed with a mean value of 0. Additionally, an assumption that all random effects associated with different lambs are generally independent of each other is made. By using the covariate matrix Al and the residual variance between body-weight gains of a lamb at time point t1 and t2:

Furthermore, all lambs in model (1) were treated as unrelated. For the vectors of the random regression coefficients of two lambs l and l*, it follows: cov (al, a´l*) = 0. The following SAS syntax was used to analyze the data with model (1):
PROC MIXED DATA=SHEEP METHOD=REML;
CLASS Breed Diet DT LAMB;
MODEL BWG = Breed DT IBW X1(Breed) X2(Breed) ...Xn(Breed) /NOINT;
RANDOM INT X1 X2 ... Xn/SUBJECT=LAMB TYPE=UN;
If n=0 in model (1), this means that one random effect per lamb is included and that the covariance function in (2) is of the form:

Here, 12 1 2 δ = 1 for t = t ; in all other cases, 0 12 δ = . Because of the above formula, all pairs of measures on the same lamb have the same correlation. Thus, the correlation between two measures at time t1 and t2 is:
Up this point, the covariance structure has been modelled by using lamb-specific random effects only. In the following, the residual covariance structure of model (2) will be extended further [7,8].
Let e(t) be the residual effect of a lamb for the body-weight gain on days-on-test of t. Then, let us use the following model: e(t) = e1(t) + e2(t). Here, e1(t) stands for the component of the serial correlation between repeated measurements for a lamb,e2(t) denotes the component for the residual error with an equal variance for all measurements. The residual effects for the latter are assumed to be independent and identically distributed. The model for the serial covariance structure is completed by adding a distance correlation function g. This function is selected in such a way that all residual effects e1(t) of a lamb have the same variance and that the correlation between two such effects is always positive but decreases monotonically with increasing temporal distance between two measurements for the same lamb. Then, the variance and covariance function of the residual effects of a lamb are given by:
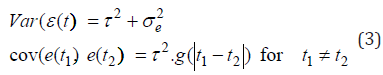
Where, d = is the temporal distance between two measurement points, frequently used functions like the Gaussian function and the exponential serial correlation function will give the equation below:

The two functions are always positive and decrease monotonically with increasing temporal difference d. They are continuous at d = 0 and meet the requirement that g(0) = 1. In (4), r is an unknown parameter greater than 0. The smaller the value of r, the stronger the function g decreases with increasing value of d. Model (1), extended with the exponential correlation function, can be fitted with the following SAS statements:
PROC MIXED DATA=SHEEP METHOD=REML;
CLASS Breed DT LAMB;
MODEL BWG = Breed DT IBW X1(Breed) X2(Breed) ...Xn(Breed) / NOINT;
RANDOM INT X1 X2 ... Xn/SUBJECT=LAMB TYPE=UN;
REPEATED/SUBJECT=LAMB TYPE=SP (EXP) (DT);
Once the optimum model for the covariance structure is found, then tests of fixed effects for the different breed-groups can be done with the help of t- and F-tests (Tukey-Tests) [9-12].
Results and Discussion
Descriptive statistics
A summary results of the data on body-weight gain over the different sub-periods, i.e. from day 10 (t10) up to day 90 (t90) for the different breed-groups, is given in the table below (Table 2).
With repeated measures data, an obvious first statistics to consider is descriptive statistics results of body-weight gain of animals against time. Table 2 shows among others the means and standard deviations for individual ages at recording in 10-days intervals. Generally, the mean and standard deviations of the data in the above table increased slowly and steadily with age. This pattern of increase in mean and standard deviation over time could be explained in terms of the variation in growth rates of the different breed-groups [13-15].
Table 2:Experimental breed-groups.

Moreover, initial body-weight (IBW) of 50%CHS 50%Dorper (17.9kg) and that of 75%CHS25%Dorper (20.25kg) sheep was significantly higher than (P< 0.05) CHS (14.41kg) (result not shown here). This indicates the fact that the crossbred animals appeared at around similar age to have heavier live weight.
Even though numerically the 75%CHS25%Dorper sheep had higher IBW than the 50%CHS50%Dorper this difference is not statistically significant. One reason for the lower IBW performance of the 50CHS50%Dorper sheep in comparison to the 75%CHS25%Dorper could be the fact that the 75%CHS25%Dorper crossbreds were better managed by the farmers participating in sheep and goat improvement program from which these animals were obtained while the 50CHS50%Dorper animals that were obtained from Sirinka agricultural research center farm that suffered drought and shortage of feed problems during preweaning stage of animals.
Linear Mixed Models
The table below gives the results found for the different models tested to find an optimum model. The summarized models (M1, …, M4) given in the table below are analysis results with correlated residual effects and heterogeneous variance assumptions (Table 3).
Table 3: Interaction effects of N rates and time of application on fresh rhizome yield (Kg ha-1) at Tepi, Southwest Ethiopia in 2016/17.

As can be seen from the above table, four models, i.e. M1, …, M4, are given in increasing order of complexity. According to the Δ-2logL, ΔAICC and ΔBIC values given for the four models, M1 is found to be the least chosen, as it has the largest values for Δ-2logL, ΔAICC and ΔBIC. A substantial decrease in the values of Δ-2logL, ΔAICC and ΔBIC can be seen for the other models (M2, M3 and M4), where the decrease in M4 is the highest so that this model is chosen to be the optimum model.
The models M1, …, M4 can be seen as special cases of M4, which can be found through substituting one or more effects in M4 by zero. The following SAS statement was used to analyze the data with linear mixed model (4):
PROC MIXED DATA=LAMB2 METHOD=REML;
CLASS DT LAMB;
MODEL BWG = Breed DT IBW X1*Breed / NOINT;
RANDOM INT X1/SUBJECT=LAMB TYPE=UN;
REPEATED/SUBJECT=LAMB TYPE=SP(EXP)(DT);
RUN;
Usually, when using PROC MIXED, the variation between animals is specified by the RANDOM statement, and covariation within animals is specified by the REPEATED statement.
Comparison of breed groups on body weight gain
The model comparison of the different breed-groups on body-weight gain is presented in Table 4. The corresponding SAS statement for the implementation of this comparison is given by:
LSMEANS BREED / PDIFF ADJUST=TUKEY;
The table below shows least square means of the breed-groups and their significance tests (Table 4).
Table 4: Interaction effects of N rates and time of application on fresh rhizome yield (Kg ha-1) at Tepi, Southwest Ethiopia in 2016/17.

As can be seen from Table 4, the CHS show a significantly lower body-weight gain than the two crossbreds. However, the difference in body-weight gain between the two crossbreds (i.e. 50%CHS50%Dorper and 75%CHS25%Dorper) was not significant; there is an indication of compensatory growth for 50%CHS50%Dorper. This increased body-weight gain of the crossbreds in comparison to CHS is justified by the higher bloodlevel of the crossbreds and their ability to efficiently utilize the feeds as compared to the pure CHS. This suggests the impact of cross breeding on increased body-weight gain and thereby increasing meat production of growing lambs for market supply.
Conclusion
• From an implementation point of view, it can be seen that a significantly higher body weight gain has been achieved for the crosses than the pure central highland sheep. In this regard as raising the management level could provide a difference I bodyweight gain between the two crossbreds.
• The increased body weight gain of the crosses has an impact on the profitability of sheep production on the local market or for export.
Acknowledgement
None.
Conflict of Interest
No conflict of interest.
References
- Faostat 2010.
- Ameha Sebsibe (2008) Sheep and Goat Meat Characteristics and Quality. Alemu Yami, RC Merkel (eds.), Sheep and Goat Production Handbook for Ethiopia. Ethiopian Sheep and Goat Productivity Improvement Program (ESGPIP), Addis Ababa, Ethiopia. Pp. 345.
- Zinash S, Aschalew T, Alemu Y, Azage T (2001) Status of Livestock Research and Development in the Highlands of Ethiopia. P.C. Wall (end), Wheat and Weed: Food and Feed. Proceedings of Two Stockholders Workshop.
- Markos Tibbo (2006) Productivity and Health of Indigenous Sheep Breeds and Crossbreds in the Central Ethiopian Highlands. Doctoral Dissertation, Swedish University of Agriculture, Uppsala.
- Solomon Abegaz (2002) Genetic Evaluation of Production. Reproduction and Survival in a Flock of Ethiopian Horro Sheep, Doctoral Dissertation, University of the Free State, Bloemfontein.
- Shrestha JNB, MH Fahmy (2005) Breeding goats for meat production: A review (1) Genetic resources, management and breed evaluation. Small Ruminant Research 58: 93-106.
- Lesaffre E, Todem D, Verbeke G, Kenward M (2000) Flexible modelling of the covariate matrix in a linear random effects model. Biometrics 42: 807-822.
- Verbeke G, Lesaffre E, Brandt LJ (1998) The detection of residual serial correlation in linear mixed models. Statistics in Medicine 17: 1391-1402.
- Fai AHT, Cornelius PL (1996) Approximate F-Tests of multiple degree of freedom hypotheses in generalized least squares analyses of unbalanced split-plot experiments. Journal of Statistical Computation and Simulation 54: 363-378.
- Giesbrecht FG, Burns JC (1985) Two-stage analysis based on a mixed model: large-sample asymptotic theory and small-sample simulation results: Biometrics 41: 477-486.
- Kenward MG, Roger JH (1997) Small sample inference for fixed effects from restricted maximum likelihood. Biometrics 53: 983-997.
- Spilke J, Piepho HP, Hu X (2005) A simulation study on tests of hypotheses and confidence intervals for fixed effects in mixed models for blocked experiments with missing data. Journal of Agricultural, Biological and Environmental Statistics 10: 374-389.
- Momani SM, RT Kridli, AY Abdullah, M Malinová, S Sanogo, et al. (2010) Effect of crossbreeding European sheep breeds with Awassi sheep on growth efficiency of lambs in Jordan. Agricultura Tropica Et Subtropica 43(2): 127-133.
- SAS Institute Inc (2015) SAS/ STAT Software Release. User’s Guide, Version 9.0.
- Singh RN, RM Acharya (1982) Genetic and environmental trends of milk production in a closed flock of Beetal goats. Journal of Dairy Science 65: 2015-2017.
-

This work is licensed under a Creative Commons Attribution-NonCommercial 4.0 International License.


