 Review Article
Optimization and Microstructural Evaluation of Processing Parameters on the Density and Surface Hardness of Dual Phase Steel
Olorundaisi Emmanuel1, Onas Ikele2, Tamba Jamiru3, Adegbola Taoreed Adesola4, Juwon Fayomi5, Bryan Akhiwu6 and Beck Akhiwu 7
1Department of Mechanical Engineering, Mechatronics, and Industrial Design, Tshwane University of Technology Pretoria, South Africa.
23950 Ashburnham Drive #20, TX 77082 Houston, Texas
3Department of Mechanical Engineering, Mechatronics, and Industrial Design, Tshwane University of Technology Pretoria, South Africa.
4Department of Mechanical Engineering, Mechatronics, and Industrial Design, Tshwane University of Technology Pretoria, South Africa.
5Department of Chemical, Metallurgical and Materials Engineering, Tshwane University of Technology, P.M.B. X680, Pretoria, South Africa
6Department of Computer Science and Software Engineering, University of Wisconsin, Platteville, Wisconsin, USA
7University of Idaho, Kimberly research and extension center, USA
Olorundaisi Emmanuel, Department of Mechanical Engineering, Mechatronics, and Industrial Design, Tshwane University of Technology Pretoria, South Africa.
Received Date:March 16, 2021; Published Date: April 05, 2021
Abstract
The body frame of the automobile is an essential and critical component of a car. This part when subjected to extreme impact, could lead to mechanical failure, which could endanger human life. The effectiveness of the material in safeguarding human life can be influenced by both the selection of materials and the manufacturing process. Dual Phase (DP) steel of 600 grades was developed from low carbon steel (0.13wt) at different temperatures and holding time using bitumen as the quenching medium. The material was developed with improved mechanical properties to withstand impact due to accidents. The influence of processing parameters on the surface hardness and density was analyzed using response surface methodology to develop a prediction model.
The relationship existing between density and the hardness of Dual Phase steel was established in this study. It was discovered that the increase in density resulted in an improvement of the surface hardness as a result of the reduction in pores. The SEM micrographs revealed the extent of the dispersion of the ferrite and martensite as a function of the holding time. To ascertain the experimental outcome, a model on a statistical four-level and two factorial design method was carried out. Based on the statistical analysis, surface hardness (SH) shows a correlation coefficient of R2= 0.9522 while Density gave R2= 0.9859, P-values obtained were less than 0.1 and there is only a 0.01% chance that the F-values obtained could occur due to noise.
Keywords:Microstructure; Dual Phases Steel; Mechanical Properties; Low carbon steel.
Introduction
Over the years, Dual Phase (DP) steels have become a sort after material by the automobile industries, where safety, lightweight and energy-saving materials are principal [1]. DP steel is predominantly made up of dispersed martensite grain within the ferrite matrix [2]. Its wide acceptance could be attributed to its economic value, high tensile strength, improved formability, continuous yielding behavior, crashworthiness, high strength-ductility, and high work hardening rates [3-5].Hence, giving it an edge over conventional steel for the manufacturing industries and welding purposes [6,7]. DP steel has a tensile strength of 500 – 1200 MPa and a total elongation of 12-34% [8].
The evolution of the microstructure of DP steel is a function of the heat treatment. The ferrite-martensite phase is formed because of the full transformation of austenite during heat treatment. To effect this change, temperature (T) and holding time (HT) plays an important role [2,3,9]. Other important factors influencing the mechanical properties of DP steels are quenching medium, cooling rate, morphology (grain size and pattern), and the chemical composition of the material [10]. DP steel with an arrangement such that the martensitic phase stand in isolation within the ferrite’s matrix is said to possess a lesser strength as compared to a chain-like arrangement within the ferrite [8]. However, a finer grain has better mechanical properties than a coarse grain [6,11,12].
The amount of martensite formed is a function of the volume of austenite being transformed. However, the higher the T, the higher the austenite formed, thereby, forming more volume of martensite when cool [13]. The ductility of DP steel is determined by the amount of ferrite present in the steel, while martensite volume influences the surface hardness (SH) of the material [13]. Several researchers have investigated the microstructure and mechanical properties of DP steels, but little has been done on the optimization of the process parameters and establishing a relationship between the SH and density (DS) [4,14–17]. In this study, we, therefore, look at the relationship existing between SH and density. Using the userdefined design of response surface methodology (UDD- RSM), the process parameters (T and HT), were optimized, to enhance the mechanical properties of DP steel.
RSM is used to develop a mathematical model using a statistical technique of some experimental designs. To develop mathematical models with linear, quadratic or interaction terms for optimum performance from giving factors and response variables [18]. Therefore, using RSM, a predicting model was developed, using temperature, and holding time as the model variables. The build-up information for the model is represented in Table 1. To establish this fact, an experiment based on a statistical four-level two factorial design method was carried out. The optimum operating parameters were predicted using the user-defined design (UDD) under RSM.
Table 2 shows the coded and actual operating conditions of the factors. The experimental results and statistical analysis data were analyzed using analysis of variance (ANOVA).
Table 1:Buildup Information for RSM Model.

Table 2:Coded and Actual Operating Conditions of the Factors.

Modeling and Optimization
Design of Experiments
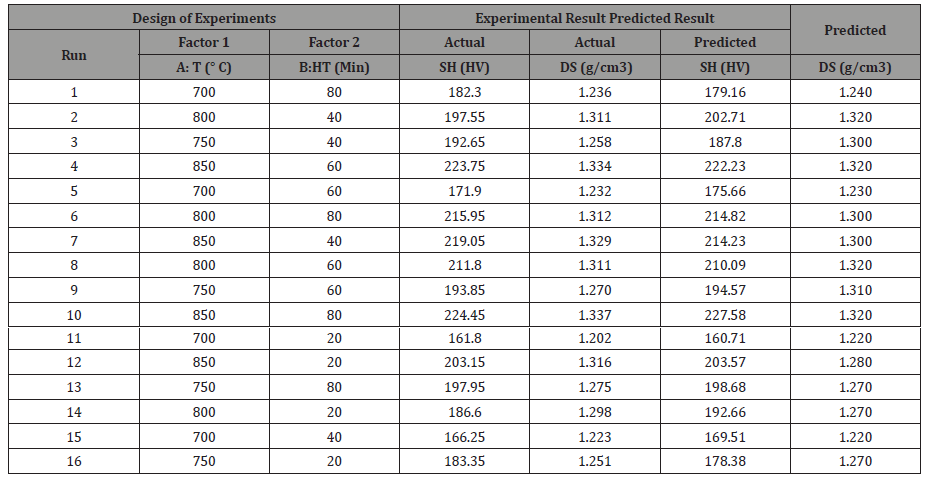
The experimental design for the process for optimum mechanical properties of DP steel was carried out using UDD-RSM. This was done to optimize various parameters needed to improve its mechanical properties. The relationship existing between the responses (SH and DS) and independent variables (T and HT) as well as to optimize the relevant conditions of variables to predict the best value of responses were assessed using RSM. The experiments were designed based on the experimental design technique that has been proposed by UDD. Two factors-four levels UDD was applied, and a total of 16 experimental runs were obtained, using Design Expert 11 software as shown in Table 3 and a 95% confidence interval. The experimental results and statistical analysis data were analyzed using analysis of variance (ANOVA). Since the number of levels is just four, the appropriate model to adopt is the secondorder polynomial model given in equation (1) [19,20].

Table 3:Design of Experiments, Response and Prediction Table.
Response Surface Modeling (RSM)
A total of 16 runs of the UDD experimental design and response was used to evaluate levels of factors and the degree of their interactions on the mechanical properties of DP steel. To achieve a comprehensive optimization of these operating parameters, the problem was further studied by UDD. The two parameters (T and HT), were coded as A and B. The ranges of these parameters were determined according to the simulation results in the section Simulation Results. Four coding levels were set for each variable, the values of which are listed in Table 2. The SH and DS were set as the response. The data in Table 3 were regressed by Design Expert 11.0 to get an equation for the coded and actual values. Using a statistical model approach from the analysis of variance (ANOVA) a mathematical model was obtained. The model established the relationship between the two operating parameters (T and HT) and the predicted responses (SH and DS). The regression from the analysis of variance provides an extensive understanding of the relationship between the mechanical properties of DP steel and its operating parameters. The test conducted explained the significance of the individual model coefficient, regression model and lack of fit. These parameters are used to determine the effectiveness of the model and its predictive ability.
Material and Heat Treatment
Table 4 presents the chemical analysis of the as-received sample. The as-received sample was wire cut to 17 at a dimension of 2 x 10 mm before heat treated. Using the DOE obtained, the experiments were performed, at a holding time of 20, 40, 60, and 80 minutes. The prepared samples were austenitized by heating to an Intercritical annealing temperature of 700oC, 750oC, 800oC, and 850oC and quenched rapidly in bitumen for 10 minutes, followed by air cooling at room temperature for the complete removal of any traces of retained austenite and residual stresses. While the last sample was used as a control, to evaluate the changes that occur in the heat-treated ones.
Table 4:Chemical analysis of the low carbon steel.

Struers CitoPress-1 Machine was used to hot mount the prepared samples, followed by grinding and polishing using Struers TegraPol-11 550 Machine, with a disc grade of 90, 220 and 330 in successions. The etching of the samples was carried out using a 3% Nital. The prepared sample’s surface was then placed under an Olympus microscope to capture the microstructure. The microhardness was done using the Vickers Microhardness Tester with a diamond indenter. The samples were indented 5 times for 15s each with a load of 500 gf. until a permanent indentation was achieved. After which the average mean was taken as the hardness result.
Model Adequacy Checking for Surface Hardness

The adequacy of the model is an integral part of this research, this is necessary to ensure the fitted model and it provides an adequate approximation of the real system. By establishing the adequacy of the model, Figure 1 shows the normal probability plot of the studentized residuals, for SH. From the result obtained it was observed that the points follow a straight line, which indicates that the data is normally distributed [21].
Interaction of Variables on the Surface Hardness
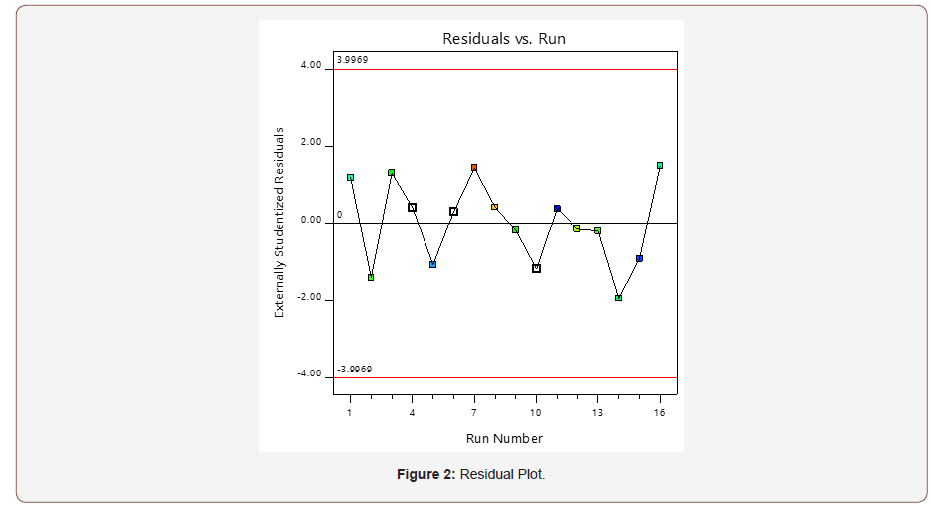
The interaction between the variables used in improving the mechanical properties of DP steel was verified to ensure the fit of the model. The residual versus run plots in Figure 2, shows if the design points are within the control limit for the model to be valid. The red lines indicate the control limits from -3.9969 to 3.9969, and it would be observed that the design points are within the control limit.
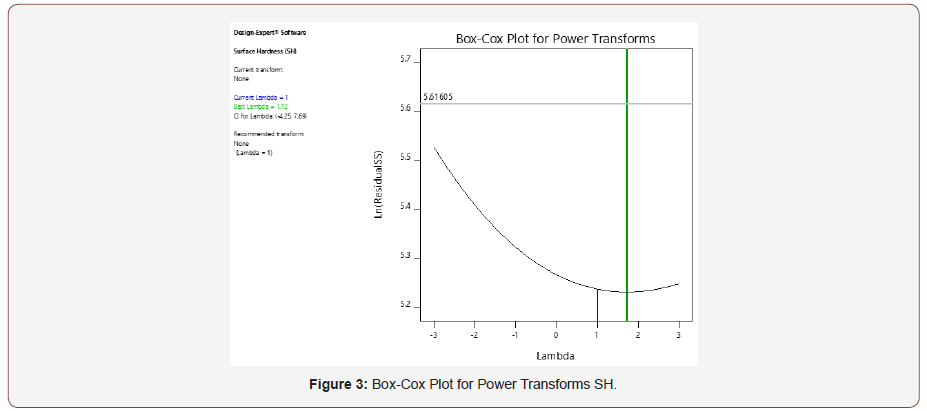
The Box-Cox represented in Figure 3 shows the logarithm of the residual sum of square (SS) against λ. The lambda value indicates the power to which all data should be raised, which must lie between the low confidence interval (Low-CI) and the high confidence interval (High-CI) [22]. For SH, the current lambda (λ) is 1 and it lies close to the best lambda value of 1.72 and it is between the Low-CI (-4.25) and High-CI (7.69). Thus, no transformation of the model is required.
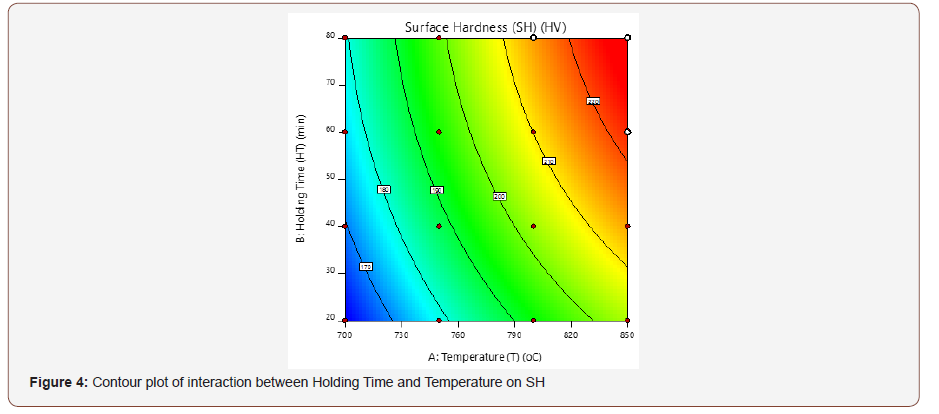
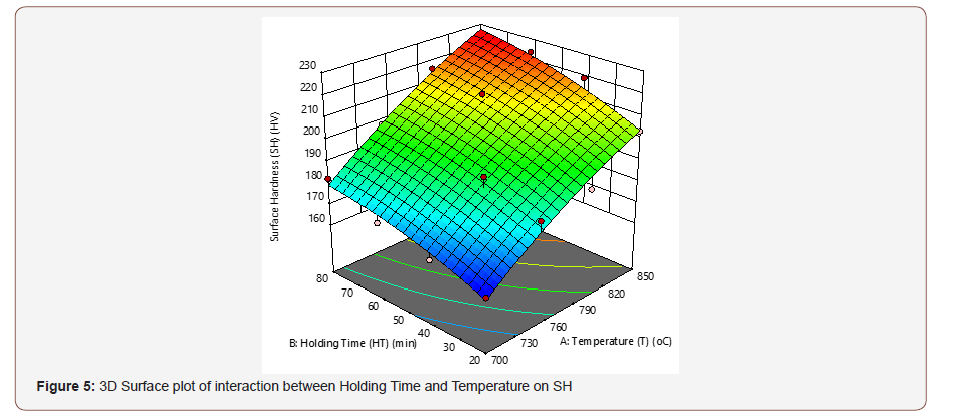
Figures 4 & 5 show the contour and the 3D plot for the interactive effects of T and HT on the SH, at a design point above the predicted value. The contour pattern describes the relationship between the factors, for a circular pattern, this tends to suggest an independent factor while an elliptical pattern indicates an interaction between the variables [23,24]. The surface response graph shows the optimum process parameters that produce a maximum or minimum value of the response [25]. In this present work, the optimum SH was observed as the T and HT increases. The shape of the contour tends to be elliptical, which indicates an interaction between the factors (T and HT).
Development of Regression Model Equation for Surface Hardness
The constant in equation 1 was determined using the design matrix of the 16 experimental runs alongside the coded factors for each variable. A quadratic model for SH was used by the software for the response. The parameters were coded with four coding levels for each variable, as shown in Table 2. Table 4 data were regressed by Design Expert 11.0 to develop a mathematical model for the coded and actual values. Second-order polynomial was used to correlate the response and variable values for SH. The final equations in terms of coded and actual factors are represented in equations 2 and 3.
SH= +199.55 + 22.82A + 10.61B + 1.39AB - 3.80A2 - 2.99B2 (2)
SH= -444.54250 + 1.32164T + 0.208056HT + 0.000617T * HT -0.000676T2 -0.003320(HT)2 (3)
Where
i. A represents the coded value for temperature.
ii. B represents the coded value for holding time.
iii. T represent Temperature.
iv. HT represents the Holding Time.
v. SH represents the Surface hardness.
The positive sign in the equations indicates synergy effects while the negative signs imply an antagonistic effect. Also, the positive effect of the factors implies that the response improved with increased in the factor level, while the negative implies that no improvement as the factor level increase [26]. The coefficients with one factor of T and HT represent the effect of that factor. The equations can be used to make predictions about the response for a given level of each factor. By default, the equation in terms of coded factors at the high levels of the factors is coded as +1 and the low levels are coded as -1, while for actual factor the levels are to be specified in the original units for each factor [27]. The coded equation is useful for identifying the relative impact of the factors by comparing the factor coefficients. While the actual equation cannot be used because the coefficients are scaled to accommodate the units of each factor and the intercept is not at the center of the design space [28].
Model Validation for Surface Hardness
Table 5 shows the model validation table. The value of R2, Adjusted R2 and standard deviation obtained are used to validate the accuracy of the developed model. The model is said to be valid if the difference between the Predicted R2 and Adjusted R2 is less than 0.2, and if the Adeq Precision value is greater than 4. The value of R2 described the significance and the acceptability of the developed model while the value of Adeq precision is the signal to noise ratio. The result obtained (Table 5), indicates that the model is valid and can be used to analyze the design space.
Table 5:Model Validation.

ANOVA and Statistical Significance of the Model for Surface Hardness
The integrity and significance of the model were justified using ANOVA. For a P-values of less than 0.1, it implies that the model term is significant. In this study, SH, show a P-values of less than 0.0500. In this case of SH; A, B, are significant model terms. The Model F-value for SH is 60.71, which implies that the model is also significant. There is only a 0.01% chance that the F-values obtained could occur due to noise. Tables 6 shows the statistical analysis of the model, where the factor coding is coded, and the sum of squares is Type III Partial.
Table 6:ANOVA Table.

Model Adequacy Checking for Density
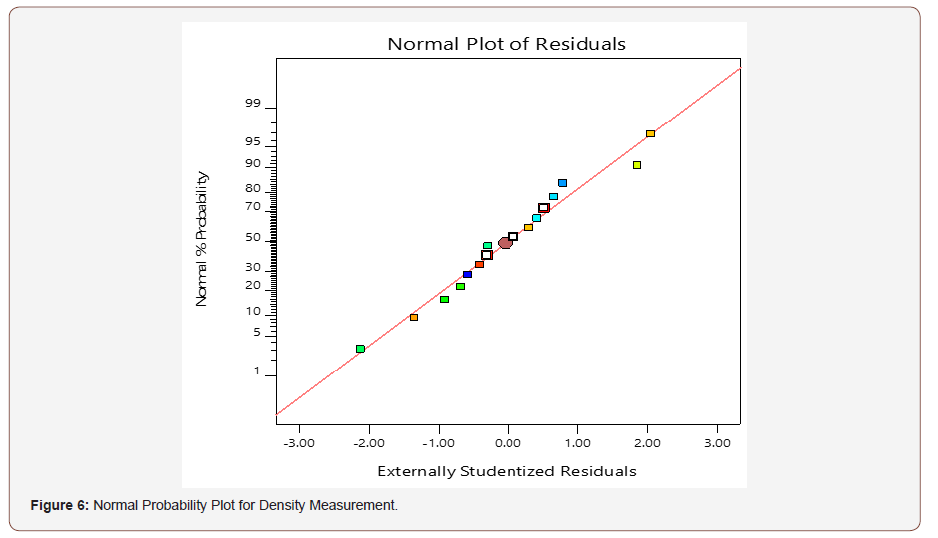
The adequacy of the fitted model for density measurement was established using the normal probability plot of the studentized residuals as shown in Figure 6. From the result obtained it was observed that the points follow a straight line, which indicates that the data is normally distributed.
Interaction of Variables in Density Measurement
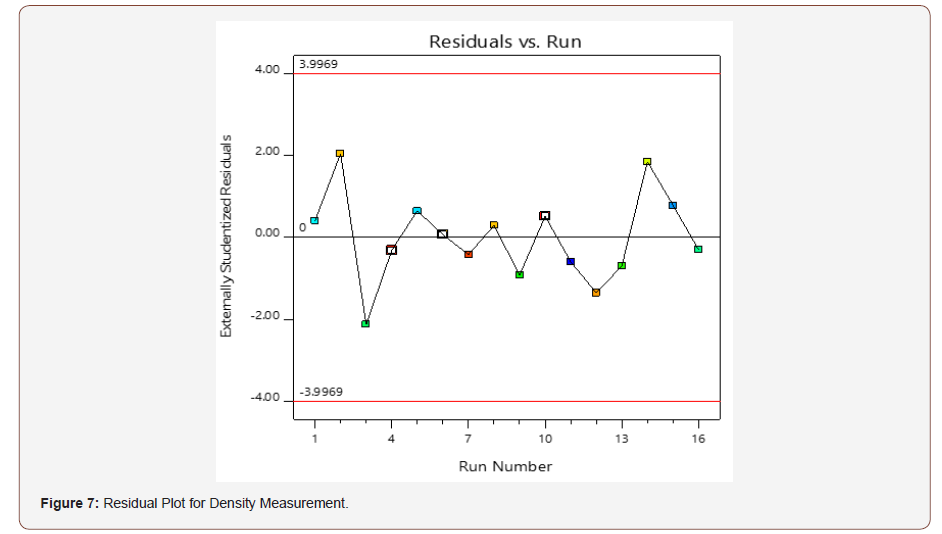
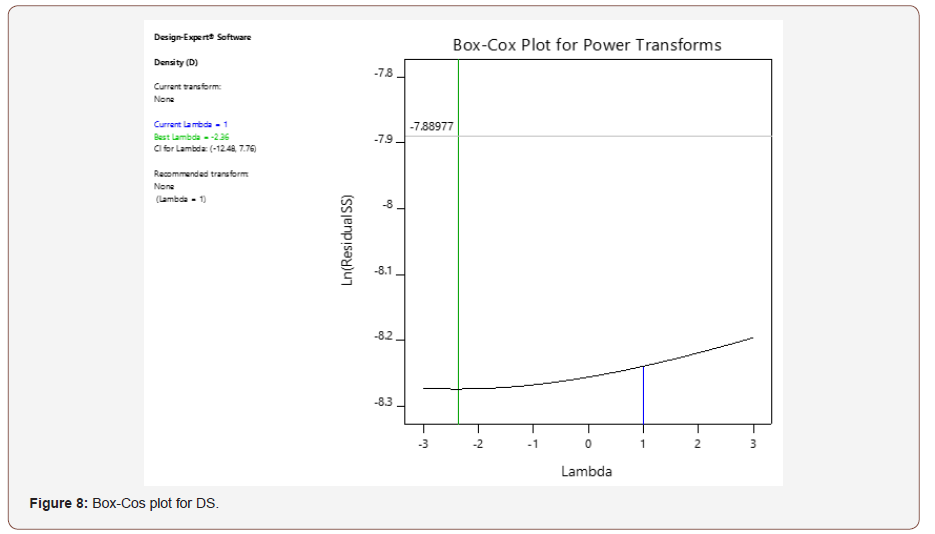
The residual versus run plots in Figure 7, shows that the design points are within the control limits from -3.9969 to 3.9969. Therefore, the model is valid. The Box-Cox is a measure of the logarithm of the residual sum of square (SS) against λ. This is represented in Figure 8. The current lambda (λ) in the measurement of density is 1 and it lies close to the best lambda value of -2.36 and it is between the Low-CI (-12.48) and High-CI (7.76). Thus, no transformation of the model is required.
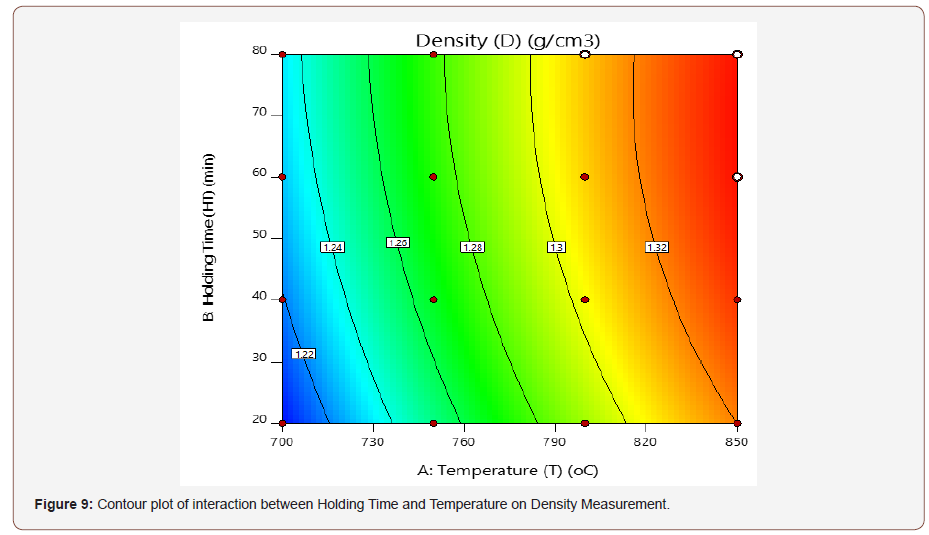
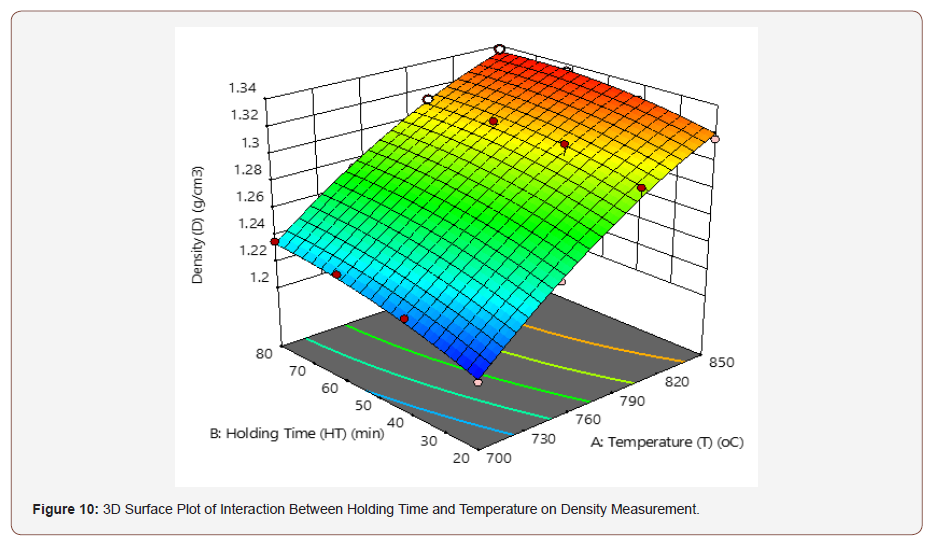
Figure 9 and 10 shows the contour and the 3D plot for the interactive effects of T and HT on the density, at a design point above the predicted value. In this present work, the optimum density was observed as the T and HT decreases. The shape of the contour tends to be elliptical, which indicates an interaction between the effect of the factors (T and HT).
Development of Regression Model Equation for Density Measurement
Table 3 data were regressed by Design Expert 11.0 to develop a mathematical model for the coded and actual values for the DS. Second-order polynomial was used to correlate the response and variable values. The final equations in terms of coded and actual factors are represented in equations 4 and 5
ρ=+1.29+0.0543A+0.0113B-0.0038B-0.0108A2-0.0058B2 (4)
ρ=-0.527325+0.003792T+0.002312HT-1.67*10-06T*HT- 1.925*10-06T2-6.406*10-06(HT)2 (5)
i. A represents the coded value for temperature.
ii. B represents the coded value for holding time.
iii. T represent Temperature.
iv. HT represents the Holding Time.
v. ρ represents the Density.
Model Validation for Density Measurement
The value of R2, Adjusted R2 and standard deviation obtained are used to validate the accuracy of the developed model. The result obtained in Table 7, indicates that the model is valid and can be used to analyze the design space, having gotten a difference of less than 0.2 between Predicted R2 and Adjusted R2, and an Adeq Precision value greater than 4.
Table 7:Model Validation.

ANOVA and Statistical Significance of the Model for Density Measurement
The integrity and significance of the model were justified using ANOVA. The P-value obtained for density was observed to be less than 0.0500, indicating that the model terms are significant. Hence, for density measurement, A, B, A2 are significant model terms. The Model F-value of 211.52 indicates the significance of the model. There is only a 0.01% chance that an F-value this large could occur due to noise. Table 8 shows the statistical analysis of the model, where the factor coding is coded, and the sum of squares is Type III Partial.
Optimization Studies
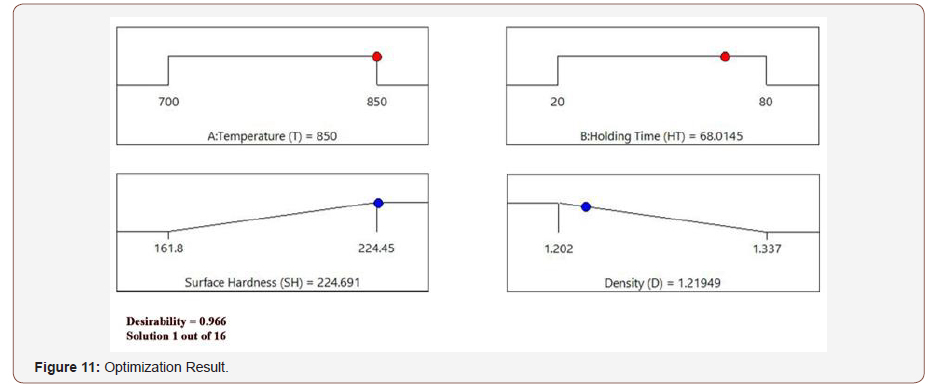
Optimization was carried out to maximized material strength, with the selected range of parameters (T and HT). At desirability of 0.966, out of the 16 runs obtained for optimum covering criteria, the first was selected as the best desirability for SH and DS, as represented in Figure 11. Table 9 shows the constraints measured applied.
Table 8:ANOVA Table.

Table 9:Constraints Measure for Optimization.

Microstructural and Mechanical analysis of DP Steel
Microstructural and Mechanical analysis of DP Steel
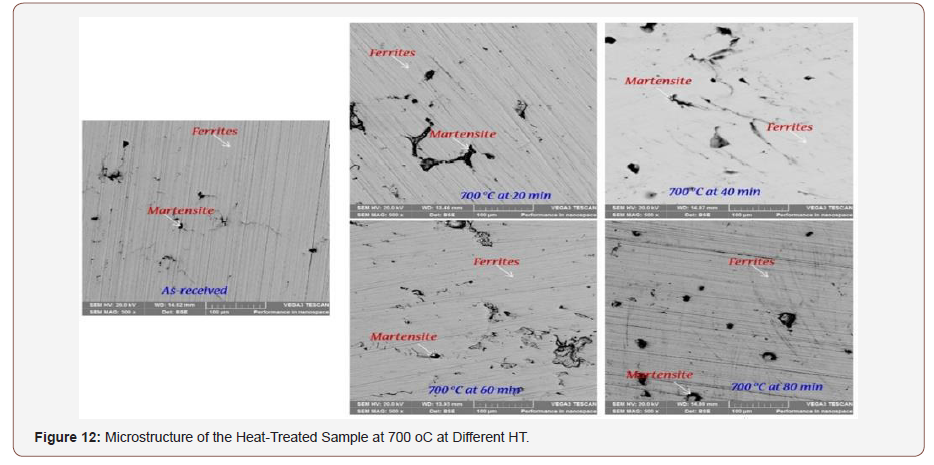
Figure 12 represents the microstructure obtained for different dual phase conditions, at an Intercritical annealing temperature of 700 oC and held for 20 min, 40 min, 60 min, and 80 min. At a holding time (HT) of 20 min, the sample shows a finer and lesser dark region (martensite phase). As the HT increases, there is a considerable increase in the grain size of austenite formed, the amount and size of martensite formation also increases [28.29]. The distribution pattern of martensite within the ferrite matrix is in isolation. The higher percentage volume of austenite formation transforming into martensite could be observed and a considerable reduction in the ferrite matrix. The as-received sample shows a typical structure of hypo-eutectoid steel with a larger region of ferrite and dispersed martensite which makes it softer than the austenitized samples.
Hardness Behavior of DP steel at Intercritical Annealing Temperature.
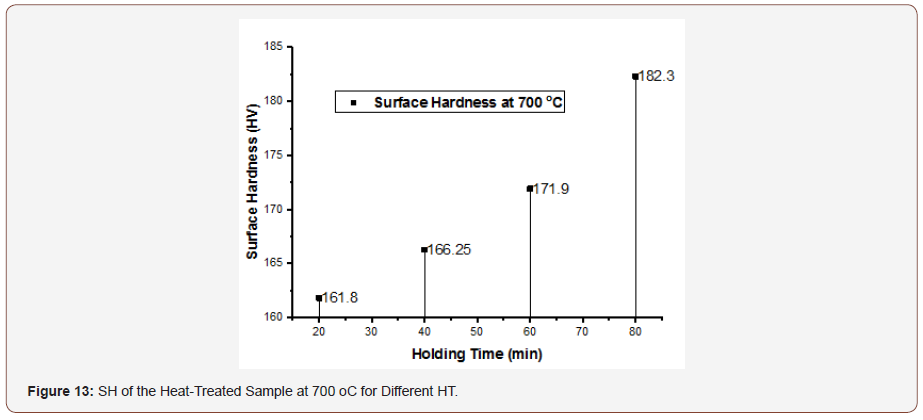
Table 10 presents the mechanical properties of DP steel at an Intercritical annealing temperature of 700oC and held for; 20, 40, 60 and 80 min. It can be seen from the table that, as the HT increases, there is a corresponding increase in the SH. From the SEM result in Figure 12, the volume fraction of martensite increases as the HT increase and this is directly proportional to the hardenability of the material. Figure 13 shows the hardness variation. It was observed that as the HT increases the hardness also increases.
Table 10:Mechanical Properties of Low Carbon Steel Quenched at an Intercritical Annealing Temperature of 700° C.

Density Behaviour of DP Steel at Intercritical Annealing Temperature
From the result of Table 10, it was observed that as the HT increases the density also increases. This implies that as the HT increases, the rate of diffusion is being enhanced hence pores are rapidly closing, leading to porosity reduction and microstructure refinement. Therefore, as the T and HT increases, there is a corresponding increase in weight and improvement in the strength, as represented in Figure 14.

Validation of Model with Experimental Work
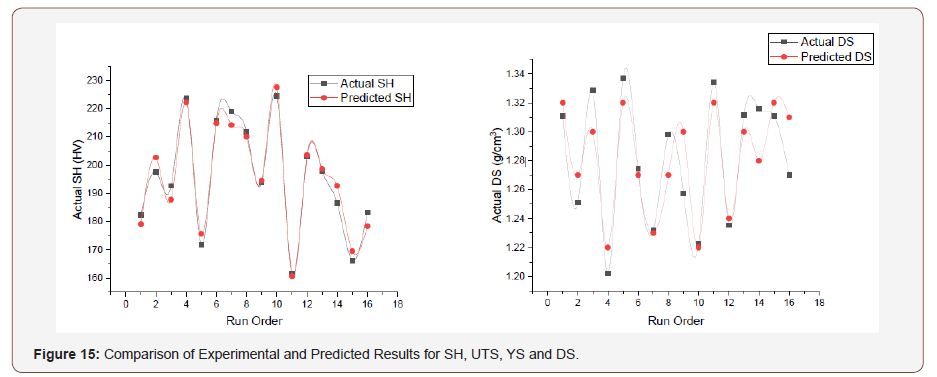
The model for SH and DS was validated by looking at the relationship between the actual and the predicted response. The result from Table 3 was used to plot a variation between the response (actual) and the predicted values.
Figure 15 shows a similarity in the pattern of the plots. This implies that there is an agreement between the experimental and the model.
Conclusion
The heat treatment was effectively used as a means of altering the microstructure and mechanical properties of the Dual Phase steel at an annealing temperature of 700oC, 750oC, 800oC, 850oC and at a holding time of 20, 40, 60, 80 min. After successful characterization and optimization, the DP steel of grade DP 600 was improved. This class of DP steel can be used for car body frame, Floor Panel, Hood Outer, Body Side, Outer, Cowl, Fender, Floor Reinforcements, roof rail, roof bow, and cross member. From literature, DP 600 has YS of 340 MPa, UTS of 580 MPa and YS/UTS ratio of 0.58 [30]. Table 11 shows 10 out of the 16-experiment work that falls within the DP 600.
Table 11:DP 600.

To improve the mechanical properties of DP steel, the operating parameters (T & HT) were optimized, and a predicting model was developed, with a minimum experimental run of 16 using RSM; this was efficiently done. The results obtained from the Model; F- value, P-value, R2, Predicted R2, Adeq Precision established the significance of the model developed. Therefore, comparing the experimental and the predicted values, the accuracy of the model developed was established and the following conclusions are drawn from the experimental work.
i. The lower holding time of the dual phase steel shows lower strength, hardness when compared to that of higher holding time, for each of the temperatures investigated.
ii. The distribution pattern of the martensite within the ferrite matrix influences the mechanical properties.
iii. An increase in temperature and holding time causes a proportional increment in the density of Dual Phase steel. As the temperature and holding time increase, it was observed that the microstructure is being refined and there is a reduction in the pores.
iv. When density increases, the hardness also increases.
v. The microstructure of dual phase steel shows a dark region of martensite phases within the greyish ferrite matrix.
It could, therefore, be concluded that the mechanical properties of Dual Phase steels vary directly with the microstructure, a change in the structure influence its mechanical properties. From the observations above, the distribution pattern of martensite within the ferrite matrix plays an important role in the mechanical properties of Dual Phase steels.
Acknowledgment
We appreciate National Research Foundation (NRF) for providing grant for this research.
providing grant for this research.
No conflict of interest.
References
- Darabi A, Chamani HR, Kadkhodapour J, Anaraki AP, Alaie A, et al. (2017) Micromechanical analysis of two heat-treated dual phase steels: DP800 and DP980. Mech Mater 110: 68-83.
- Li Z, Wu D, Lü W, Yu H, Shao Z, et al. (2015) Effect of holding time on the microstructure and mechanical properties of dual-phase steel during intercritical annealing. J Wuhan Univ Technol Mater Sci Ed. 30(1): 156-161.
- Zuo X, Chen Y, Wang M (2012) Study on microstructures and work hardening behavior of ferrite-martensite dual-phase steels with high-content martensite. Mater Res 15(6): 915-921.
- Radwanski K, Kuziak R, Rozmus R (2019) Structure and mechanical properties of dual-phase steel following heat treatment simulations reproducing a continuous annealing line. Arch Civ Mech Eng 19(2): 453-468.
- Jamei F, Mirzadeh H, Zamani M (2019) Synergistic effects of holding time at intercritical annealing temperature and initial microstructure on the mechanical properties of dual phase steel. Mater Sci Eng A 750(February): 125-131.
- Alibeyki M, Mirzadeh H, Najafi M (2018) Fine-grained dual phase steel via intercritical annealing of cold-rolled martensite. Vacuum 155: 147-152.
- Xiong Z, Andrii K, Nicole S, Elena VP (2014) Effect of Holding Temperature and Time on Ferrite Formation in Dual Phase Steel Produced by Strip Casting. Mater Forum 38: 44-48.
- Xiong ZP, Kostryzhev AG, Stanford NE, Pereloma E V (2015) Microstructures and mechanical properties of DP and TRIP steels after laboratory simulated strip casting. Mater Des. 88: 537-549.
- Zeytin HK, Kubilay C, Aydin H (2008) Investigation of dual phase transformation of commercial low alloy steels: Effect of holding time at low inter-critical annealing temperatures. Mater Lett. 62(17-18): 2651-2653.
- Olorundaisi E, Jamiru T, Adegbola TA (2019) Mechanical and microstructural evaluation of dual phase steel, quenched in bitumen and water at an intercritical temperature: effect of holding time. Mater Res Express. 6(11): 115606.
- Zamani M, Mirzadeh H, Maleki M (2018) Enhancement of mechanical properties of low carbon dual phase steel via natural aging. Mater Sci Eng A. 734(May): 178-183.
- Wu S, Wang D, Di X (2019) Strength-toughness improvement of martensite-austenite dual phase deposited metals after austenite reversed treatment with short holding time. Mater Sci Eng A. 755(March): 57-65.
- Xiong Z, Kostryzhev AG, Zhao Y, Pereloma E V (2019) Microstructure Evolution during the Production of Dual Phase and Transformation Induced Plasticity Steels Using Modified Strip Casting Simulated in The Laboratory. Metals (Basel). 9(4): 449.
- Nikkhah S, Mirzadeh H, Zamani M (2019) Fine tuning the mechanical properties of dual phase steel via thermomechanical processing of cold rolling and intercritical annealing. Mater Chem Phys. 230(March): 1-8.
- Jadudoma R, Khumkoaa S (2015) A Study On Phase Transformation Of Hot Rolled Dual Phase Steel Using Deformation Dilatometer. J Eng Appl Sci. 10(7): 190-196.
- Gurumurthy BM, Sharma SS, Kini A (2018) Ferrite-Bainite Dual Phase Structure and Mechanical Characterization of AISI 4340 Steel. Mater Today Proc. 5(11): 24907-24914.
- Scott CP, Shalchi Amirkhiz B, Pushkareva I, Fazeli F, Allain SYP, et al. (2018) New insights into martensite strength and the damage behaviour of dual phase steels. Acta Mater. 159: 112-122.
- Atanas JP, Rodrigues C, Simmons RJ (2015) Lean Six Sigma Applications in Oil and Gas Industry: Case Studies 6(5):540-544.
- Raymond HM, Douglas CM, Christine MA C (2009) Response Surface Methodology. (3rd Edn). New Jersey: John Wiley & Sons, Inc, USA.
- Yang K, El-Haik B (2003) Design for Six Sigma: A Roadmap for Product Excellence.
- Khuri AI, Mukhopadhyay S (2010) Response surface methodology. Wiley Interdiscip Rev Comput Stat. 2(2): 128-149.
- Ramadan Z, Im IT (2019) Optimization of Operating Parameters in a Planetary CVD Reactor Using Response Surface Methodology. Silicon 11(4): 2067-2074.
- Montgomery D (2002) Design and Analysis of Experiments. In: Quality and Reliability Engineering International. (5th Edn). John Wiley and Sons, New York, United States of America, 18: 163-163.
- Shuster JJ (2007) Design and analysis of experiments. Methods Mol Biol 404: 235-259.
- Hou TH, Su CH, Liu WL (2007) Parameters optimization of a nano-particle wet milling process using the Taguchi method, response surface method and genetic algorithm. Powder Technol 173(3):153-162.
- Saldaña-Robles A, Guerra-Sánchez R, Maldonado-Rubio MI, Peralta-Hernández JM (2014) Optimization of the operating parameters using RSM for the Fenton oxidation process and adsorption on vegetal carbon of MO solutions. J Ind Eng Chem. 20(3): 848-857.
- Olorundaisi E, Jamiru T, Adegbola TA, Ogunbiyi OF (2019) Modeling and optimization of operating parameters using RSM for mechanical behavior of dual phase steels. Mater Res Express. 6(10):105628.
- Amuda MO, Olaniyan T, Osoba L, Akinlabi E (2017) Mechanical Properties of Bitumen Quenched Dual Phase Steel. Sains Malaysiana 46(5): 743-753.
- Adediran AA, Aribo S, Amuda MOH (2015) Mechanical properties of dual phase steel quenched in bitumen medium. Leonardo Electron J Pract Technol 14(26): 1-16.
- Corporation GM (2019) High Strength Sheet Steel, 180 MPa through 700 MPa Yield Strengths: GMW3032. (10th Edn), General Motors Worldwide (GMW).
-
Olorundaisi Emmanuel, Onas Ikele, Tamba Jamiru, Adegbola Taoreed Adesola, Juwon Fayomi, Bryan Akhiwu, Beck Akhiwu. Optimization and Microstructural Evaluation of Processing Parameters on the Density and Surface Hardness of Dual Phase Steel. Sci J Research & Rev. 3(1): 2021. SJRR.MS.ID.000553.
Magnetic resonance, Occupational, Safety zones, Standards, Static magnetic fields, RF fields, Missile effect, Penetration, Tomography
-

This work is licensed under a Creative Commons Attribution-NonCommercial 4.0 International License.


