 Research Article
Wearables Cardiovascular Monitoring: Effects of Cold Pressor Test on Heart Rates Estimated From ECG, PPG and IPG Signals
T Xiang1,2,3, ZJ Liu1,2,4, YW Jin2, N Ji2,3 and YT Zhang2,3,4,5,6*
1Department of Biomedical Engineering, City University of Hong Kong (CityU), Hong Kong SAR, China
2Hong Kong Centre for Cerebro-Cardiovascular Health Engineering (COCHE), Hong Kong SAR, China
3Wearable Intelligent Sensing Technologies Limited, Hong Kong SAR, China
4Micro Sensing and Imaging Technologies Limited, Hong Kong SAR, China
5Department of Electronic Engineering, Chinese University of Hong Kong (CUHK), Hong Kong SAR, China
6Hong Kong Institutes of Medical Engineering, Hong Kong SAR, China
YT Zhang, Department of Electronic Engineering, Chinese University of Hong Kong (CUHK), Hong Kong SAR, China
Received Date:March 04, 2024; Published Date:March 27, 2024
Abstract
As the demand for wearable technologies rises, the precision, reliability and user-friendly operation of wearable devices become increasingly critical. This study systematically investigated the effects of cold pressor test (CPT) on heart rate (HR) and heart rate variability (HRV), which are clinically useful parameters for the assessment and monitoring of autonomic nerve function and cardiovascular activities. Especially, HR data obtained from Electrocardiography (ECG), Photoplethysmography (PPG) and Impedance Plethysmography (IPG) were compared under the same temperature conditions. The CPTs were conducted on 22 subjects during baseline phase (Rest1), cold stimulus phase, recovery phase and another baseline phase (Rest2). It was found that cold water exposure would result in significant increased HR (p<0.001) and decreased HRV. Notably, a unique response was observed in one hypertensive subject that his HR decreased during cold stimulus phase. Furthermore, the results of comparative analysis demonstrated that HR from IPG exhibited better alignment with ECG across four phases while PPG showed poorer performance. However, under cold stimulus conditions, decrease in correlation was observed. This suggests that, compared to PPG, IPG may serve as a more reliable alternative to ECG for HR estimation. It should be pointed out that wearable devices incorporating IPG sensors can offer an efficient and gesture-free or hands-free alternative for HR estimation under diverse environmental conditions. Therefore, considering the estimation accuracy and user-friendly aspects, the IPG seems to be an optimal choice for wearable HR monitoring in comparison with the commonly used ECG and PPG methods, subject to further tests under a large database.
Keywords:Wearables; Heart rate; Heart rate variability; Cold pressor test; Cardiovascular monitoring
Introduction
Wearable devices are increasingly used in cardiovascular health monitoring. and they are considered key tools for digital, personalized and preventive medical care [1]. However, their wider deployment for clinical applications is still facing some challenges associated with accuracy and influence of environmental and operational factors. It has been shown that the HR and HRV analysis are powerful non-invasive parameters for assessing the function of the autonomic nervous system (ANS) and the status of various heart diseases by measuring the changes in the cardiac rhythm through time [2,3].The CPT, in which the subject immerses one hand or foot into ice water for 1-3 min, serves as a valuable tool to provoke sympathetic activation and has been used in the clinical and research settings to evaluate sympathetic neural control in humans [4].
Therefore, the analysis of the HR and HRV during CPT is a simple and efficient method by inducing temperature-related stress to trigger cardiovascular dynamics so as to better understand its impact on HR and HRV during ECG monitoring. In contrast to traditional time- or frequency-domain analysis, Peng et al focused on the time-frequency analysis of HR and HRV during the CPT, employing a time-varying autoregressive model [5]. Subsequent investigations have broadened the applications of HR and HRV in post-COVID period, particularly as a marker of cardiovascular dysautonomia [6,7]. Furthermore, beyond HRV, some researchers explored pulse rate variability for the assessment of autonomic responses [8] and investigated BP variability to evaluate vascular elasticity during CPT [9].
Furthermore, wearable devices incorporating ECG for HR measurement, such as wristwatches, currently demand crossheart physio-electrical contact with the device, which impose posture restrictions and inconvenience on the user [10]. For those wearable devices deriving HR from PPG, they are susceptible to contact force, ambient light and skin tone variations, potentially leading to inaccuracies [11]. In contrast, IPG devices are relatively underutilized in wearable HR measuring technologies. In the present study, conducted with a cohort of 22 volunteers, we aim to investigate the influence of the CPT on HRs and HRVs from ECG, PPG and IPG which were recorded simultaneously. By recording the signals and 3 types of temperature measurements in 4 different phases, we carefully examined the intricate dynamics of HR and HRV responding to the stimulus of external cold. In this study, using HR derived from ECG as the reference, the accuracy of HR estimation from PPG and IPG were systematically compared under the different temperature conditions.
Methods
Experimental protocol
The human subject experiments of the CPT were performed with a total of N = 22 participants in the seated position, which were divided into 4 different phases as shown in Figure 1. After a 2-minute relaxation period, a 2-minute baseline phase (Rest 1) was recorded. Subsequently, participants immersed their right hand in ice water at 3-6°C for 1 minute, representing the cold stimulus phase. Followed by a 6-minute recovery phase and finally, another 2-minute baseline phase (Rest 2) was recorded. Throughout the experiment, continuous BP, ECG, PPG and IPG signals were collected simultaneously by the BIOPAC system in the sampling rate of 2000 Hz for each signal. Temperature measurements included the localized hand temperature, ice water temperature, and forehead temperatures taken both before and after the cold stimulus.


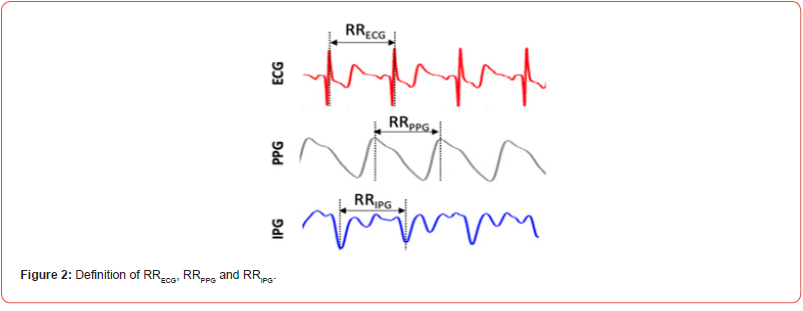
R–R intervals (RRECG) were calculated as the difference of successive R-wave peak locations from ECG signal. Similarly, the peak-to-peak interval (RRPPG) was determined as the time interval of two successive peak of the PPG signal while the valleyto valley interval (RRIPG) was calculated as the time interval of two successive valleys of the IPG signal as shown in Figure 2. HR was derived as the reciprocal of the calculated interval in seconds. The statistical analysis of time-domain HRV, included the average and standard deviation of normal RRIs (AVNN, SDNN), the percentage of successive intervals that differ by more than 50 ms (pNN50), and proportion of NN50 divided by total number of normal RRIs (pNN50) [12]. Numerical variables were expressed as Mean ± SD.
Result & Discussion
HR and HRV Analysis from ECG
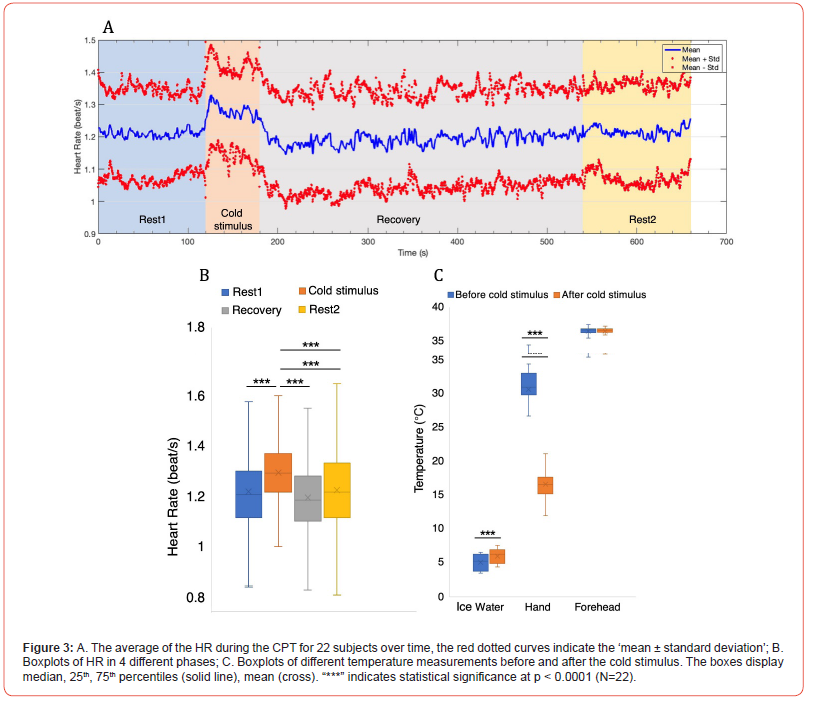
The averaged HR and standard deviation for all 22 subjects during the CPT were shown in Figure 3A. It was obvious that the HR was increasing during cold stimulus and gradually return to baseline during the recovery phase and Rest2. The statistical results showed that the HR during cold-water immersion increased significantly compared with those HR calculated during Rest1, Recovery and Rest2 (p < 0.0001) as plotted and summarized in Figure 3B and Table 1, reflecting the expected sympathetic response in most subjects. Different temperature measurements were conducted on ice water, immersed hand and forehead before and after the cold stimulus. The results shown in Figure 3C, and Table 1 revealed the temperature of the immersed hand significantly decreased, indicative of the immediate vasoconstrictive response to the cold stimulus and redirect blood flow away from the extremities, while the temperature of the ice water significantly increased when removing the handout of the water. In particular, there were no significant differences in forehead temperature, suggesting that core temperature remained relatively stable owing to the central thermoregulation during the experiment.

Table 1:HR and different temperature measurements in different phases.

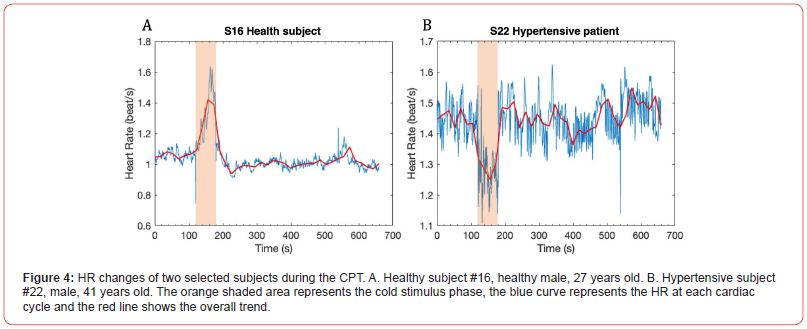
The findings of this experiment support the hypothesis that the CPT induces sympathetic nervous system activation in most individuals, leading to increased HR. Subject 16 was selected as an example and plotted in Figure 4A. However, this expected sympathetic response was not uniform across all participants and a unique response was observed in a hypertensive subject. This particular subject, with a snapshot BP of 146/86 mmHg during baseline measurement and under antihypertensive medication, demonstrated a decreased HR during the cold stimulus phase (Figure 4B). It suggested that the autonomic control of HR in hypertensive patients may exhibit distinctive patterns in response to cold stress, potentially attributable to antihypertensive medications and underlying cardiovascular conditions. This distinctive response indicates the importance of considering individual health profiles and medication regimens in the context of cardiovascular assessments, which warrants further investigation.
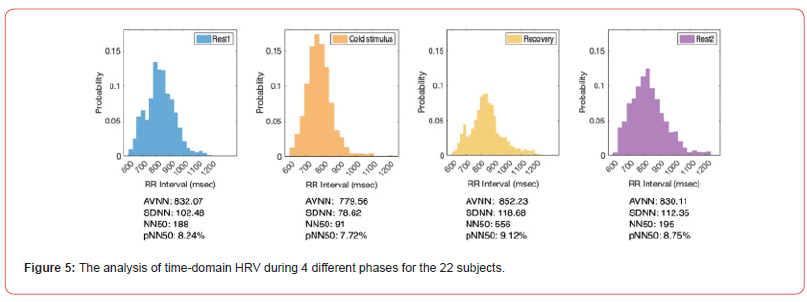
The time-domain HRV analysis, comprising key parameters such as AVNN, SDNN, NN50 and pNN50 are pivotal tools for evaluating ANS activity and cardiovascular health. In our statistical analysis, the decreased HRV was observed during the cold stimulus phase as summarized in Figure 5. This reduction in HRV parameters, which signifies a decrease in variability between consecutive RRI, reflects a shift towards enhanced sympathetic dominance and decreased parasympathetic activity. However, several studies have indicated that decreased HRV is an adverse prognostic factor for many CVDs. It was found that lower HRV is associated with a higher risk of mortality in acute myocardial infarction survivors [13,14].


Building on these investigations, it is essential to consider the potential implications for people with CVDs or at risk in realworld scenarios. For instance, abrupt transitions between indoor and outdoor environments with large temperature differences can evoke an immediate sympathetic nervous system response, leading to elevated HR and increased cardiac workload. This physiological reaction may raise the risk of cardiovascular events. Additionally, the results of this study suggested that the temperature effects should be considered in ECG monitoring. Given these considerations, it is highlighted that the importance of temperature compensation or control in ECG monitoring for cardiovascular health assessment and recommended that cardiovascular patients should pay attention or avoid abrupt change situations such as entering a cooled room from hot outside in summer.
Moreover, a special response was observed in the hypertensive subject, who experienced a decrease in HR during cold stimulus phase (from 1.45 to 1.27 beat/s). The impact of cold exposure among persons with CVDs is not well known. Though some studies found that cold exposure reduces myocardial oxygen supply in coronary artery, which may lead to ischemia and further harm CVD patients [15], one study demonstrated a positive effect of cold adaptation on cardio-protective mechanisms [16]. This interplay between temperature-induced stress and cardiovascular activities indicates the necessity of capturing and interpreting such distinctive responses during ECG monitoring. Cold adaptation may be beneficial for cardiovascular health, and it is a potential intervention or therapeutic approach for CVD management but needs further investigation.
Comparative Analysis of HR from ECG, PPG and IPG
Table 2:Comparisons of Mean and SD of HR from ECG, PPG, and IPG in Different Phases.

Table 3:RMSE, MAE and r of HRECG vs. HRPPG and HRECG vs. HRIPG in Different Phases.

Table 2 summarized the mean and standard deviation (SD) of HR from each modality throughout different phases. Overall, HR from both PPG and IPG closely approximates HR from ECG. Although the mean HR from PPG aligns well with those from ECG, the higher SD suggests increased variability, potentially attributed to the limitations of PPG under certain conditions. Table 3 presents a detailed analysis of Root Mean Squared Error (RMSE), Mean Absolute Error (MAE), and Pearson correlation (r) for HR obtained from ECG versus HR from PPG and IPG in different phases. Notably, the results reveal that HRIPG exhibits smaller RMSE and MAE values compared to HRPPG, indicating higher accuracy in capturing HR dynamics. Furthermore, the stronger r observed for HRIPG versus HRECG underscores the efficacy of IPG in closely mirroring ECGderived HR.
The observed trends in the results offer valuable insights into the potential of IPG as a robust alternative for HR assessment, particularly when compared to PPG. A distinct observation emerged during the Cold Stimulus phase, where both RMSE and MAE values were noticeably higher, and the r was smaller compared to other phases. This indicates that the accuracy and agreement between HR measurements from different modalities were more challenging during exposure to cold stimuli. Further investigations such as temperature compensation or control in cold environment are needed to overcome these inaccuracy issues.
Better performance shown in IPG may be attributed to its special features. IPG, being an impedance-based technology, may be less susceptible to external factors such as skin tone, ambient light, or motion artifacts that commonly affect PPG. IPG may offer deeper tissue penetration compared to PPG, potentially capturing more accurate signals representing vascular dynamics. [17] Understanding these factors can potentially guide the refinement and optimization of wearable technologies, enhancing their efficacy in real-world applications.
Conclusion
In summary, our investigation has shed light on the effects of the CPT on HR and HRV. Exposure to the cold water would result in significantly increased HR and decreased HRV, indicative of enhanced sympathetic dominance and decreased parasympathetic activity. Especially, the unanticipated decrease in HR observed in the hypertensive subject during cold stimulus phase suggests that cold exposure may hold promise as a potential approach for CVD intervention and therapy or even as a diagnostic marker. Furthermore, the observed decreased HRV parameters during cold stimulus, known as an adverse prognostic factor for many CVDs, underlines the importance of avoiding abrupt environment changes, particularly for individuals with or at risk of CVDs. Furthermore, the findings highlight the potential of IPG as a robust alternative for HR assessment, showcasing its close agreement with ECG-derived HR, better accuracy, and stronger correlation compared to PPG. During the cold stimulus phase, both RMSE and MAE among different modalities were higher, indicating the increased complexity of HR measurement under cold stimuli, emphasizing the need for tailored approaches in different temperature scenarios.
Looking ahead, as the demand for precise and convenient wearable monitoring continues to grow, future research on understanding the influence of temperature on HR, and HRV could benefit wearables to ensure the reliability and adaptability of remote monitoring across diverse environmental conditions. Besides, IPG could be used for assessing cardiovascular dynamics, providing insights into blood flow, cardiac output, and vascular resistance. Further studies in implementing IPG-based methodologies on wearable devices are worthy to explore. Exploring these avenues can augment cardiovascular health assessment and management in wearable health technology.
Acknowledgement
This work was supported by the ITC-InnoHK grant to Hong Kong Center for Cerebro-cardiovascular Health Engineering (COCHE) and City University of Hong Kong (CityU) starting up grant.
Conflict of Interest
Not applicable.
References
- S Canali, V Schiaffonati and A Aliverti (2022) Challenges and recommendations for wearable devices in digital health: Data quality, interoperability, health equity, fairness. PLOS Digit Health 1(10): e0000104.
- T Xiang, N Ji, D A Clifton, L Lu, Y T Zhang (2021) Interactive Effects of HRV and P-QRS-T on the Power Density Spectra of ECG Signals. IEEE Journal of Biomedical and Health Informatics 25(11): 4163-4174.
- SC Malpas (2010) Sympathetic Nervous System Overactivity and Its Role in the Development of Cardiovascular Disease. Physiological Reviews 90(2): 513-557.
- G Lamotte, C J Boes, P A Low, E A Coon (2021) The expanding role of the cold pressor test: a brief history. Clinical Autonomic Research 31(2): 153-155.
- RC Peng, WR Yan, XL Zhou, Ning Ling Zhang, Wan Hua Lin et al., (2015) Time-frequency analysis of heart rate variability during the cold pressor test using a time-varying autoregressive model. Physiological Measurement; 36(3): 441-452.
- B Shah, S Kunal, A Bansal, Ning Ling Zhang, Wan Hua Lin et al., (2022) Heart rate variability as a marker of cardiovascular dysautonomia in post-COVID-19 syndrome using artificial intelligence. Indian Pacing and Electrophysiology Journal 22: 70-76.
- L D Asarcikli, M İ Hayiroglu, A Osken, Kivanc Keskin, Zeynep Kolak et al., (2022) Heart rate variability and cardiac autonomic functions in post-COVID period. Journal of Interventional Cardiac Electrophysiology 63: 715-21.
- E Mejía Mejía, K Budidha, T Y Abay, J M May, P A Kyriacou, et al., (2020) Heart Rate Variability (HRV) and Pulse Rate Variability (PRV) for the Assessment of Autonomic Responses. Frontiers in Physiology 11: 779.
- Y Xia, D Wu, Z Gao, Xin Liu, Qian Chen, et al., (2017) Association between beat-to-beat blood pressure variability and vascular elasticity in normal young adults during the cold pressor test. Medicine (Baltimore) 96(8): e6000.
- HUAWEI WATCH D Electrocardiogram (ECG).
- J Fine, K L Branan, A J Rodriguez, Tananant Boonya ananta, Ajmal et al., (2021) Sources of inaccuracy in photoplethysmography for continuous cardiovascular monitoring. Biosensors 11: 126.
- Heart rate variability.
- B Xhyheri, O Manfrini, M Mazzolini, C Pizzi and R Bugiardini (2012) Heart Rate Variability Today. Progress in Cardiovascular Diseases 55(3): 321-331.
- H V Huikuri, P K Stein (2013) Heart Rate Variability in Risk Stratification of Cardiac Patients. Progress in Cardiovascular Diseases 56(2): 153-159.
- T M Ikäheimo (2018) cardiovascular diseases, cold exposure and exercise. Temperature 5(2): 123-146.
- I Kralova Lesna, J Rychlikova, L Vavrova, S Vybiral (2015) Could human cold adaptation decrease the risk of cardiovascular disease? Journal of Thermal Biology 52: 192-198.
- G Anand, Y Yu, A Lowe, A Kalra (2021) Bioimpedance analysis as a tool for hemodynamic monitoring: overview, methods and challenges. Physiological Measurement 42: 03TR01.
-
T Xiang, ZJ Liu, YW Jin, N Ji and YT Zhang*. Wearables Cardiovascular Monitoring: Effects of Cold Pressor Test on Heart Rates Estimated From ECG, PPG and IPG Signals. On Journ of Robotics & Autom. 2(4): 2024. OJRAT.MS.ID.000541.
Wearables; Heart rate; Heart rate variability; Cold pressor test; Cardiovascular monitoring
-

This work is licensed under a Creative Commons Attribution-NonCommercial 4.0 International License.


