 Research Article
Regression Analysis of the Effects of Yarn Counts, Stitch Lengths on Depth of Stripes of Different Single Jersey Fabrics
AFM Fahad Halim1*, Iftay Khairul Alam2, Md. Asaduzzaman2 and Md. Imran Howlader2
1World University of Bangladesh, Bangladesh
2College of Textiles, Donghua University, China
AFM Fahad Halim, Department of Textile Engineering, World University of Bangladesh, Bangladesh.
Received Date: July 22, 2019; Published Date: July 30, 2019
Abstract
Fabric can be made attractive by means of ornamentation and designing. Stripe is one means by which attractive fabric can be produced which added extra values of that product. This research was to investigate the effects of yarn counts, Knit structures and Stitch Lengths on the depth of stripes. All the samples were made with 100% cotton dyed yarns. The work was done in three sections. In the first section, using a stitch length 2.8mm, three Single Jersey Plain structures were produced using different yarn counts which were 30 Ne, 28 Ne, and 26 Ne. In the second section, Single Jersey Plain, Single Lacoste, Polo Pique, and Double Lacoste structures were produced with 26 Ne yarn at stitch length 2.8mm. In the final section, four Single Jersey Plain structures were produced by varying stitch length 2.70 mm, 2.80 mm, 2.90 mm and 3.0 mm using the same yarn count which was 30 Ne. After conditioning, Depth of stripes (DOS) were measured, data were presented in tables and graphical representations were shown. It was found that little changes in DOS were observed with decreasing of yarn count in a dry relaxed state but remarkable changes in DOS were observed after washing and wet relaxation. DOS for 30 Ne, 28 Ne, and 26 Ne were found 13.25 mm, 13.5 mm and 14.2 mm respectively. In the second section, the highest depth of stripe was found in Single Jersey Plain structure and lowest in Double Lacoste structure. DOS of other structures lie in between them. Effects of stitch lengths were also studied here. Effects of four different stitch lengths were shown in Single Jersey Plain structures. DOS in a dry relaxed state for 2.70 mm, 2.80 mm, 2.90 mm and 3.00 mm were found 11.1 mm, 13.35 mm, 13.85 mm and 14.30 mm respectively. DOS in the wet relaxed state was reduced in all samples due to shrinkage. Furthermore, attempts were made to conduct linear regression analysis in order to find a suitable formula to predict the change of DOS.
Introduction
The art of knitting has been rapidly progressing day by day. Unlike woven fabrics, knitted fabrics are popular for their shape fitting properties; soften handle, bulker nature and high extension at low tension. The application of knitting was popular by the term hose to produce a complete covering of the legs and since then the word hosiery is conveniently used for a series of articles on stockings, socks, knitted legs coverings, and even to general circular knitted goods [1].
Different types of knitted fabric may be produced by intermeshing different types of loops such as knit, tuck and miss loops. Along with knit loops, tuck loops are used to produce different types of commercial and popular knitted structures. The commercial design of knitted garments is a process that shares many important characteristics with other types of aesthetic design and engineering [2].
Yarn-dyed knit fabric is one of exclusive fabric highly recommended by Buyer. In the knitwear section, the yarn-dyed fabric is very popular and expensive rather than the regular solid fabric. For years, knitting has been considered more an art than a science. Many attempts have been made over the past century quantify the characteristics of knitted fabrics.3 Knit fabrics provide comfortable wear to almost any style of garment. Most of the knitted fabric is used to produce baby wear without restricting movement. While many variations of knit fabrics exist such that used for hosiery, only two types of knit fabric exist-weft and warp knits. From these two types of knit fabrics come various sub-types [11,12]. The key to understanding a knitted structure lies within its basic element, the single knitted loop. The length of yarn knitted into a single loop will determine such overall fabric qualities as hand, comfort, weight, extensibility, finished size, cover factor, and most importantly, fabric dimensional stability [4,10].
In this paper, an attempt was made to develop various feeder stripe single jersey structures on single jersey circular knitting machine and study on the effects of yarn counts, knit structures and stitch lengths on the depth of stripe were observed.
Materials and Methods
Raw material
Methods
In this project work, three different counts of five colors were used to produce samples. Yarns were collected from knitting laboratory (Tables 1&2). Count of each and every cone was tested by using wrap reel and balance. Obtained data were presented in Table 3 of annexure. Before knitting, machine servicing was done properly, all the setting points were checked, and yarn tension was adjusted.
Table 1:Raw material of samples.
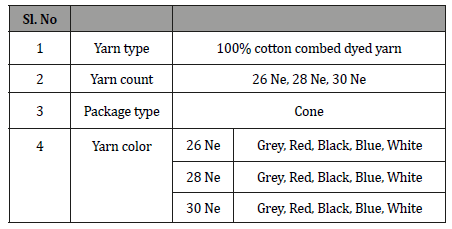
Table 2:Specifications of single jersey circular knitting machine.

First of all, Single Jersey Plain fabrics were produced with three different counts at the VDQ 15.65cm. Course length and stitch length were measured. Stitch length was found 2.80mm. Data of course length and stitch length were presented in Table 3 of annexure. Then came arrangements and needle set out were changed for other samples. Single Jersey Plain, Single Lacoste, Polo Pique and Double Lacoste structures were produced with 26 Ne yarn at stitch length 2.80mm. Last of all, four different samples were knitted with 30 Ne yarn at four different stitch lengths such as 2.70mm, 2.80 mm, 2.90mm and 3.00mm. Detail parameters were given in Table 3.
Table 3:Test Methods.
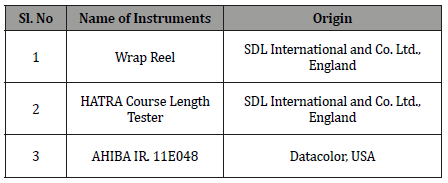
All the samples were then left lying on a smooth flat surface for 24 hours for dry relaxation. After relaxation, depth of stripe and CPI for each sample were measured. Then hot wash was given to all samples by using AHIBA IR machine at 60° C for 10min. Samples were then dried. After drying and conditioning, depth of stripe and CPI were measured (Table 4).
Table 4:Test Methods.
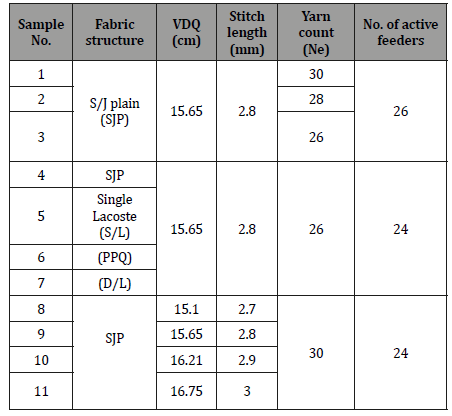
Measurement of course length by HATRA course length tester
The fabric was prepared in such a manner that the lengths of yarn forming complete knitted courses can be pulled out easily. All the samples for measuring stitch length (SL) were in tubular form. Samples were cut across the wales line by a scissor. The yarn clamp spring was set into HATRA tester at an approximate length, according to the indicator of the Board of HATRA. One end of the yarn of a course of a sample was attached to the clamp. Then according to the direction, the yarn was guided through pulleys by pulling out from the sample. At the end of the yarn, a weight was attached for giving appropriate tension in yarn. The course length (CL) of the samples were then measured from the scale of HATRA. Stitch length were calculated by using the following formula. The total no. of needles was 744.

Measurement of Depth of Stripe
Eleven different types of samples were produced for depth of stripe (DOS) measurement following testing standard: B. S. 5441; 1977. After conditioning for several hours, the samples were then laid on a large flat table for DOS measurement. Twenty reading were taken from each sample.
Measurement of courses per inch
Test samples were laid on a flat horizontal surface for removing wrinkles without stretching. Courses per inch (CPI) were measured using a counting glass following testing standard: B. S. 1051; 1981. For the measurement of CPI of Single Jersey Plain fabrics, the edge of the counting glass was positioned either parallel to or, perpendicular to the wale line. Courses were counted parallel to the wale line. For cross tuck constructions, courses per inch were measured by counting the courses of an inch. Ten measurements for each sample were made.
Results and Discussion
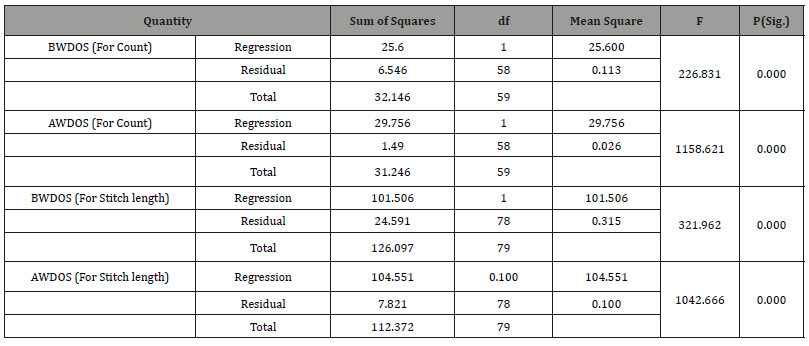
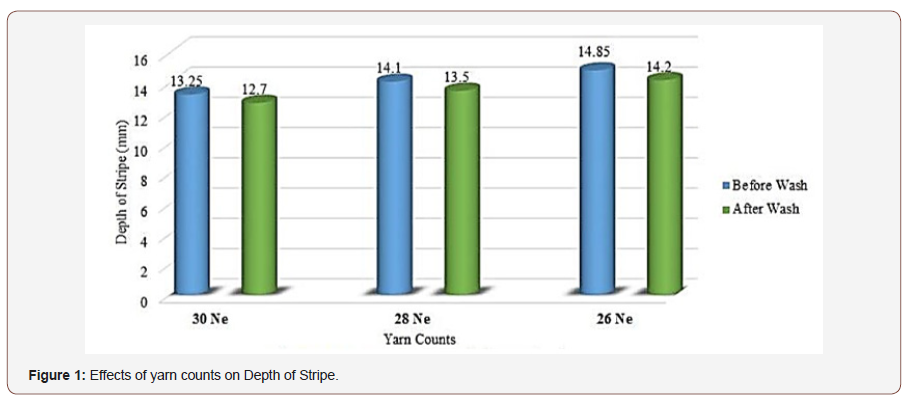
In both relaxed states, it was evident that, maximum depth of stripe (DOS) was found in Single Jersey Plain fabric knitted with 26 Ne and lowest DOS was observed in SJP knitted with 30 Ne. In dry relaxed state, variation in DOS for different yarn counts was observed but its values were very low. In wet relaxed state, effects of yarn count in DOS were clearer. Depth of stripe in dry relaxed for 30Ne, 28 Ne and 26 Ne were found 13.25mm, 14.1 mm and 14.85mm respectively but in wet relaxed state, the values were reduced due to shrinkage [5] and they were 12.7mm, 13.5mm and 14.2mm respectively (Figure 1) (Tables 5&6).
Table 5:Regression coefficients, t-values and significance level of variables of our linear regression model.
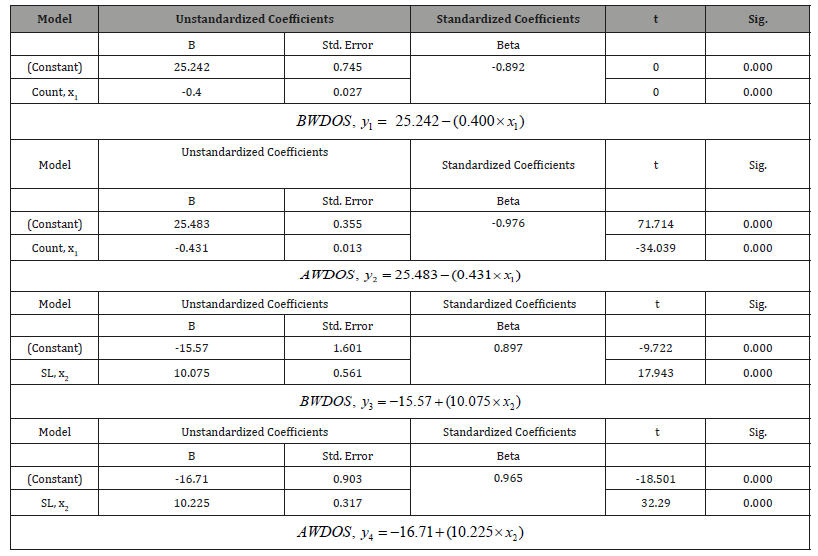
Table 6:Analysis of variance (ANOVA) results, BWDOS= Before wash depth of stripe, AWDOS= After wash depth of stripe./p>
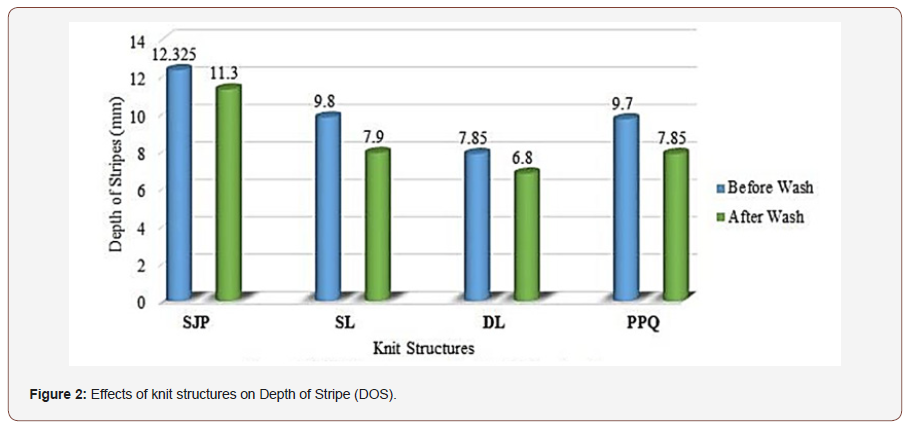
In dry relaxed state, highest stripe depth was found in Single Jersey Plain structures, and then, Single Lacoste, Polo Pique and Double Lacoste respectively. Same sequence was observed in wet relaxed state. Highest value of depth of stripe was observed in Single Jersey Plain fabric and its values were before wash 12.33mm and after wash 11.30mm. The lowest values of DOS were found in Double Lacoste structures and its value were before wash 7.85mm and after wash 6.80mm. Depth of stripe of other structures lie in between them. Depth of stripes of cross tuck structures such a Single Lacoste, Double Lacoste and Polo Pique were lower than Single Jersey Plain structures where all the stitches were knit stitch. It has been observed that the structures having only knit stitches gave higher depth of stripe and the structures having tuck stitches gave lower depth of stripe. The reasons behind this behavior are in knit stitch, the complete loop configurations are available but, in tuck stitches, the loop length is shortened, as Tuck loops reduce fabric length and length-wise elasticity, due to the higher yarn tension on the tuck and held loops causes them to rob yarn from adjacent knitted loops [6-9] (Figure 2).
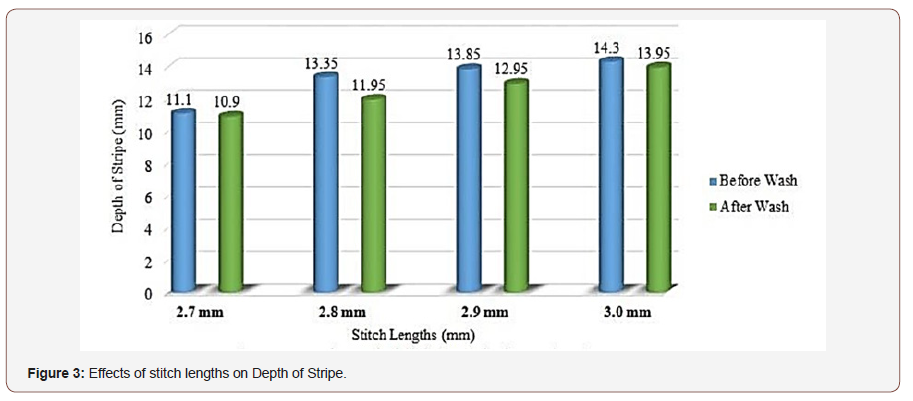
In dry relaxed state, it was observed that, depth of stripe (DOS) was increased with the increase of stitch length. Highest depth was observed in sample 11 knitted with stitch length 3.00mm, and lowest DOS was found in Sample 9 which was produced with stitch length 2.70mm. Highest DOS was observed in the structure produced with stitch length 3.00mm and its values were before wash 14.30mm and after wash 13.95 mm. Lowest DOS was observed in the structure produced with stitch length 2.70mm and its values were before wash 11.1mm and after wash 10.9mm. In dry relaxed state, there was no clear trend in DOS variations was observed but in wet relaxed state, trend in DOS variations was found. About 1.05mm DOS were increased by increasing stitch length 0.10mm. The reason behind this is increasing stitch length increases the loop length which in turn increases the depth of stripes [7,8] (Figure 3).
Regression analysis
Regression analysis is the most common statistical method for estimation of the relationship between a dependent variable and one or more independent variables. This method has the advantage of simplicity in describing the quantitative relationship between textile material properties. Therefore, the multiple regression analysis method was selected for establishing the relationships between fibre and yarn properties. At the beginning, the types of relationship between selected counts, stitch length (SL) as independent variables and depth of stripe before and after wash as dependent variables were checked individually by using curve estimation and correlation analysis. Statistical analysis indicated that there was a nearly linear relationship between them. Hence, the linear multiple regression analysis method was chosen for this study. Statistical analyses were performed using SPSS 11.0.1 software. From the linear regression formula, it is evident that, the predicted values for DOS of counts 26, 28, 30 Ne not showed variation more than 5%. This also same for predicted values of stitch lengths which shows that the regression formula is accurate and can be used to predict the values during manufacturing knitted fabrics for estimation of DOS (Table 7).
Table 7:Showing predicted vs observed data.

Conclusion
In this paper an approach was taken to determine the stripe depth in different parameters. The linear regression analysis formula and its changes in different parameters can help to make an idea about the end result while producing horizontal striped weft knitted fabric commercially. It was observed that values of depth of stripes were changed due to changing the yarn counts, knit structures and stitch lengths. Highest depth of stripe was found in single jersey plain structures and lowest in Double Lacoste at constant yarn count and stitch length. Courser yarns give higher depth of stripe of a knit fabric. It was also seen that depth of stripe increases by increasing stitch length. Considering all the variables, it can say that highest depth of stripe can be produced in Single Jersey Plain knitted with coarsest yarn at largest stitch length. In this work, the structures were produced on small diameter machine. Yet remarkable variation in depth of stripe was observed. If the structures are produced in a large diameter machine which is commercially available, the depth of stripe variation will be more. Knitters can take help in selecting proper yarn count and stitch length for a particular depth of stripe of a structure using linear regression formula [10-16].
Acknowledgement
None.
Conflict of Interest
No conflict of interest.
References
- Anbumani N (2007) Knitting Fundamentals, Machines, Structures and Developments. (1st edn), New Age International, India.
- Eckert C, Stacey M (2003) Sources of inspiration in industrial practice. The case of knitwear design. The Journal of Design Research 3(1).
- Hepworth B, Hepworth K, Leaf GA (1970) The Plain Knitted Structure. Tex Res J 40(5): 863-870.
- Munden DL (1959) The Geometry and Dimensional Properties of Plain- Knitted Structure. Journal of the Textile Institute Transactions 50(7): T448-T471.
- Kadolph (2007) Quality Assurance for Textiles and Apparels. Fairchild books. Bloomsbury Publishing, London, UK.
- Spencer DJ (2001) Knitting Technology. (3rd edn), Woodhead Publishing Limited, Cambridge, England.
- Hasnat MA, Khan MS (2013) Formulating equations for calculating & controlling width, WPI, CPI & GSM of circular weft knitted fabric. Bangladesh Textile Today. 06(01).
- Maletta Z (2016) http://www.ehow.com/about_5456692_knitwear. html.
- Thomas DG (1971) An Introduction to Warp Knitting. England: Merrow Publishing Co. Ltd.
- Mogahzy YE (2008) Engineering Textiles: Integrating the Design and Manufacture of Textile. Cambridge: Woodhead Publishing Limited, UK.
- Lee J, Steen C (2014) Technical Sourcebook for Designers. Bloomsbury Academic, UK.
- Poursartip A, Street K (1997) Proceedings of the Tenth International Conference on Composite Materials, Volume 4: Characterization and Ceramic Matrix Composites. Cambridge: Woodhead Publishing Limited, UK.
- Murry LS (1997) ICCM-11 Proceedings: Volume 5, Textile Composites and Characterization. Cambridge: Woodhead Publishing Limited, UK.
- Ajgaonkar DB (1998) Knitting Technology. Mumbai. Universal Publishing Corporation.
- Hannan MA, Islam MM, Kabir SM (2014) Effect of yarn count & stitch length on shrinkage, GSM and spirality of single Jersy cotton knit fabric. European Scientific Journal 10(36): 188-198.
- Khalil E, Solaiman Md, Sarkar J, Rahman MM (2014) Evaluation of physico-mechanical properties of 1×1 interlock cotton knitted fabric due to variation of loop length. International Journal for Research in Applied Science and Engineering Technology 2(9):193-197.
-
FAFM Fahad Halim, Iftay Khairul Alam, Md. Asaduzzaman, Md. Imran Howlader. Regression Analysis of the Effects of Yarn Counts, Stitch Lengths on Depth of Stripes of Different Single Jersey Fabrics J Textile Sci & Fashion Tech. 3(3): 2019. JTSFT.MS.ID.000563.
-
Regression, Yarn counts, Stitch lengths, Jersey fabrics, ornamentation, Knit structures, Depth of stripes, Knitting, Aesthetic design, Garments
-

This work is licensed under a Creative Commons Attribution-NonCommercial 4.0 International License.


