 Research Article
Comparative Study of the Inspection Parameters for AQL 2.5% and 1.5% in Garments Manufacturing Process
Abul Fazal Mohammad Fahad Halim1*, Arpan Chakma2, Mohammad Muzammel Hossen2 and Ajoy Royd1
1World University of Bangladesh, Bangladesh
2Zhejiang Sci-Tech University, China
Abul Fazal Mohammad Fahad Halim, World University of Bangladesh, Dhaka, Bangladesh.
Received Date: May 07, 2019; Published Date: May 16, 2019
Abstract
Quality control is a procedure or set of procedures intended to ensure that a manufactured product to meet the requirements of the customers. To meet the customer requirement the finished products should be inspected in order to assure that it does not contain any faults. In making a decision regarding acceptance inspection for any particular purpose, it may be desirable to consider not only various possible systems or procedures of acceptance sampling by attributes but also the alternatives of [1] no inspection at all, but imposition of a requirement that statistical evidence of satisfactory quality be provided with each lot; [2] 100% inspection; and [3] possibilities of acceptance sampling by variables. This paper is focused on the comparison of different AQL which is fundamental for quality control in final inspection process. This study was entirely conducted in a garment manufacturing company for authentic data. Similarities and dissimilarities in inspection parameter for AQL 2.5% and 1.5% were obtained by observing and analyzing collected data. The research work carried out here may be considered as a significant step to inspection process regarding quality confirmation.
Keywords: AQL; Inspection; Comparison; Quality
Introduction
The textile and garment industry which was once the backbone of advanced countries. It has lost its base and has shifted to developing countries such as Bangladesh, Sri Lanka etc. The textile and apparel industry are one of the leading segments of our economy and the largest source of foreign currency earnings for Bangladesh. Here Ready-Made Garments (RMG) is the outcome manufactured in Apparel Industry [1]. In the early eighties Bangladesh entered the garments industry. The RMG sector has experienced an exponential growth since 1980. In year1984-85 the number of garments factory were 384 with 0.12 million worker which reached at total number of garments factory 4296 with 4.00 million workers in year 2014-15 [2]. In the last three decades this country has overcome the challenge of producing garments though it is not a major cotton producing country. Bangladesh RMG industries have radically changed the lives of millions of Bangladeshis. The apparel industries provide direct employment to some three million people and indirect support to millions more. [3] The sector has employed around 4.00 million people, 80% of them are women which helps to reduce poverty from this country as 20 million people are directly or indirectly involved with this industry. It provides job facilities for Bangladeshis mainly woman from low income families [4].
In financial year 2014-2015, Bangladesh has exported garments and worth around US $ 25.49 billion in 148 countries across the Globe which covers 81.71% of total export. [2] In Bangladesh, there are 4296 garments factory whose net worth is 22 billion dollars, has achieved reputation in producing world class garment products and acquired the second position in the ranking of Global RMG producing countries right after China. [5] Several opportunities are knocking for this industry as China has declared to withdraw their investment from garments industry in near future. To meet up the target, garment manufacturing companies need to concentrate on mass production ensuring defect free high-quality products within the limited resource they have. The world economy is changing in a rapid motion. RMG sector developed very fast in Bangladesh due to two major reasons; export-quota system and cheap labor. But now a day, the Global apparel market has become more challenging than ever before. Most factories are still focused on short term survival and finding new business. So, in order to compete in today’s Global competitive market, the RMG industry needs to look for more ways to gain a competitive edge. To maintain a position, the industry needs to raise its standards. [6] RMG sector of Bangladesh faced massive competition after 2005 due to phase out of exportquota system for which Global competition is rising day by day. Customer demand has risen in terms of improved product quality and high quantity as well. Garment manufacturers are now turning to improve their product quality and trying to give a check and balance to faulty production and huge number of left over found after shipping in order to maximize their profit margin. Rejections not only cause time loss for the productivity but also reduce the profit. In order to overcome the problem, a garment manufacturing company needs to check every single aspect that causes the ultimate loss of rejections like faulty process, low quality raw materials or even manpower that is involved with the whole process. [7] Today’s increasingly universal market conditions and the ever-increasing production have brought the question of quality to the forefront more than ever. Whereas about 20 years ago quality used only to refer to product quality, today it has become part of our daily life in every aspect. Quality conformation is the conformation of a set of properties for a manufacturer. To control quality in apparel industries AQL is an integral part of final inspection. AQL means “Acceptable Quality Level” is the maximum percent defective (or the maximum number of defects per hundred units) that, for purpose of sampling inspection, can be considered satisfactory as a process average. According to ISO 9000:2000, “It is the degree to which a set of inherent characteristics fulfills requirements” [8]. A defect is imperfection of a product which contains one or more faults. Failure to meet requirements with respect to quality characteristics are usually described in terms of defects or defectives. There are mainly 3 types of defects:
• Critical defects
• Major defects
• Minor defects [9]
While these can vary from client to client, the typical definitions are as follow:
• A Minor defect is a discrepancy from the standards, but one that is not likely to affect the usability of an object.
• A Major defect is one that is likely to create failure of the unit for its intended purpose.
• A Critical defect is one that is deemed to be hazardous or unsafe [12,14].
Accepting or rejecting of a lot depends on the number of defective garments found by sampling according to AQL chart. Below the chart for AQL were given for better understanding.
In Bangladesh 1.5, 2.5, 3 and 4 AQL percentages are followed which are declared by the buyers for final inspection of the product to decide the acceptance or rejection of products lot/batch. The project addresses the comparison between inspection parameter for AQL 2.5% and 1.5%.
Methodology
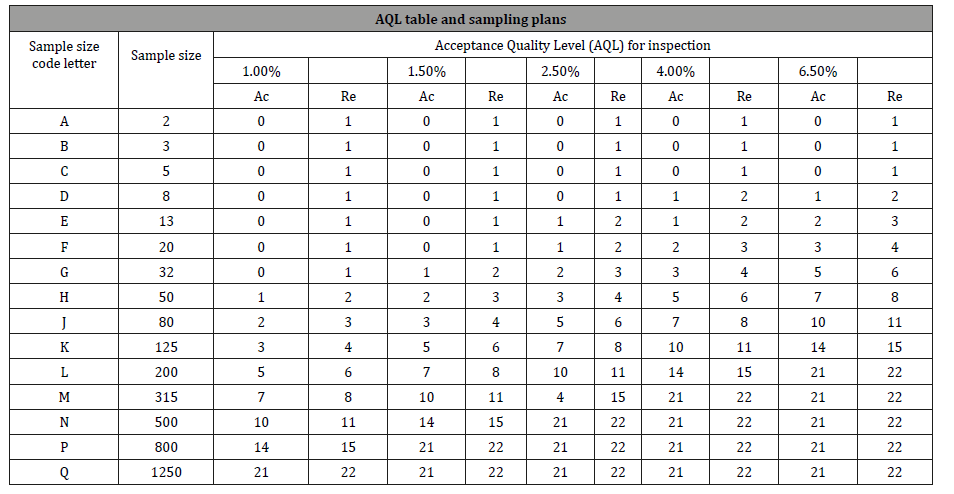
The project work was done by collecting necessary information step by step from Innovative garments located in BCIC, Narayanganj, Dhaka. The data were collected by monitoring and recording throughout the period of implementation for analysis purposes. An AQL of 1.5% has been specified for a certain class of defects. Assume normal inspection with a lot size of 10,001 to 35000 and inspection level I. Table 1 indicates that the sample size code letter is K. Table 2 gives acceptance criteria with normal inspection, single sampling. It tells that for code letter k and a 1.5% AQL, sample size is 125 and the acceptance number is 5. The rejection number is stated as 6. In all these single sampling plans, the rejection number is one more than the acceptance number. Similarly, for AQL 2.5%, the acceptance number is 7. The rejection number is stated as 8. Data for both AQL 2.5 and 1.5% were obtained by the following process described below.
Table 1: AQL chart [11,13,14].
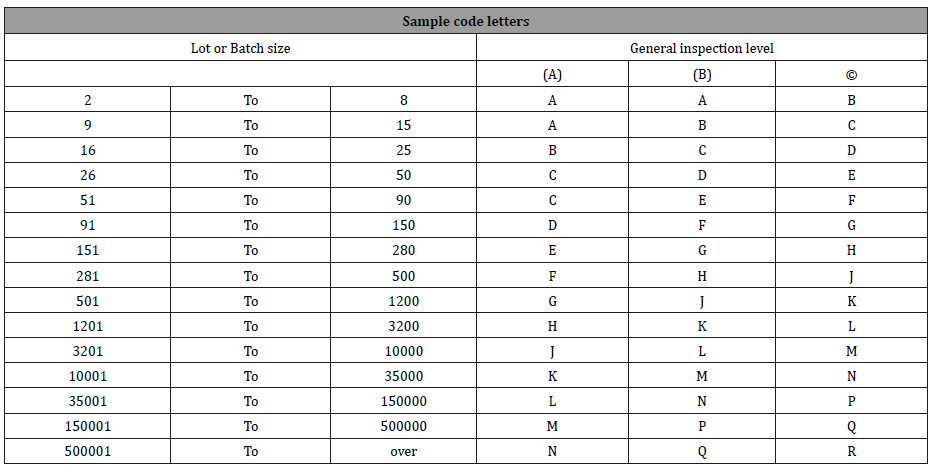
Table 2: AQL table and sampling plans.
Data for AQL 2.5%
• Finished fabric inspection.
• Before cutting fabric inspection.
• Cutting panel inspection.
• Sewing off-line inspection (Before finishing).
• Finishing off-line inspection (Before cartooning).
• Pre-final inspection.
• Final inspection.
Data for AQL 1.5%
• Finished fabric inspection.
• Before cutting fabric inspection.
• Cutting panel inspection.
• Sewing off-line inspection (Before finishing).
• Finishing off-line inspection (Before cartooning).
• Pre-final inspection.
• Final inspection.
Table 3: Faults identification process.
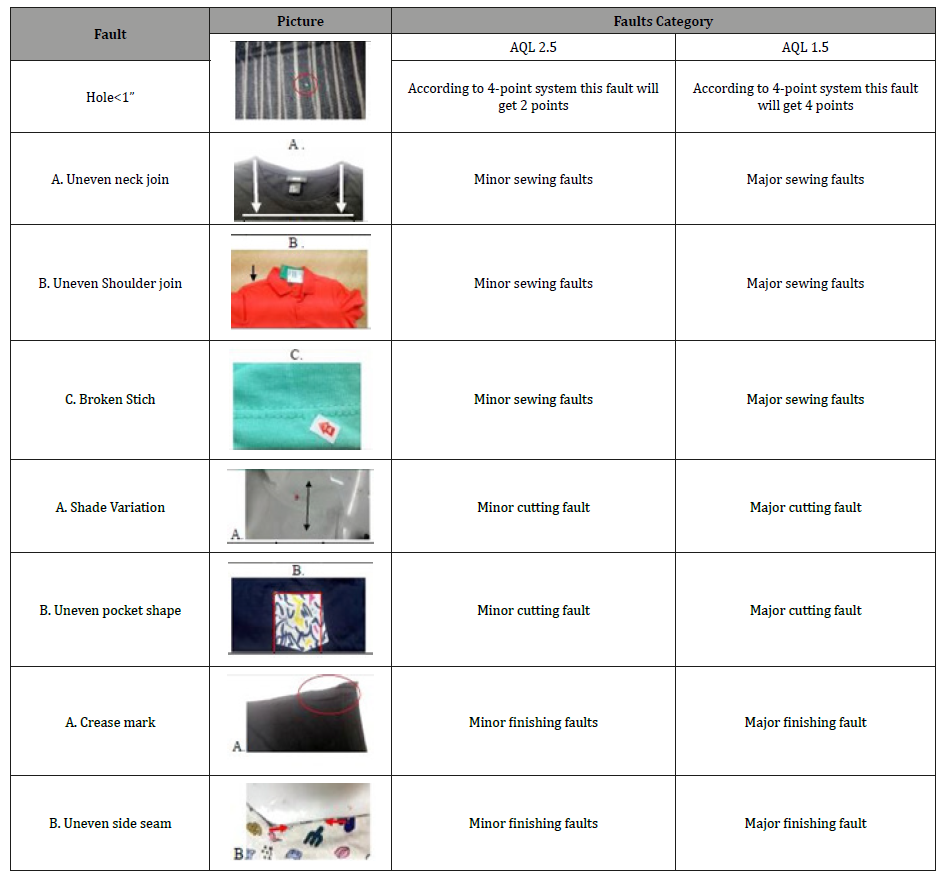
Faults identification (Finished fabric, cutting panel, Sewing and Finishing) was done by following 4-point system and it has been illustrated in the following Table 3.
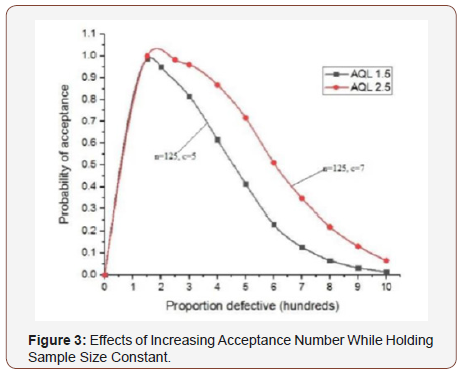
Operating characteristic (OC) curve was drawn by plotting the probability of accepting the lot for a range of proportions of defective units. To draw the OC curve, look up the probability of accepting the lot for a range of values of p. For each value of p,
1. Multiply p by the sample size n= 125.
2. Find the value of np in the left column of the tables prepared for the purpose of drawing OC curves.
3. Move to the right, find the column for c (c= acceptance number of sample). For AQL 1.5, c=5 and AQL 2.5, C=7.
4. Record the value for the probability of acceptance, Pa.
5. When p = AQL, the producer’s risk, is 1 minus the probability of acceptance. When (p = LTPD), the consumer’s risk, b, equals the probability of acceptance. LTPD= Lot tolerance proportion defective or the worst level of quality that the consumer can tolerate [17]. LTPD was considered as 6% for both AQL.
Result and Discussion
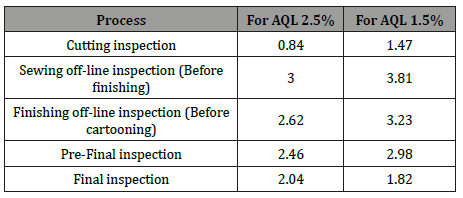
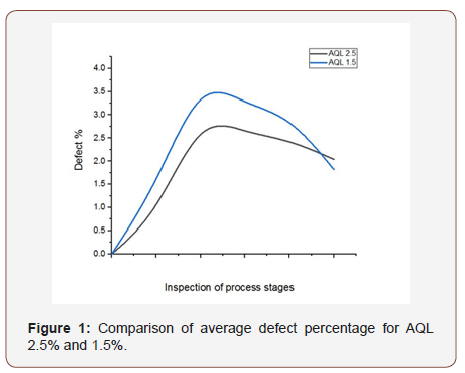
Table 4 shows the defects percentage of AQL 1.5% and AQL 2.5% for different processes. It was found that the defect percentage of AQL 1.5% was greater than AQL 2.5% for cutting inspection, sewing off-line inspection (Before finishing), finishing off-line inspection (Before cartooning) and pre-final inspection. But from Figure 1, the defect percentage of final inspection for AQL 1.5% was lower than AQL 2.5%.
Table 4: Comparing the average defect percentage for AQL 2.5% and AQL 1.5%.
The reasons for this was,
• Every fault was considered as major fault for AQL 1.5% from sewing off-line inspection (before finishing) to pre-final inspection.
• 3 minor faults were considered as 1 major fault for AQL 2.5% from sewing off-line inspection (before finishing) to prefinal inspection and final inspection.
• Example: Table 5 Shows the data of faults from sewing offline inspection (before finishing) to pre-final inspection.
Due to this reason, defect percentage in AQL 1.5% is higher than AQL 2.5% from cutting to pre-final inspection. But in final inspection defect percentage of AQL 1.5% is lower than AQL 2.5%. Sometimes minor fault can be accepted by negotiation between buyer/third parties and manufacturer.
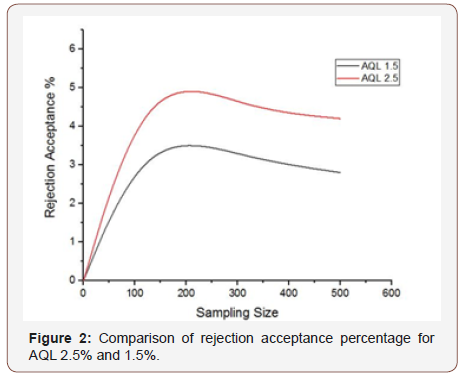
From Figure 2 It is evident that with the increase of sampling size the rejection acceptance % was decreasing. This phenomenon can be explained as, with the increase of sample size the probability of having fault in products also increases which eventually decreases the rejection acceptance percentages for both AQL 1.5 and 2.5 %. On the other hand, the rejection acceptance % for AQL 2.5 was higher in contrast with AQL 1.5 this could be due to acceptance of minor faults as accepted product during inspection which was illustrated on Table 5.
Table 5: AQL 2.5% and AQL 1.5%.

The results are plotted in Figure 3 They demonstrate the following principle, increasing c while holding n constant decreases the producer’s risk and increases the consumer’s risk. For AQL 1.5 and 2.5 the producer’s risk were 1.3%, 1.7% while the consumer’s risk was 23.1% and 51% respectively. These data show that with the increase of AQL the producer’s risk did not changed a lot but the consumer’s risk was doubled. The reason behind this, during inspection the minor faults were being accepted which gives rise to an increased consumer’s risk in the OC curve.
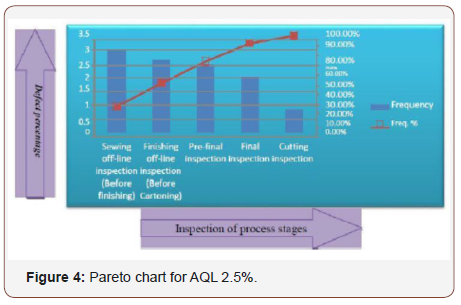
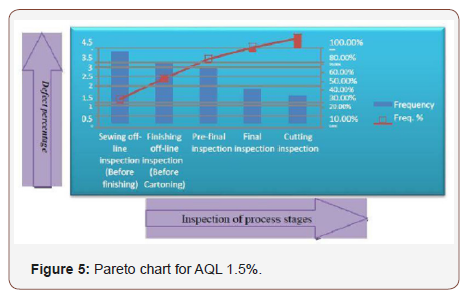
A Pareto chart, named after Vilfredo Pareto, is a type of chart that contains both bars and a line graph, where individual values are represented in descending order by bars, and the cumulative total is represented by the line [10].
From Figures 3&4 it is obvious that from sewing to final inspection defect percentage gradually decreases and cutting defect percentage was lowest among them. As it knows generally the AQL is applicable for finished garment in order to maintaining the quality. But it has found that for achieving desired AQL, manufacturer maintain the quality from finished fabric to finished garments by various method. It is done in order to control the defect quantity remains under the acceptance limit.
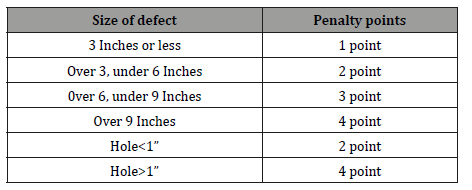
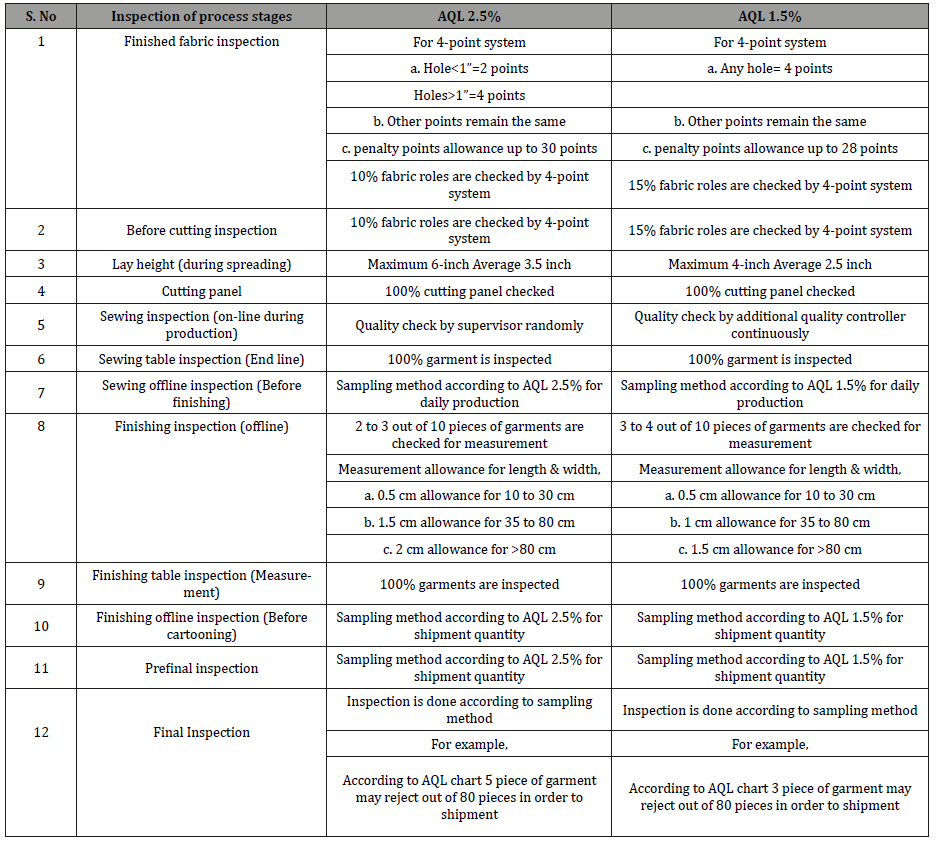
Comparison parameters between AQL 2.5 and 1.5% were shown in the Tables 6&7 by the following 4-point system for fabric inspection.
Table 6: Penalty points for different size of defects [8,15,16].
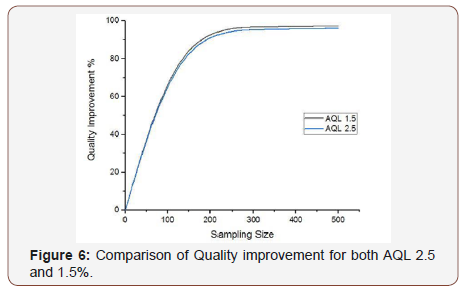
From Table 7 rejection quantity after final inspection for AQL 2.5 % was more than that of AQL 1.5% which gives more preference to the supplier to think less about their quality issues for shipment of products. Figure 5&6 Shows the Comparison of Quality improvement for both AQL 2.5 and 1.5%. It was obvious that for AQL 1.5% the quality improvement % was higher than that of AQL 2.5% because of fault minimization during production processes. Which proves that lower the AQL, better the quality and tighter the inspection.
Table 7: Comparison of inspection parameter for AQL 2.5% and 1.5% in different process stages.
Therefore, by conducting Quality Control Tests on each batch, and examining the trend, a manufacturer can quickly identify any product that fails to meet its AQL and move to correct his process. The use of AQLs to ensure product quality is a time-tried system that ensures a stable quality of product over the medium to long term [14].
Conclusion
The research on AQL comparison can be summarized in following conclusions:
1. Points/100 sq. yards for AQL 2.5% is higher than AQL 1.5% for finished fabric and before cutting inspection because supervisor continuously monitor the quality for AQL 1.5 during fabric production.
2. Again, from cutting to pre-final inspection the defect percentage is higher for AQL 1.5% than AQL 2.5% but in final inspection defect percentage is lower for AQL 1.5% than AQL 2.5%.
3. For AQL 1.5% all faults are considered as major fault from sewing to pre-final inspection.
4. For AQL 2.5%major and minor both faults are considered, and 3 minor faults are considered as 1 major fault.
5. Lower the AQL, better the quality and tighter the inspection.
AQL is an inevitable consequence of manufacturing process. In this system, sample is selected by random sampling technique from a lot. After proper inspection, the decision is taken whether the lot will be accepted or rejected. This is applicable for raw materials to finished products inspection as well as garments. This system is popular and used widely in the world trade. Acceptable sampling system consists of lot size, sample size, AQL, accept number and reject number. Customer’s choice is given priority in this system. It is the customer who decides whether the goods will be inspected at AQL of 1.5%, 2.5% or so on. They generally give preference to the major defects (such as oil mark, loose thread etc.) i.e. which at a glance seems to be odd for use. They also give the direction on sampling technique. Complete elimination of defects from garments is virtually impossible; one can only help to reduce it to such an extent that the customer will be satisfied.
Data Availability
The data used to support the findings of this study are available from the corresponding author upon request.
Acknowledgement
None.
Conflict of Interest
No conflict of interest.
References
- Shanmugasundaram S, Panchanatham N (2011) Embracing Manpower for Productivity in Apparel Industry. International Journal of Innovation, Management and Technology 2(3): 232-237.
- BGMEA (2016) BGMEA Trade Information.
- Ovi IH (2015) Apparel industry back on track. Dhaka Tribune.
- BGMEA (2015) Bangladesh Garment Manufacturers and Exporters Association.
- Sarkar LC (2014) RMG market: Bangladesh projected as Next China. The financial express.
- Stotz DD (2009) Raising RMG Industry Standards. Bangladesh Textile Today.
- Atilgan T (2007) Acceptable quality levels in the textile sector and their effects on the level of competition. Fibres and Textiles in Eastern Europe 15(1): 16-23.
- Mehta PV, Bhardwaj SK (1998) Managing Quality in the Apparel Industry: New Age International p.327.
- Doulah A, Islam MI, Farzana I (2012) Improve the quality of products in woven apparel industries by plan-do-check-act (pdca) cycle. J Innov Dev Strategy 6(1): 49-53.
- Zairi M (1991) Total quality management for engineers: Elsevier (1st edn) p. 192.
- Bheda PR (2010) What is acceptable quality level.
- What is AQL? (2015).
- Kiran (2015) Quality2West | Quality Control, Audits & Inspections.
- Spashett J. AQL – What is an Acceptable Quality level? p-1-5.
- Rahman MF, Baral LM, Chowdhury M, Mannan A, Khan AN (2009) Quality management in garment industry of Bangladesh.
- Nayak R, Padhye R (2015) Garment Manufacturing Technology: Elsevier.
- Acceptance sampling plans.
-
Abul Fazal Mohammad Fahad Halim, Arpan Chakma, Mohammad Muzammel Hossen, Ajoy Royd. Comparative Study of the Inspection Parameters for AQL 2.5% and 1.5% in Garments Manufacturing Process J Textile Sci & Fashion Tech. 2(4): 2019. JTSFT.MS.ID.000544.
-
AQL, Inspection, Comparison, Quality, Textile, Apparel industry, Garments
-

This work is licensed under a Creative Commons Attribution-NonCommercial 4.0 International License.


