 Research Article
Assessing the Quality Improvement Process of Hypertensive/Diabetic Patients through Medical Outpatient Compliance tracking in Chow Hospital, Warri, Delta State, Nigeria – A Three-Year Retrospective Study From 2015-2017
Monday AC Adishi, Texila American University, USA.
Received Date: March 13, 2019; Published Date: June 19, 2019
Abstract
The management of hypertensive/diabetic clients has become more complicated through the problems caused by non-compliance with medical appointment and therapeutic regimens. This ugly trend has robbed many clients of optimal health. The theoretical framework in this study is essentially based on Imogene King’s theory of goal attainment, which describes the interpersonal relationship where-by the client grows and develops to attain certain life goals by overcoming factors such as roles, stress, space and time. Within the three years under review, the abovementioned factors had been identified as barriers to Medical Out-Patient (MOP) compliance and treatment regimens among the hypertensive/ diabetic clients. Throughout the three years of this study, the MOP clients’ schedules with the physician and their corresponding attendance were monitored strictly, their awareness on health promotion, disease management and prevention of complications through compliance with MOP appointment and therapeutic regimens were increased, leading to a marked decrease in the rate of non-compliance and progressive improvement in their clinical parameters. Over 6,400 clients were scheduled for MOP clinic within the three years under review, but over 6,600 clients utilized the MOP clinic, due to the accommodation of about 500 clients who accessed the MOP clinic without previous schedule.
Introduction
Medical Outpatient Clinic in CHOW Hospital, Warri comprises all the patients seen and managed by the Physician. These include patients with Diabetes Mellitus, Hypertension, Retroviral illness, general medical conditions requiring non-surgical management and other heart-related conditions. However, this Medical Out- Patient (MOP) Survey is carried out mainly on Hypertensive/ Diabetic patients. The survey looks into the number of clients scheduled to see the physician per month, the actual number that attended the MOP clinic and those that were absent. It also captures the number of defaulters that responded after a call-out and those who remained chronically non-compliant with the MOP clinic schedule even after several reminders. In this survey, the malefemale gender ratio is also taken into consideration. It is also of note that extra MOP patients who were not originally scheduled for the months but utilized the MOP clinic are also captured in this survey.
Background of the study
Quality Improvement Process is a positive step taken to assess the standard of practice in any discipline. In Nursing Profession, assessing the quality of patient care is a means to improving the standard of care, which will at the same time serve as a guideline to achieve Quality Assurance in Nursing Practice. A nursing care standard is a descriptive statement of desired quality against which to evaluate nursing care. It is a guideline. A guideline is a recommended path to safe conduct, an aid to professional performance. A nursing standard can be a target or a gauge. When used as a target, a standard is a planning tool. When used as a gauge against which to evaluate performance a standard is a control device[1-2].Therefore, assessing the Compliance with Medical Outpatient Clinic attendance and therapeutic regimen is a vital therapeutic planning tool for ensuring quality patient care outcome, and also a control device for evaluating the standard of care administered by the health care providers.
Purpose/aim of the study
1. This MOP Quality Improvement survey is done to achieve the following purposes:
2. To monitor MOP compliance rates and therapeutic regimens in Hypertensive/Diabetic clients.
3. To capture defaulters and help them to overcome noncompliance.
4. To determine the male-female gender ratio in MOP clinic attendance.
5. To assist the Physician in the management process of the clients.
6. To evaluate the quality of care and treatment outcome.
7. To facilitate the research process in the management of MOP clients in CHOW.
Statement of the problem
The researcher discovered over time that the Medical Out- Patients (MOP) clinic attendance was always fluctuating and nonconsistent. People were not following their clinic appointments as planned for them by the managing physician. During annual medical screening for staff and dependents of our establishment, many of such clients were found to have had their laboratory and other diagnostic parameters frequently deranged. As part of the contributions to the solution to this problem, the researcher saw the need to embark on this research to establish possible factors affecting the non-compliance with clinic attendance among the MOP clients and suggest lasting solutions to the problem.
Research questions
1. Why is there Non-Compliance to Clinic Attendance?
2. What possible factors are responsible for clients’ noncompliance with clinic attendance?
3. What is the compliance ratio between the male and female clients utilizing the MOP clinic in CHOW?
4. What are the adverse effects of MOP non-compliance on the hypertensive/diabetic clients?
5. How can such adverse effects of non-compliance be overcome?
Broad objective of the study
To explore various forms of clinic non-compliance and find lasting solutions to the problems they generate in the treatment outcome.
Specific objectives of the study
1. To investigate the common forms of clinic non-compliance among MOP clients.
2. To familiarize oneself with the normal and abnormal clinical parameters in MOP clients.
3. To ascertain the possible factors affecting clinic compliance among MOP clients.
4. To determine the male-female gender ratio of MOP clinic attendance
5. To explore and analyze ways of overcoming the challenges of non-compliance among the work force
6. To prevent the recurrence of such challenges in the future.
Scope and limitations of the study
The research project would have been extended to other clinics, such as Infant Welfare Clinic, Gynecological Clinic, Orthopedic Clinic, Mental Health Clinic, Neurology Clinic, Surgical Outpatient Clinic, amongst others, besides MOP clinic. However, the researcher decided to concentrate on the MOP clinic attendance, as Hypertension and Diabetes Mellitus are the major causes of morbidity and mortality in the society today.
Significance of the study
1. The study will serve as an eye opener to the health professionals on the effects of non-compliance on the overall health of the clients.
2. The study will also enlighten the clients on the problems of non-compliance with clinic attendance and therapeutic regimen.
3. It will enable individual clients attending the MOP clinic to make informed decisions on their care.
4. It will serve as a reference point for further research on the subject.
Definition of terms
1. Assessment: The act of judging or forming an opinion about somebody or something.
2. Client: A person who uses the services of a professional person or organization.
3. Clinic: A building or part of a hospital where people can go for special medical treatment or advice.
4. Compliance: The practice of obeying rules or requests by people in authority.
5. Diabetes Mellitus: A disorder of the endocrine system characterized by polyuria, polydipsia, polyphagia and weight loss.
6. Hypertension: Blood pressure that is persistently higher than normal value for that individual.
7. Improvement: The act of making something better.
8. M O P Clinic: Medical Out Patient Clinic.
9. Process: Series of things done to achieve a particular result.
10. Quality: The standard of something when it is compared to others like it.
11. Quality Improvement Process: Series of steps taken to elevate the standard of something from its previous state.
12. Regimen: A set of rules about food and exercises or medical treatment that you follow in order to stay healthy or improve your health.
13. Therapeutic Regimen: A set of rules governing food, exercise or medicine in order to promote or improve health.
14. Therapy: The treatment of a physical problem or illness.
Summary of chapter one
Chapter one contains an introductory aspect of Quality Improvement process as it affects the overall health of the clients. The statement of the problem is also made known, purpose and objectives of the study highlighted, significance of the study enumerated while the scope and limitations of the study were equally stated. To further understand the text, definition of terms is also included.
Review of Literature
Introduction
Quality Improvement Process can be defined as Series of steps taken in order to elevate the standard of something from its previous state. In health care, Quality Improvement (QI) Process can be defined as all activities that contribute to defining, designing, assessing, monitoring, and improving the quality of healthcare. These activities can be performed as part of the accreditation of facilities, supervision of health workers, or other efforts to improve the performance of health workers and the quality of health care services.
Health care improvement project
The year 1990 saw the Quality Assurance Project, now the Health Care Improvement Project (HCI), which developed tools and methods based on quality management principles used in industry and applied them in the context of developing country health systems. There are four main principles developed out of this experience to guide quality assurance in health care. These are highlighted as follows:
Focus on the client: All health care services should be patientcentered. Without the patient, there is no health care facility. Therefore, all services should be designed in such a way that they could meet the needs and expectations of the clients and communities. Focusing on the client also involves gathering useful information about the client, assessing the individual needs and meeting the needs as identified. When the client is always a priority in health care delivery system, such that individualized care is rendered, with special attention to the client’s needs, the client is usually happy and goes home satisfied. Because satisfactory treatment is given, the client will have the courage to return to the hospital for follow-up care.
Focus on systems and processes: Providers must understand the service delivery system and its key service processes in order to improve them.
Focus on measurement: Data are needed to analyze processes, identify problems, and measure performance.
Focus on teamwork: Quality is best achieved through a team approach to problem solving and quality improvement.
Continuous quality improvement process
Continuous quality improvement process involves series of steps taken to ensure a constant, harmonized and sustainable evaluation of a system. Such a process focuses on a specific area that determines the methods for improvement, making specific changes and measuring success or failure of such a process until the highest level of improvement has been achieved. In order to achieve success in this process, certain parameters have to be set to measure the improvement process. These may include Customer Feedback Survey, which is simply measured through the individual responses to the questionnaires, or Medical Outpatient Compliance tracking which is measured through scheduled appointment and attendance records.
Process improvement plan
This is a planned effort to assess the existing modes of operation in a system, identify gaps, make efforts to mitigate such gaps and improve the quality of outcome of such a process, as well as increasing and maintaining the overall standards of quality improvement process. In order to achieve success in this regard, certain goals must be set, and steps put in place to achieve them. By so doing, it is easy to understand those steps that yield positive results to the clients, and those that are of little or no value to them. Having understood that all the quality improvement process plans are supposed to be patient-centered, the measuring parameters must be such that foster customers’ satisfaction and value. Those steps or parameters that add no value to the customers overall health outcome should be removed or discouraged.A successfully implemented process improvement plan radically modifies the structure and the performance of any health facility and is immediately reflected in the customer satisfaction and loyalty, in addition to the increased outcome of quality health care and client turn-out due to higher level of customer satisfaction.
Characteristics of efficient process improvement plan
An efficient process improvement plan clearly identifies the target base, either internal (e.g. employees) or external (e.g. clients) and focuses on discovering specific areas in which the health facility may improve, as well as the ideal outcome of the changes. It also displays unlawful steps to improve according to the findings and changes over time to stay relevant. A process improvement plan allows an establishment to conduct research and evaluations on a segment of its operation to ensure that it is functioning efficiently and making the necessary improvements to keep up with its competitive and changing environment. Creating a plan begins with defining its purpose by identifying a single focus, such as the satisfaction of customers with a health care management or the method the managing team uses to render services to its clients. By outlining the scope of the plan, the health care team members can more accurately monitor behaviors and tactics and develop more realistic and helpful suggestions for improvement. The plan must also capture the current situation within the hospital setting and explain why it is not effective. This allows the establishment to avoid repeating the same mistakes and develop strategies for moving in new directions. For example, if the goal of the document is to increase the compliance rate of Hypertensive/Diabetic clients, and the research finds that the compliance rate is poor, the improvement plan lists how the existing process fails and explains what the facility needs in a new process to ensure improvement in the quality of care and to discourage non-compliance among the clients.
Ways to approach quality improvement process
Quality Improvement Process requires some workable health care delivery systems to improve patient’s experience. But this does not go without facing some challenges which may reflect the need for changes in behavior and practices at different levels of operation in the health care industry.
Health care organizations operate under established principles and clinical guidelines which the health care providers are already familiar with. Through the guidelines, the concept of Microsystems is utilized to focus on the following areas:
1. Patient’s responsibilities and experience.
2. Overview of quality improvement process.
3. Some models of quality improvement, and Tools and techniques to be utilized in addressing various aspects of patient’s experience.
Process improvement steps
According to the Business Process Improvement Steps developed by HEFLO (2015 – 2018), there are seven (7) steps you need to follow to take the Business Process Improvement status of any organization to the next level. These are highlighted as follows:
Map the process
1. Mapping is crucial.
2. We can only improve what we can understand.
3. Decide which process you want to improve and detail its stages by using a flow or diagram.
4. Identify the areas that need improvement and prioritize.
Get the team on board
1. Always communicate with the people involved.
2. Workshops and management meetings are a great way to prepare your staff for the changes that are coming.
3. Make sure that everybody understands their role in the project.
4. If everybody sees how these improvements will affect their work, the client’s satisfaction, the productivity, and profitability, it is easy to get excited and ready to work. For this, communicate clearly and set the example.
Design the process
1. Now it is time to put together the information you gathered on the mapping stage with the people involved.
2. Determine how you are going to implement the improvements desired.
3. A brainstorming meeting could be a good way to start since the people that handle the process will have a good idea about how the changes should be conducted.
4. Try to set scenarios and see how the ideas will translate in a real-life situation.
Implement the Changes
1. This business process improvement step is the start of the actual change.
2. It is the moment when the new process is put into practice, and it has to be monitored from the beginning.
3. The employees, health care providers, suppliers and managers involved must set the example and embrace the changes from the start.
Execute the process
1. Always check for possible bottlenecks and improvement points.
2. Now we see if the changes visualized work in real life.
3. It is important to get feedback from all people involved and gather data.
Monitor
1. This is better if done through the entire project.
2. Monitoring is a key business process improvement step, since is by it that we can check what works and does not work, what can be even more improved, what did not need change at the first time.
3. Monitoring involves data gathering, and it is crucial that the information is based on numbers and facts, because only that will give us a real vision of the health facility.
Optimize
1. Time to start all over again! After we execute and monitor, surely there will be new changes to implement, setting the start of a new project.
2. There is always room for improvement within a process or organization.
3. If this is built into the company’s culture and valued by everybody, the benefits will appear, and the business will thrive.
4. As we saw, the business process improvement steps are cyclical, and must be done endlessly in order to work. Always look for a reliable software when implementing them, since the results are worthwhile.
Microsystem as a concept
It is pertinent to know that the Health Plans and Medical Groups can approach the improvement process through thinking of the organization as a system, and particularly as a group of interrelated microsystems. Microsystem here represents smaller units of care givers, administrators and other members of the health team who participate in the delivery of health care services. The concept of microsystems in health care delivery came into existence as a result of the research findings which indicates that the success of a larger unit largely depends on how much attention is given to the smaller functional units of the organization, which actively carry out the activities that bring about interactions between the organization (health facility) and the customers (clients). Examples of Microsystems in the hospital include the Doctors, the Nurses, the Lab Scientists/Technicians, the Pharmacists, the Radiologists/ Radiographers, the Medical Records Staff, the Front Desk officers, etc.
The goal of Microsystems is to emphasize the need to always pay special attention to the smaller functional units whose core activities bring forth excellent clinical and patient-centered care to the clients themselves, leading to exceptional customer satisfaction. Understanding the core functions of the microsystems also makes it possible to involve the best hands that could possibly deliver a particular service to the clients in order to achieve greater success in service delivery.
Quality improvement cycle and its significance
Quality Improvement Models may vary in approach or methods. However, the general principle underlying this process is that it is a continuous activity and not a one-time process. Whenever a change is initiated in the health care delivery system, there is bound to be issues or challenges to be addressed along with the process. Through the experiences acquired while addressing such challenges, the lessons learned are used to shift strategies and try new interventions. In other words, no process is ever perfect; therefore, in every procedure, there is room for improvement through the experiences gathered as a result of the challenges encountered. The fundamental approach that serves the basis for most process improvement models is known as the PDSA Cycle. PDSA stands for Plan, Do, Study, Act.
This is a systematic series of gaining value learning and knowledge for the continual improvement of a product or process (Quality Improvement Guide, 2012).
According to the Quality Improvement Guide (2012) prepared by the Health Quality Ontario, the rapid cycle improvement process is implemented as follows:
The PDSA Cycle (Figure 1)
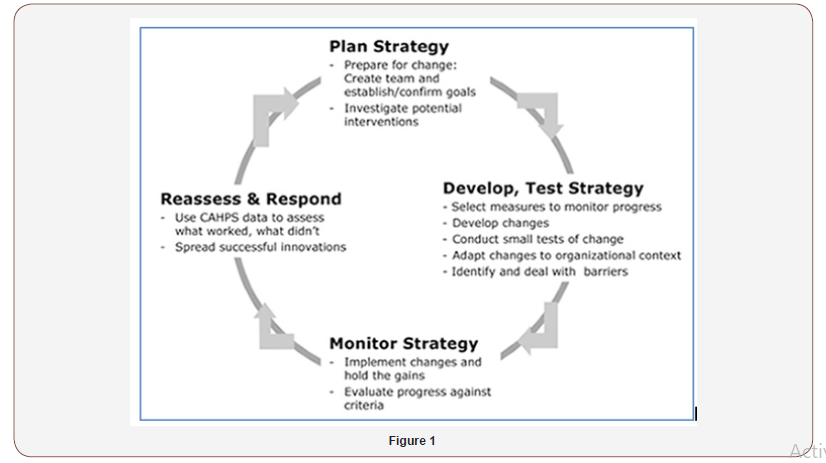
The cycle above is made up of four parts: namely, Plan, Do, Study and Act.
1. Plan: This step involves identifying a goal or purpose, formulating an intervention or theory for change, defining success metrics and putting a plan into action.
2. Do: This is the step in which the components of the plan are implemented.
3. Study: This step involves monitoring outcomes to test the validity of the plan for signs of progress and success, or problems and areas for improvement. Short cycle, small scale tests, coupled with analysis of test results, are helpful because microsystems or teams can learn from these tests before they implement actions more broadly.
4. Act: This step closes the cycle, integrating the learning generated by the entire process, which can be used to adjust the goal, change methods, or even reformulate an intervention improvement initiative altogether.
5. Following this PDSA cycle strictly ensures that all staff involved in the Quality improvement Process participate actively in assessing the problems and offering useful suggestions aimed at finding a lasting solution to the problems identified. This bottom up approach enables every member of the system to embrace change as much as possible.
Characteristics of quality assurance (Qa) and quality improvement (Qi) as processes (Table 1).
Table 1: The PDSA Cycle.

Concept of standard precautions
In carrying out a research, a lot of precautionary measures are put into consideration. In this research exercise, confidentiality is strictly observed to protect those participating in the research study. This is important in order to adequately recognize the place of individuality, integrity and discipline. Therefore, the rules governing the research process were adequately observed. No name of individual client was mentioned throughout the study, and every step taken is for educational purpose and improvement in subsequent studies.
Theoretical framework
The theory of goal attainment was developed by Imogene King in the early 1960s. it describes a dynamic interpersonal relationship in which a patient grows and develops to attain certain life goals. The theory explains that factors which can affect the attainment of goals are roles, stress, space and time. The theoretical element identified in this study includes the inability of the Medical Outpatients to comply with their scheduled appointments with the physician as and when due, most probably due to Time factor, Space scheduled, Roles at work or other commitments.
It is becoming obvious that most clients miss their scheduled medical appointment with their physician due to a number of factors similar to those identified by Imogene, King in her theory of Goal Attainment, the reason for which the researcher embarked on this study. The theoretical understanding of the potential ugly consequences of non-compliance with medical appointment and therapeutic regimens motivated the researcher to embark on this study to explore possible factors associated with their noncompliance issues and offer possible suggestions to mitigate such.
Hypotheses
The two hypotheses deduced from the above study are as follows:
Null Hypothesis: Non-compliance with medical appointment has no adverse effect on health management.
Alternate Hypothesis: Non-compliance with medical appointment has negative effects on health management.
Summary
In this chapter, a review of literature was carried out, where vital areas such as Healthcare Management Project, Continuous Quality Improvement Process, Process Improvement Plan, Characteristics of Efficient Process Improvement Plan, Ways to Approach Quality improvement Process, Process Improvement Steps, Microsystem as a Concept, Characteristics of Quality Assurance and Quality Improvement, as well as Quality Improvement Cycle and it Significance were treated sufficiently. The concept of standard precautions, Theoretical framework and Hypotheses were not left out.
Materials and Methods
Research design
Retrospective study design was selected by the researcher for this project with the use of Electronic Health Records to track those that attended the clinic and Medical Outpatient Schedule note book to compare and track those scheduled but missed their appointments. This assisted the researcher to establish the compliance rates and the comparison between the gender ratio of compliance within the specified period under review.
Setting of the study
All hypertensive/diabetic clients who are direct employees with the corporate organization, including their spouses and dependents are eligible to access medical care in our facility. These clients also include other direct employees of the corporate organization working in other locations.
Research population
The Research population comprises male and female clients who are hypertensive and/or diabetic among the employees, spouses and dependents of the establishment.
Sample population
The sample population includes at least one hundred and fifty (150) eligible clients who are hypertensive and/or diabetic per month, drawn from the various locations under review.
Sample and sampling technique
The sampling technique employed for this research project was simple random sampling technique. For the purpose of this research, Medical Appointment Schedule Note Book and Electronic Health Records were used to obtain the sample population. All hypertensive/diabetic males or females scheduled for MOP each month were utilized for this study; the sampling was not restricted to any special group of persons.
Instruments for data collection
The instruments for data collection were Electronic Health Records and Medical Appointment Schedule Note Book.
Validity and reliability of the instrument
Reliability is defined as the extent to which an assessment tool produces stable and consistent results. Validity refers to how well a test measures what it is meant to measure. The Reliability and Validity of the instruments for data collection, used for this study, was maintained throughout the period under review. The same number of clients scheduled physically were also tracked through the Electronic Health Record (EHR) and the MOP Schedule notebook. This enabled the researcher to identify those clients not scheduled for that month but accessed the clinic as Extra MOP per month.
Method of data collection
A daily record of those clients who were scheduled for MOP clinic and those who actually accessed the clinic was kept to keep track of those who missed their appointments and those who remained chronically non-compliant even after a call out reminder. Every document collected was treated with utmost confidentiality. The statistical calculations were done using MYSTAT Statistical Package as stated under Procedure for Data Analysis.
Procedure for data analysis
The data were presented and organized from the EHR and Medical appointment schedule note book. The data were summarized on frequencies and percentages, using the formula below due to its simplicity. F/T x 100/1 Where F represents frequency of particular clients and T represents the total number of clients.
Ethical Considerations
While carrying out the research, the following were considered:
1. Institutional approval to carry out the research in the target population was obtained.
2. Participants’rights were protected.
3. Privacy and confidentiality were maintained throughout the study.
4. Respondents were clearly informed about the study in order to gain their consent.
5. The research involved no risk to the respondents
Limitations of study
This research work would have been extended to the public hospitals in Delta State for comparative analysis. However, the research study was done only in CHOW Hospital due to logistic challenges and limited time to submit the final work done.
Summary of chapter three
In chapter three, research materials and methodology, in which Research design, setting of the study, Research population, Sample population, Sampling technique, Instrument for data collection, Validity and Reliability of the instrument, Method of data collection, Procedure for data analysis, Ethical considerations and Limitations of the study were clearly explained.
Results of Findings
Data analysis
This describes the presentation, findings, analysis and interpretations of the study. A comparative study of the gender distributions with regards to the MOP Compliance rates of hypertensive/diabetic patients was also explained for clarity and elimination of doubts. The statistical calculations were done using MYSTAT Statistical Package due to its simplicity. This is summarized on frequencies and percentages, using the formula: F/T x 100/1 Where F represents frequency of particular patients and T represents the total number of such patients within the period under review.
Results presentation
A detailed result of the MOP Compliance Tracking of the hypertensive/diabetic patients throughout the three years under review were captured and analyzed as follows:
Mop compliance Tracking of hypertensive/diabetic patients for 2015
(Table 2-6) (Figure 2-5)
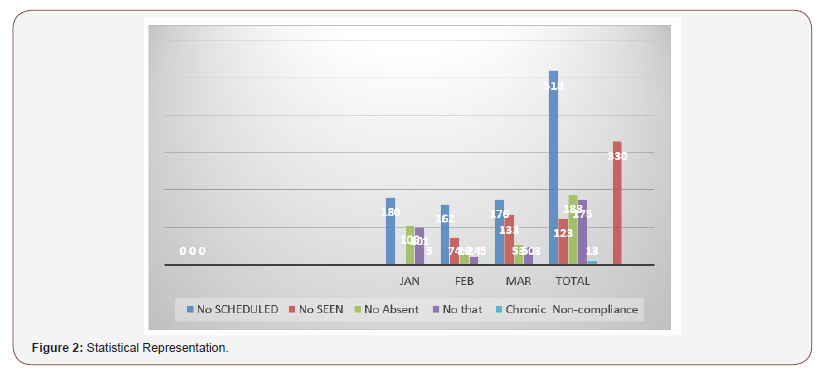
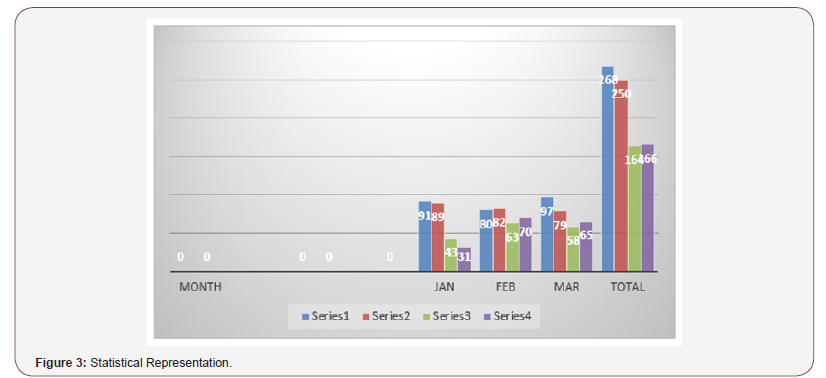
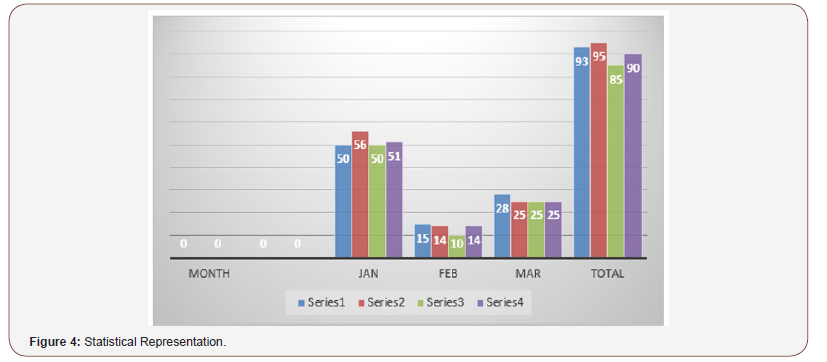
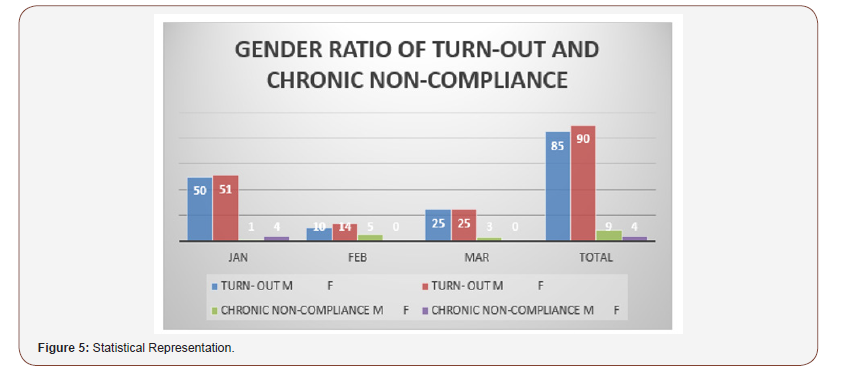
Table 2: Quarter 1: January - March 2015.
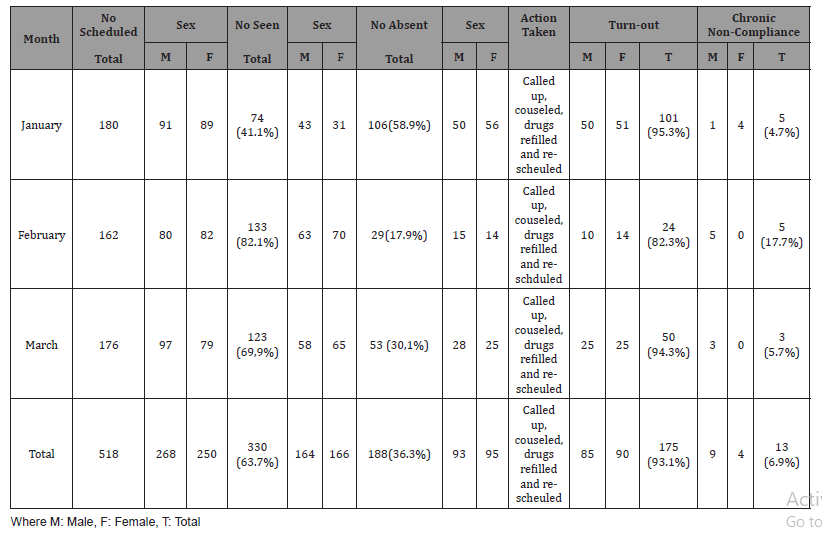
Table 3: Comparison of patients scheduled, those seen, and follow up on non-compliance.
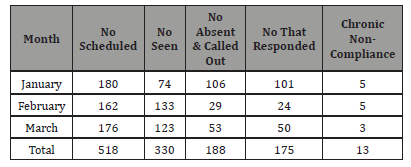
Table 4: Comparison of the male-female gender ratio scheduled and those seen.
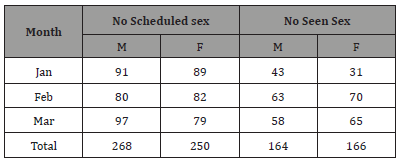
Table 5: Comparison of patients absent and those that responded after a call-out.
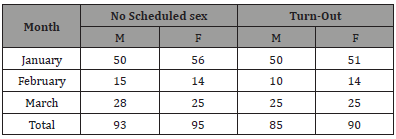
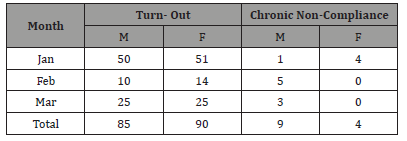
Table 6: Comparison of those that turned out and chronically noncompliant patients.
Results, interpretations and recommendations
1. The set target for MOP for the 3 years under review is at least 90% compliance
2. It is worthy of note that the number of clients who utilize the MOP clinic is sometimes greater than the number scheduled per month for the following reasons:
3. Some clients based in other locations, such as Lagos, Port Harcourt, etc. make use of MOP clinic in Warri hospital
4. People also migrate from CHOW Retainership Health Centers to Warri Hospital
5. Newly diagnosed MOP clients picked up from medical screening are usually referred to the MOP Clinic
6. Some People are seen twice or more in one month due to unfavorable parameters.
Report summary for first quarter of 2015
1. In the month of January 2015, 180 clients were scheduled for MOP clinic, 74 clients responded and 106 were absent. The same 106 patients were called up, out of which 101 turned out.
2. In February 2015, 162 clients were scheduled for MOP clinic, out of which 133 responded. A total of 29 clients were absent. The 29 absentees were called up but only 24 responded.
3. The month of March 2015 had a total of 176 clients registered for MOP. However, 123 clients responded and 53 out of the number of clients scheduled were absent. This same 53 were called up and 50 clients responded.
4. In the first quarter of 2015 (January-March), a total of 518 patients were scheduled for Medical Out-Patient (MOP) clinic, out of which 330 (63.7%) responded, and 188 were absent. The same number of people was called up, out of which 175 (93.1%) of those clients turned out and 13 (6.9%) remained chronically non-compliant.
5. During counseling sessions with them, some clients attributed missing their MOP appointments to job demand, such that their normal crew would just be changed from time to time, making majority of them to remain at work during the supposed time-off periods meant for their MOP clinic.
6. It was also observed that some of the clients who missed their appointments could not attribute their failures to any reason but said they just forgot their appointment dates.
7. Others admitted their missed appointments were due to unforeseen family circumstances.
8. They were all counseled and health-educated individually during visits to the clinic on the importance of keeping to their MOP appointments, ways to manage their conditions and prevent complications.
9. Although the turn-out after a call-up was encouraging, it is obviously on recorded that January witnessed the largest number of missed appointments when compared to other months of the first quarter. (Table 7-12) (Figure 6-10)
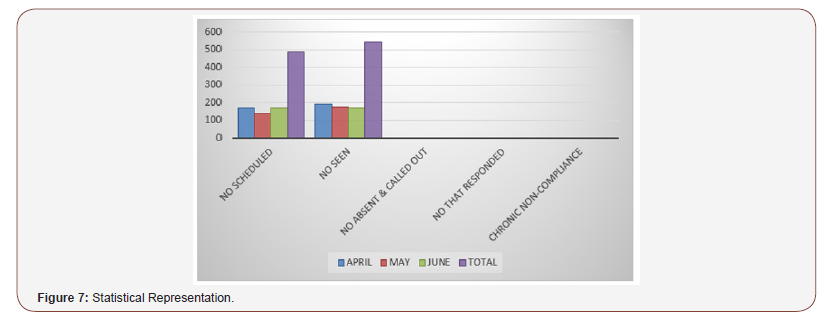
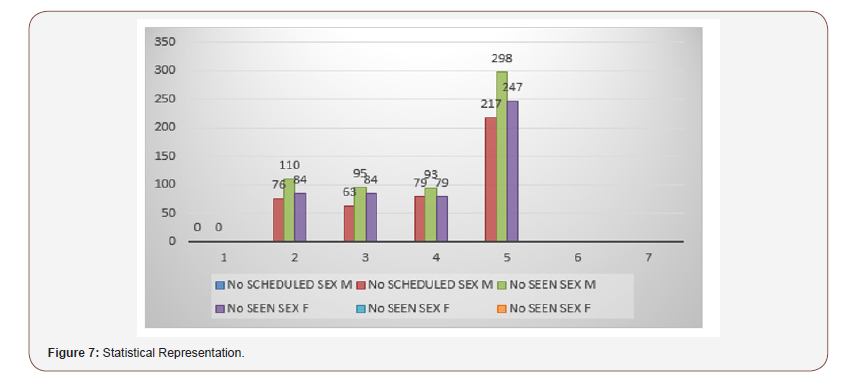
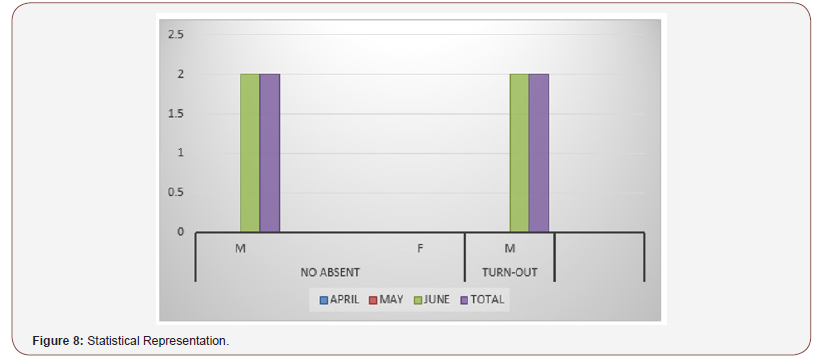
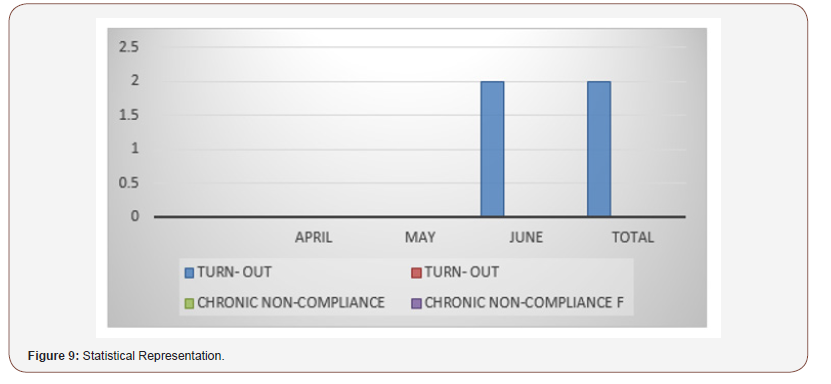
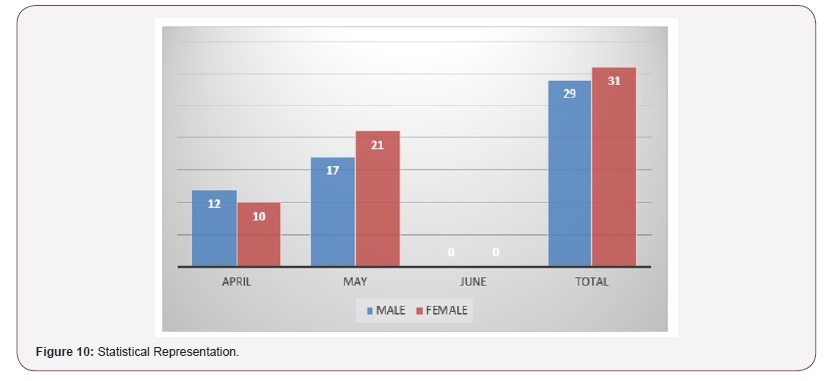
Table 7: Quarter 2: April - June 2015.
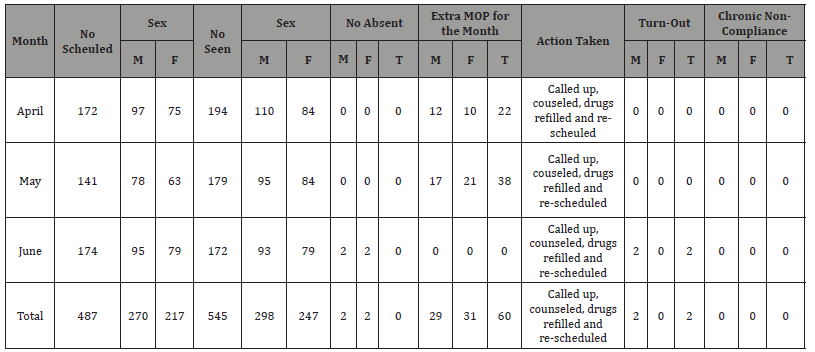
Table 8: Comparison of patients scheduled, those seen, and followed up on non-compliance.
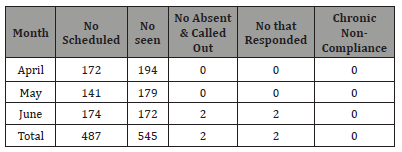
Table 9: Comparison of the male-female gender ratio scheduled and those seen.
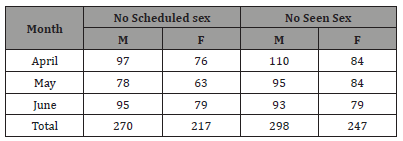
Table 10: Comparison of patients absent and those that responded after a call-out.
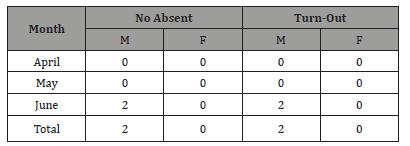
Table 11: Comparison of those that turned out and chronically noncompliant patients.
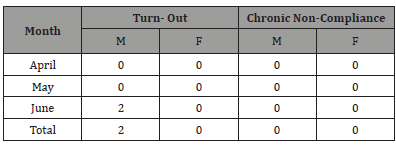
Table 12: Comparison of extra mops by gender for the quarter.

Report summary for second quarter of 2015
1. In the month of April 2015, 172 clients were scheduled for MOP clinic but total of 194 clients attended the clinic. In other words, the extra number of MOP clients that visited the clinic in April was 22. Therefore, there was an increase in MOP clients by 12.8% in April.
2. In May 2015, 141 clients were scheduled for MOP clinic, 179 responded, representing 126.9% of the total scheduled patients. In other words, an excess of 26.9% of MOP clients were seen in addition to the scheduled patients. No record of absenteeism or non-compliance in the month of May 2015.
3. The month of June 2015 had a total of 174 clients registered for MOP. However, 172 clients responded and two (2) were absent, representing 1.15% of the total number of clients scheduled for June 2015. This same two (2) were called up and same responded. No record of chronic non-compliance.
4. In the first quarter of 2015 (January – March), a total of 518 patients were scheduled for Medical Out-Patient (MOP) clinic, out of which 330 responded. The same number of patients was called up. However, in the second quarter (April – June), a total of 487 clients were on the scheduled list, but a total of 545 clients utilized the MOP clinic, bringing an excess of 60 clients representing 12.3% seen in addition to the scheduled ones. (Table 13-18) (Figure 11-15)
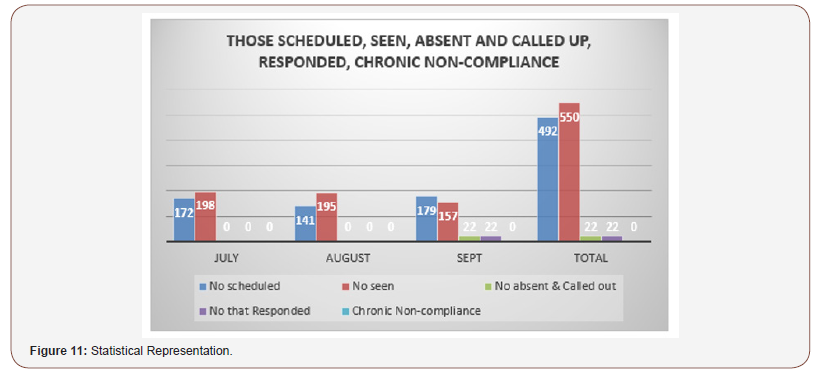
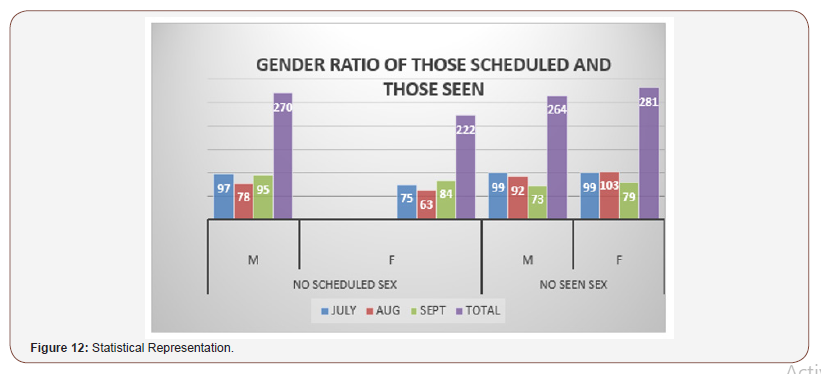
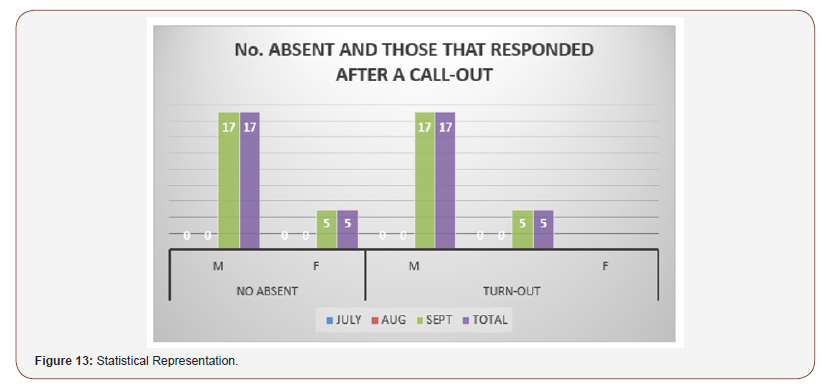
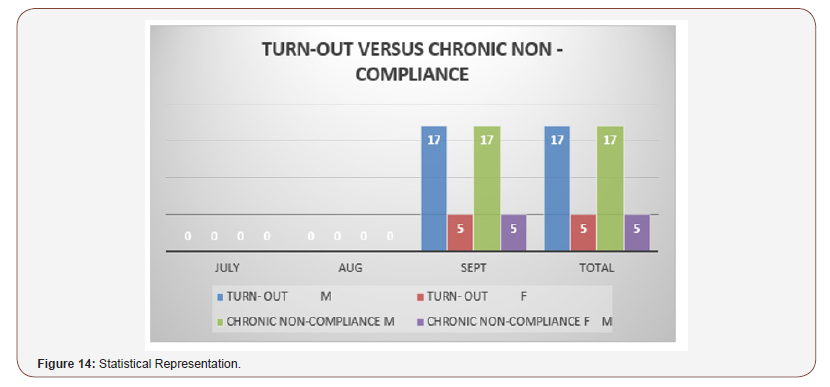
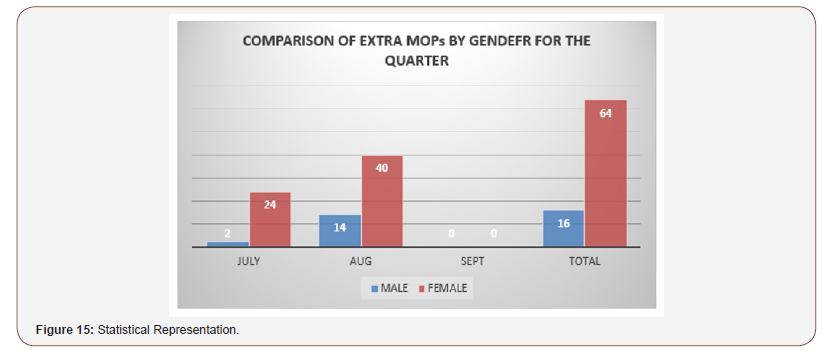
Table 13: Quarter 3: July - Sept 2015.
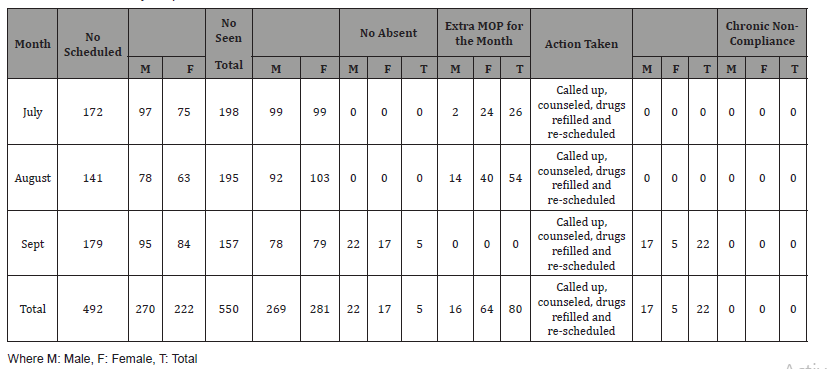
Table 14: Comparison of patients scheduled, those seen, and followed up on non-compliance.
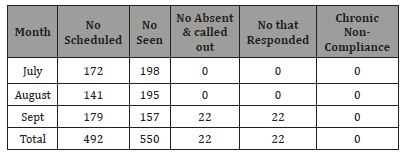
Table 15: Quarter 3: July - Sept 2015.
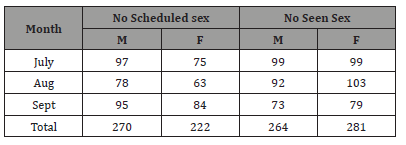
Table 16: Comparison of patients absent and those that responded after a call-out.
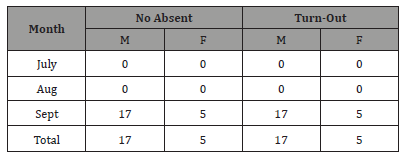
Table 17: Comparison of those that turned out and chronically noncompliant patients.
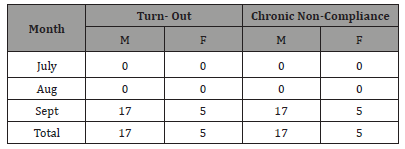
Table 18: Comparison of extra mops by gender for the quarter.

5. Although, there were still some challenges in changing the MOP schedules sometimes due to unplanned changes in employees’ duty rosters and locations, there was no record of non-compliance in the second quarter. This shows people are becoming more conscious of their health.
6. Meanwhile, health-education and counseling are still ongoing, as we contact them, with emphasis being laid on the importance of compliance with MOP clinic schedule, medication administration, and dietary and lifestyle modifications.
7. It is also on record that January 2015 recorded a low turn-out of patients, compared to the number of patients scheduled. On further investigation through one-onone interviews, about 70% of them claimed that it was not their portion to start the new year with hospital visits, 25% still attributed their absenteeism to sudden changes in their work crews. Only 5% could not give any reasonable excuse for their missed appointments.
Report summary for third quarter of 2015
1. In the month of July 2015, 172 clients were scheduled for MOP clinic but total of 198 clients attended the clinic. In other words, the extra number of MOP clients that visited the clinic in July was 26. Therefore, there was an increase in MOP clients by 15.1% in July.
2. In August 2015, 141 clients were scheduled for MOP clinic, 195 responded, representing 138.3% of the total scheduled patients. In other words, an excess of 38.3% of MOP clients were seen in addition to the scheduled patients. No record of absenteeism or non-compliance in the month of August 2015.
3. The month of Sept 2015 had a total of 179 clients registered for MOP. However, 157 clients responded and twenty-two (22) were absent, representing 12.3% of the total number of clients scheduled for Sept 2015. This same twenty-two (22) clients were called up and same responded. No record of chronic non-compliance.
4. In the first quarter of 2015 (January – March), a total of 518 patients were scheduled for Medical Out-Patient (MOP) clinic, out of which 330 responded. The same number of patients was called up. However, in the second quarter (April – June), a total of 487 clients were on the scheduled list, but a total of 545 clients utilized the MOP clinic, bringing an excess of 60 clients representing 12.3% seen in addition to the scheduled ones. In the third quarter of 2015 (July – Sept), a total of 492 clients were scheduled for MOP clinic, but 550 clients were seen. Thus, an additional number of clients that visited the MOP clinic in this quarter was 80, representing 16.3% of the total scheduled patients for that quarter.
5. Although, some few challenges in rescheduling patients for MOP clinic were still encountered due to unplanned changes in employees’ duty rosters and locations, 3rd quarter did not witness any record of non-compliance, confirming increased clients’ awareness of their health.
6. Meanwhile, health-education and counseling are still ongoing as we contact them, with emphasis on the importance of compliance with MOP clinic schedule, adherence to prescribed medication administration, and dietary and lifestyle modifications. (Table 19-23) (Figure 16-19)
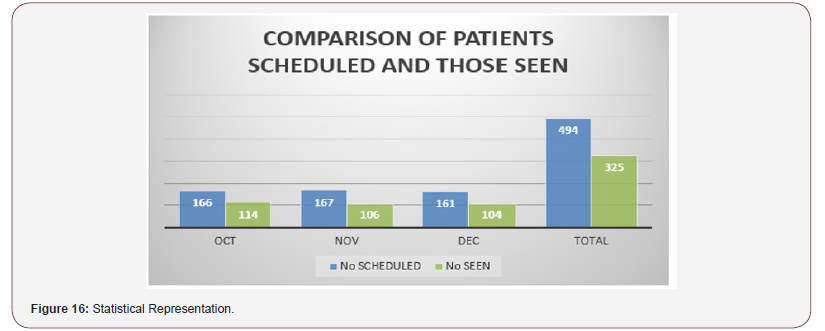
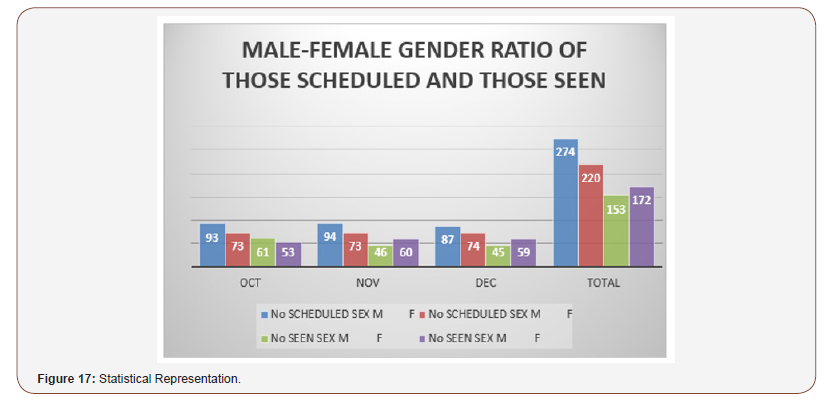
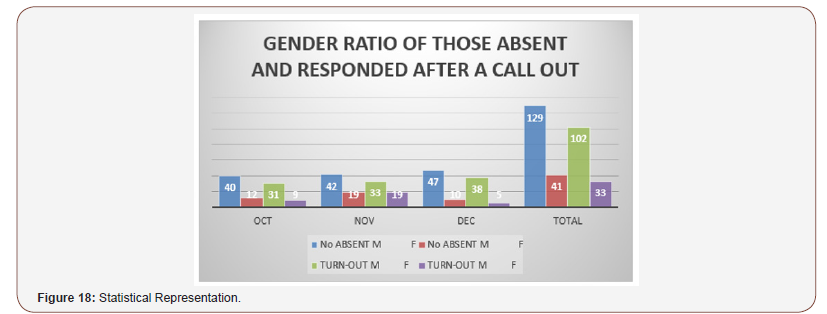
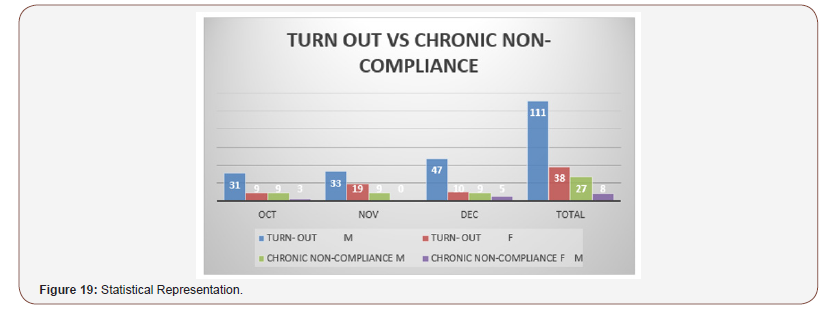
Table 19: Quarter 4: October - December 2015.
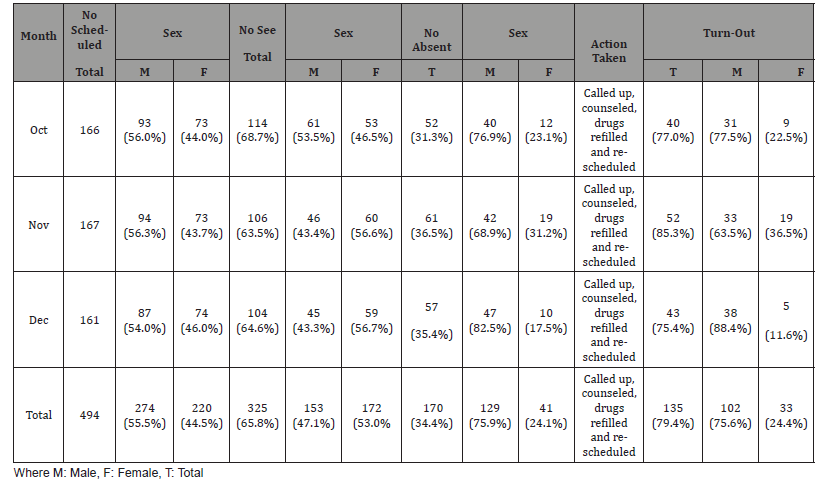
Table 19: Quarter 4: October - December 2015.

Table 19: Quarter 4: October - December 2015.

Table 19: Quarter 4: October - December 2015.

Table 19: Quarter 4: October - December 2015.

Table 20: Comparison of patients scheduled and those seen.

Table 21: Comparison of the male-female gender ratio scheduled and those seen.
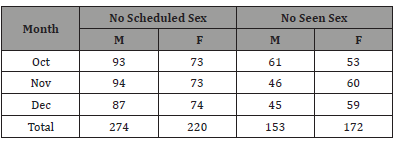
Table 22: Comparison of patients absent and those that responded after a call-out.
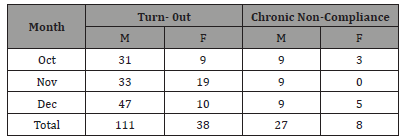
Table 23: Comparison of those that turned out and chronically noncompliant patients.
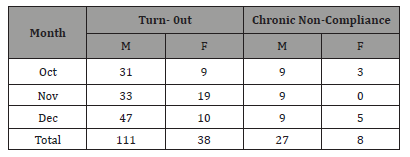
Report summary for fourth quarter of 2015
1. In the month of October 2015, a total of 166 clients were scheduled for MOP but 114 (68.7%) were seen. 52 clients, representing 31.3% were absent; out of these 52 absentees called up, 40 clients representing 77.0% responded.
2. In November 2015, 167 clients were scheduled for MOP clinic, 106 (63.5%) responded, and 61 (36.5%) were absent. Out of the 61 called up, 52 responded, representing 85.3% response after a call-out.
3. In December 2015, a total of 161 clients were scheduled for MOP clinic, out of which 104 responded, representing 64.6%. 57 clients, representing 35.4% were absent. 43 (75.4%) out of 57 called up responded.
4. In the fourth quarter of 2015 (Oct - Dec), a total of 494 patients were scheduled for Medical Out-Patient (MOP) clinic, out of which 325 (65.8%) responded, and 170 (34.2%) were absent. The same number of people absent were called up, out of which 135 (79.4%) turned out.
5. Many of the clients attributed this to the unexpected changes made to their duty schedules which, according to them, was inevitable due to the mass retrenchment/ retirement exercises done across all the locations.
6. Counseling and health education on MOP compliance were intensified, and the affected clients promised to take their health care a priority.
Mop compliance tracking of hypertensive/diabetic patients for 2016
(Table 24-29) (Figure 20-24)
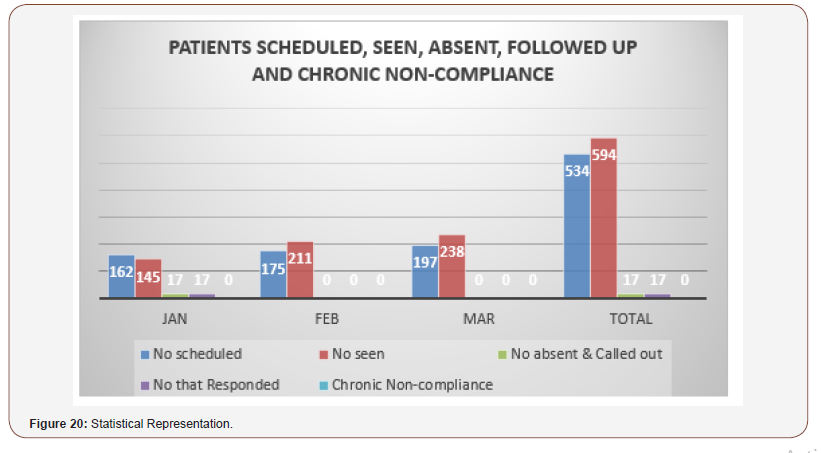
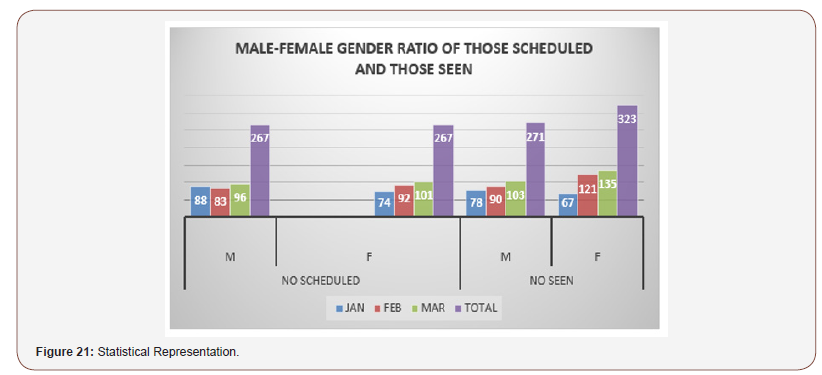
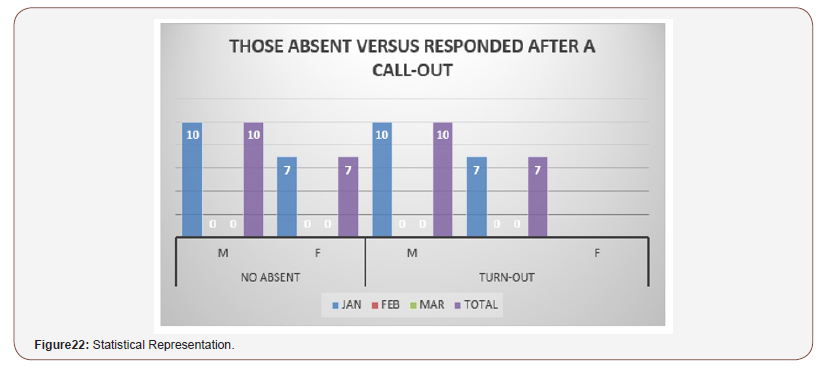
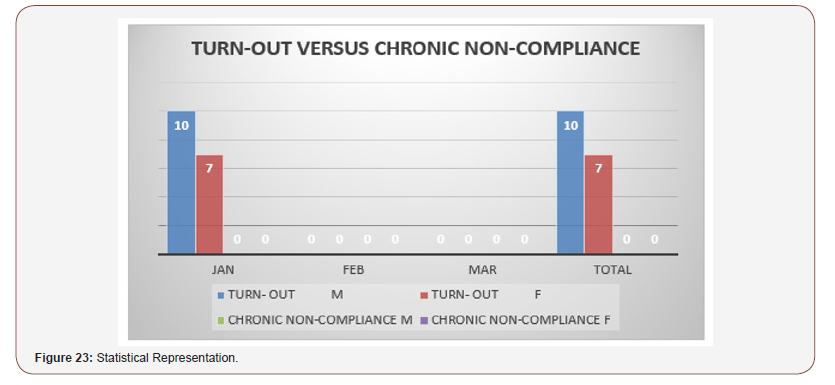
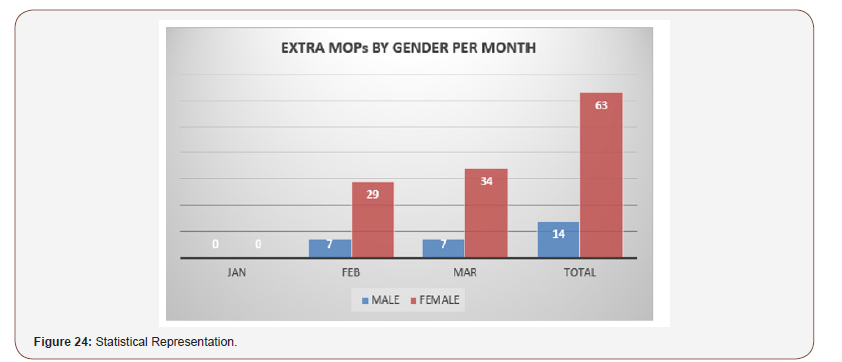
Table 24: Quarter 1: Jan - Mar 2016. patients.
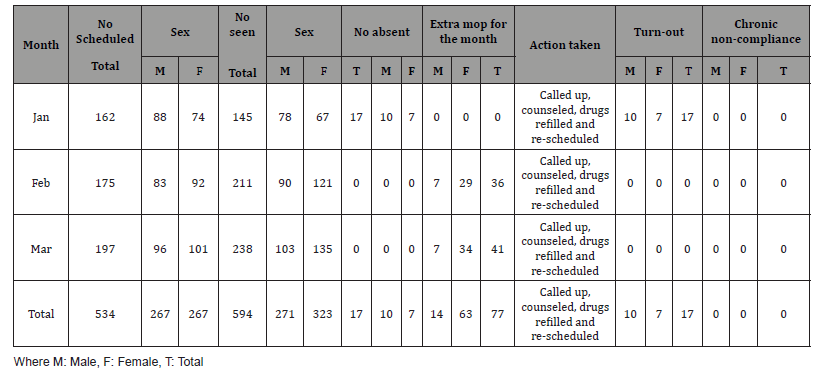
Table 25: Comparison of patients scheduled, those seen, those absent, followed up, and those that are non-compliant. patients.
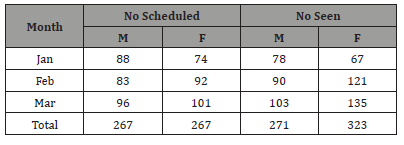
Table 26: Comparison of the male-female gender ratio scheduled and those seen. patients.

Table 27: Comparison of the male-female gender ratio that were absent and those that responded after a call-out. patients.
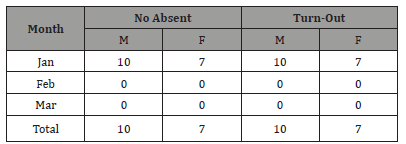
Table 28: Comparison of those that turned out and chronically noncompliant patients..
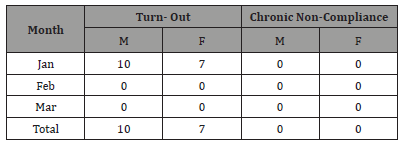
Table 29: Comparison of extra mops by gender per month.

Report summary for first quarter of 2016
1. In the month of January 2016, 162 clients were scheduled for MOP clinic, 145 clients, representing approximately 90% of the total scheduled patients responded and 17 clients, representing approximately 10% were absent. The same 17 patients were called up and all responded accordingly. No chronic non-compliance was recorded for the month.
2. In February 2016, 175 clients were scheduled for MOP clinic, 211 were seen for the month. Since an extra 36 clients were seen in addition to the number scheduled for the month of February, MOP compliance rate was increased by 30.6% above minimum set target. In other words, we recorded 120.6% compliance rate for the month.
3. The month of March 2016 had a total of 197 clients registered for MOP. However, 238 clients were eventually seen, bringing an increase in compliance rate to 30.8% above minimum set target. Thus, 120.8% compliance rate was recorded due to extra 41 clients that utilized the MOP clinic for the month.
4. In the first quarter of 2016 (January – March), a total of 534 patients were scheduled for Medical Out-Patient (MOP) clinic, 594 clients (111.2%) responded and no chronic non-compliance was recorded for the quarter. Thus, a total of 77 clients were recorded as extra MOP clients for the first quarter of 2016.
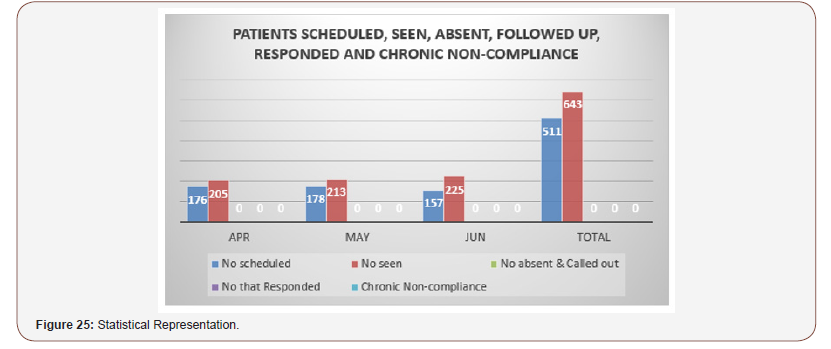
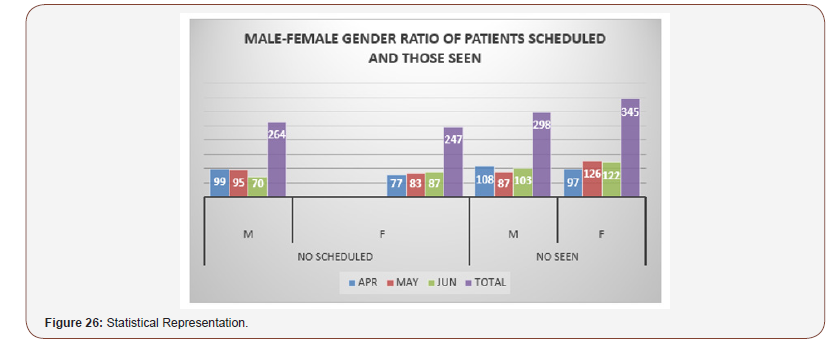
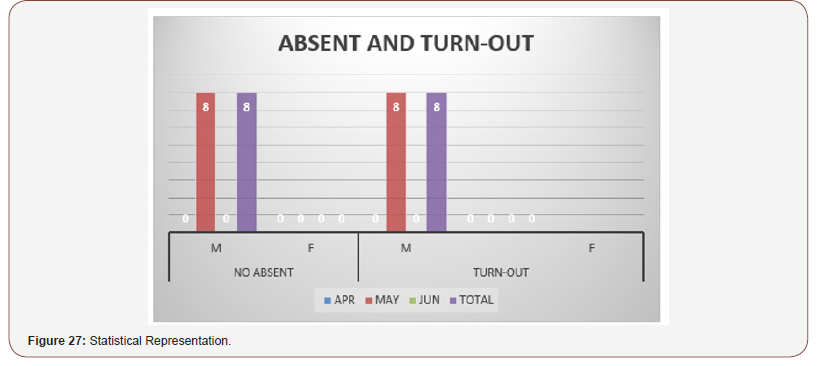

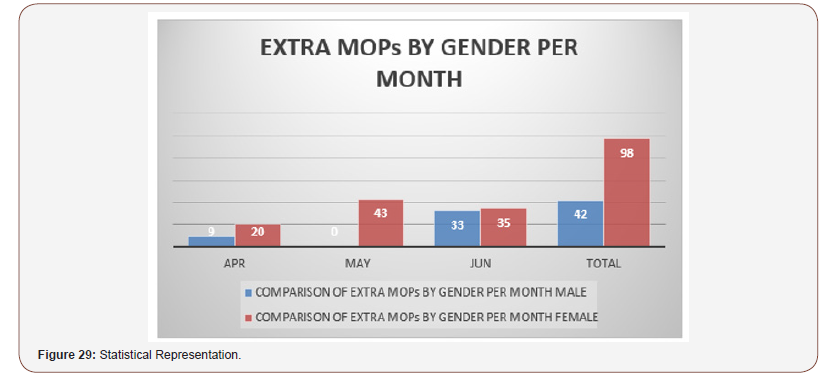
Table 30: Quarter 2: April - June 2016.
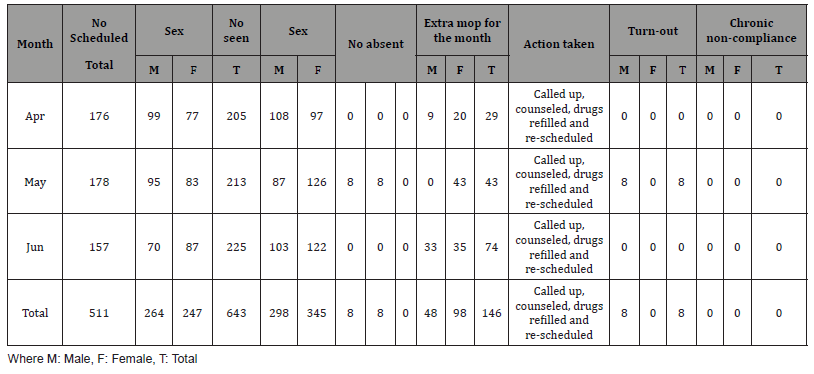
Table 31: Comparison of patients scheduled, those seen, those absent, followed up, and those that are non-compliant.
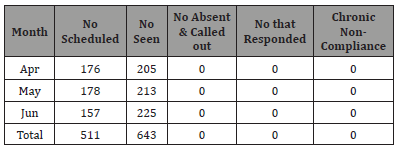
Table 32: Comparison of the male-female gender ratio scheduled and those seen.

Table 33: Comparison of the male-female gender ratio that were absent and those that responded after a call-out.
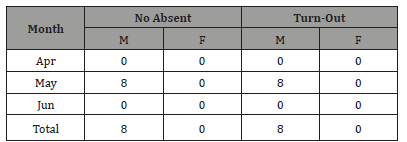
Table 34: Comparison of those that turned out and chronically noncompliant patients.
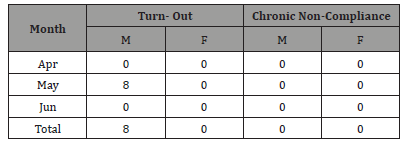
Table 35: Comparison of extra mops by gender per month.

Report summary for second quarter of 2016
1. In the month of April 2016, 176 clients were scheduled for MOP clinic, 205 clients, representing 116.5% of the total scheduled patients responded. In other words, 16.5% of clients attended the MOP clinic in excess of the number scheduled for the month. No client was absent and no chronic non-compliance was recorded for the month April 2016.
2. In May 2016, 178 clients were scheduled for MOP clinic, 213, representing 119.7% were seen for the month. That is, an excess of 19.7% attended the MOP clinic in the month of May 2016. Although eight (8) of the male clients in the month of May 2016 (representing 8.4% by gender), defaulted in their MOP clinics, all eight (8) responded after a call-out, and there was no record of chronic noncompliance.
3. The month of June 2016 had a total of 157 clients registered for MOP. However, 225 clients were seen, bringing an increase in compliance rate to 43.3% above maximum target. Thus, 143.3% compliance rate was recorded due to extra 68 clients that utilized the MOP clinic for the month.
4. In the first quarter of 2016 (January – March), a total of 534 clients were scheduled for Medical Out-Patient (MOP) clinic, 594 clients (111.2%) responded and no chronic non-compliance was recorded for the quarter. Thus, a total of 77 clients were recorded as extra MOP clients for the first quarter of 2016.
5. In the second quarter (April – June 2016), a total of 511 clients were registered for MOP clinic; 643 clients, representing 125.8% attended the clinic, bringing a total of 146 clients (28.5%) as extra MOP clients for the second quarter of 2016. Although eight (8) of the male clients scheduled, defaulted in their MOP clinics, all eight (8) responded after a call-out, and there was no record of chronic non-compliance.
6. They were all counseled and health educated individually during visits to the clinic to further sensitize them on the importance of keeping to MOP appointments, ways to manage their conditions and prevent complications. (Table 36-41) (Figure 30-34)
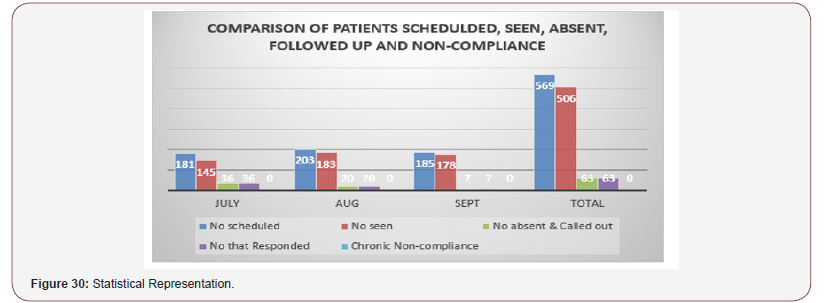
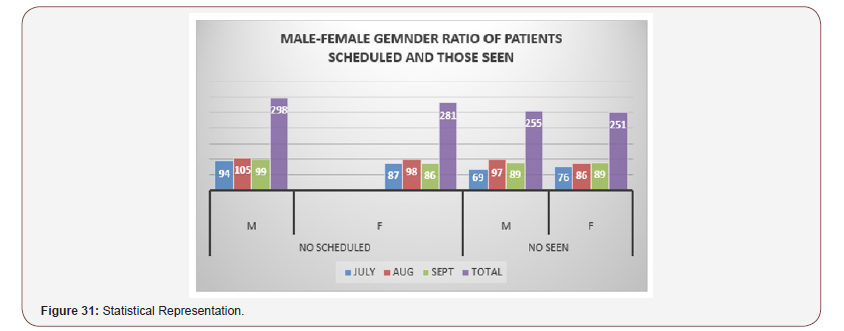
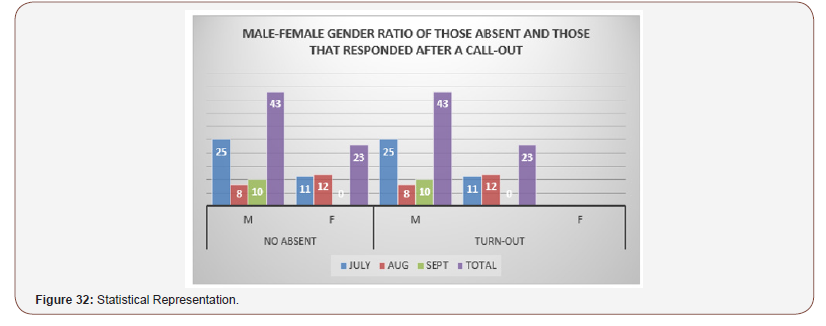
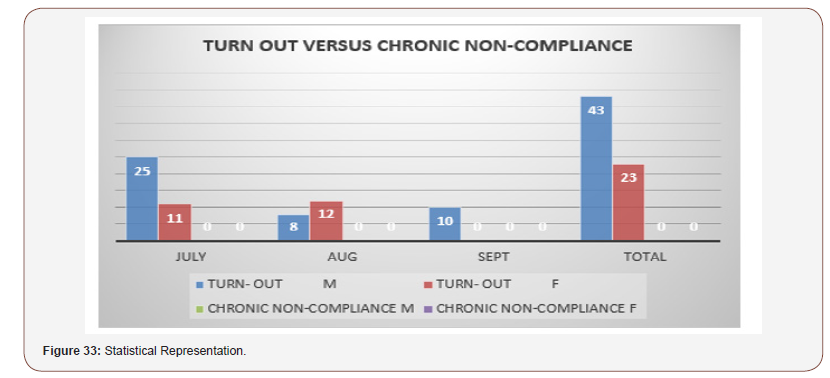
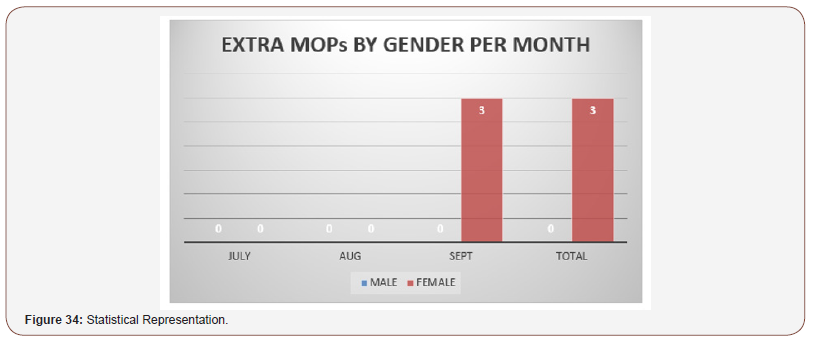
Table 36: Quarter 3: July - sept, 2016.
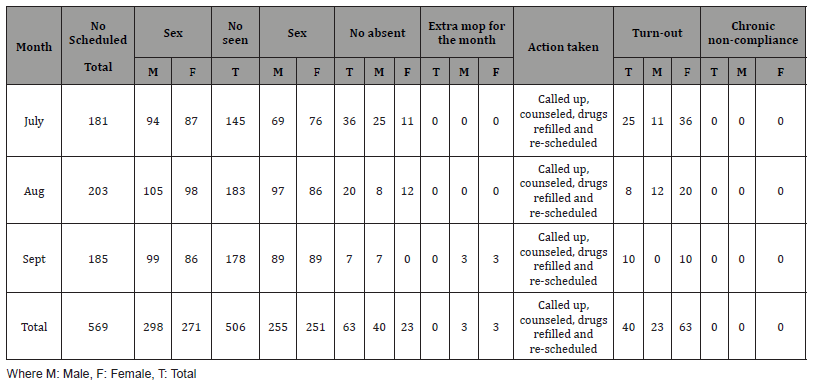
Table 37: Comparison of patients scheduled, those seen, those absent, followed up, and those that are non-compliant.
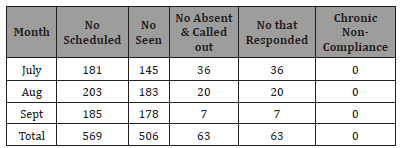
Table 38: Comparison of the male-female gender ratio scheduled and those seen.
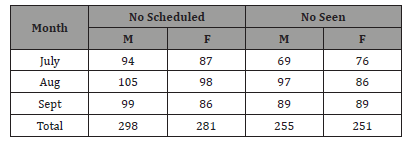
Table 39: Comparison of the male-female gender ratio that were absent and those that responded after a call-out.
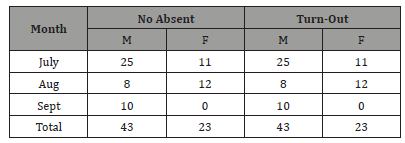
Table 40: Comparison of the male-female gender ratio that were absent and those that responded after a call-out.
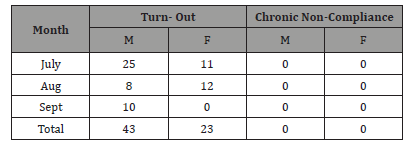
Table 41: Comparison of extra mops by gender per month.

Report summary for third quarter of 2016
In the month of July 2016, 181 clients were scheduled for MOP clinic, 145 clients (80%) of the total scheduled patients responded. A total of 36 clients (20%) were absent from MOP clinic in July. Same number of clients were called up and same responded. No record of chronic non-compliance for the month of July 2016. Of note is that the turn-out in the month of July was less than adequate as against set target of at least 90%.
In August 2016, 203 clients were scheduled for MOP clinic, 183 clients, representing 90.1% were seen for the month. A total of 20 clients (9.9%) were absent, same were called up and same attended the clinic. No chronic non-compliance and no extra MOP patient were recorded in the month of August 2016.
The month of September 2016 had a total of 185 clients registered for MOP. However, 178 clients (96.2%) were seen. Thus, 7 clients (3.8%) defaulters were noted. Specifically, ten (10) male clients defaulted while three (3) females were captured as extra MOP clients for the month of September 2016, bringing the number of defaulters above as seven (7) on a general statistic. Meanwhile, the defaulters were called up and same responded. There was no record of chronic non-compliance in the month of September 2016.
In the first quarter of 2016 (January – March), a total of 534 patients were scheduled for Medical Out-Patient (MOP) clinic, 594 clients (111.2%) responded and no chronic non-compliance was recorded for the quarter. Thus, a total of 77 clients were recorded as extra MOP clients for the first quarter of 2016.
In the second quarter (April – June 2016), a total of 511 clients were registered for MOP clinic; 643 clients, representing 125.8% attended the clinic, bringing a total of 146 clients (28.5%) as extra MOP clients for the second quarter of 2016. Although eight (8) of the male clients scheduled, defaulted in their MOP clinics, all eight (8) responded after a call-out, and there was no record of chronic non-compliance.
In the third quarter (July – Sept), 2016, there was a sharp drop in MOP compliance from the minimum set target of 90% down to 80%. A total of 36 clients (25 males and 11 females) make up the 20% that defaulted. On closer inquiry from those clients as touching their reasons for failing to attend their clinics as scheduled, their responses were mainly centered on misplacement of their appointment cards, forgetfulness of their appointment dates, some travels they could not cancel for the sake of their Clinics, and changes in their duty schedules off-shore. Interestingly, only 3 clients were captured as Extra MOPs for the third quarter.
They were all counseled accordingly and health-educated individually during their visits to the clinic to further sensitize them on the importance of keeping to MOP appointments, ways to manage their conditions and prevent complications. (Table 42-47) (Figure 35-39)
Table 42: Comparison of extra mops by gender per month.
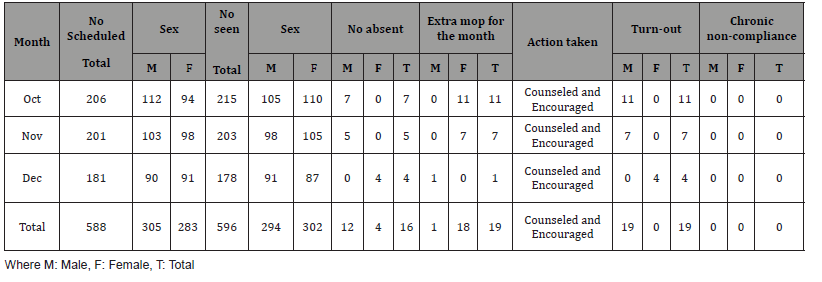
Table 43: Comparison of patients scheduled, those seen, those absent, followed up, and those that are non-compliant.

Table 44: Comparison of the male-female gender ratio scheduled and those seen.
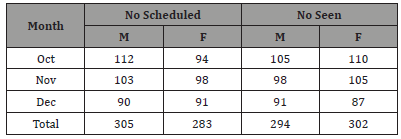
Table 45: Comparison of those that turned out and chronically noncompliant patients.
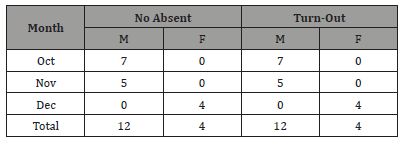
Table 46: Comparison of those that turned out and chronically noncompliant patients.
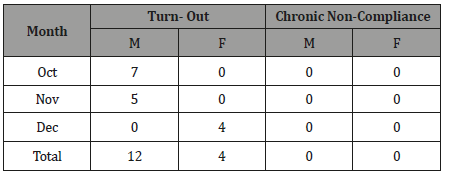
Table 47: Comparison of extra mops by gender per month.
Report summary for the fourth quarter of 2016
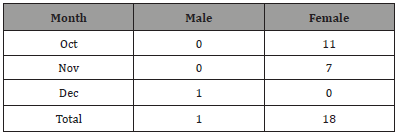
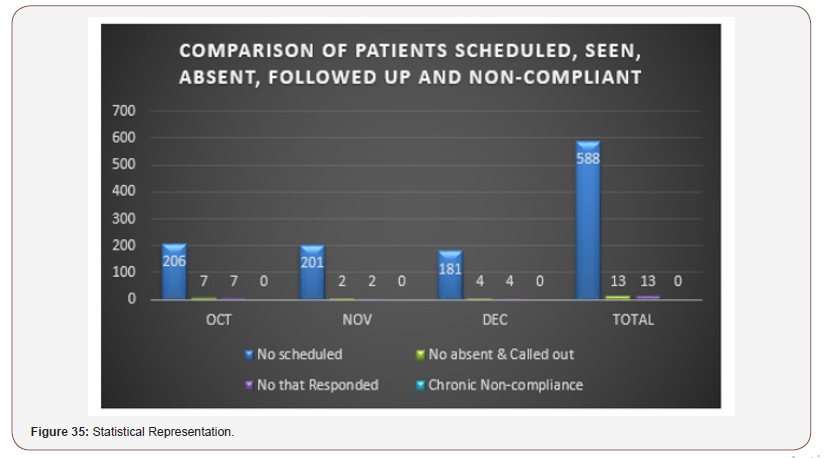
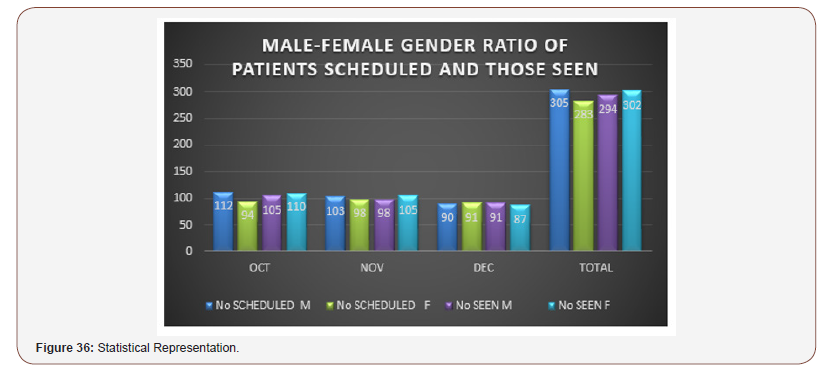
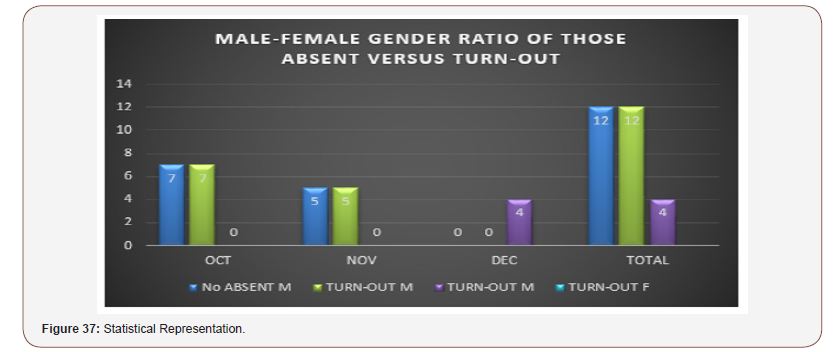
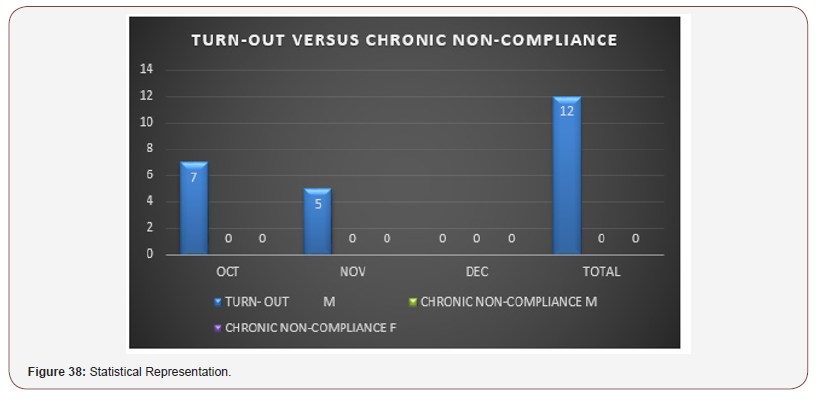
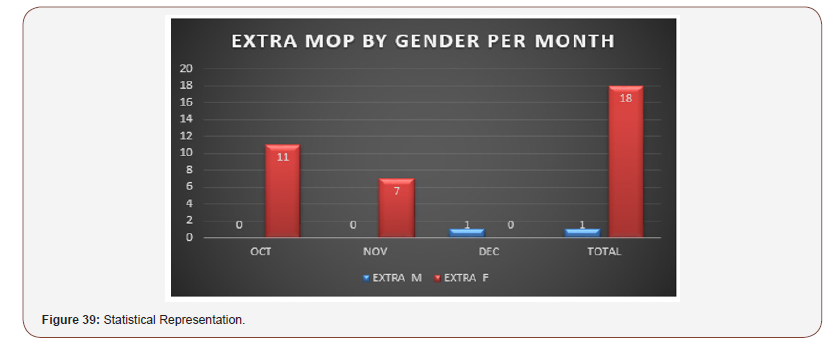
In the month of Oct 2016, 206 clients were scheduled for MOP clinic, 215 clients, representing 104% of the total scheduled patients responded. In other words, there was more than 100% compliance. An extra MOP of 11 female clients, representing 5% of scheduled patients, as well as 7 male defaulters, representing 3% were noted. In Nov 2016, 201 clients were scheduled for MOP clinic, 203 were seen for the month. Of note is that 7 extra female clients were seen in addition to the number scheduled for the month of Nov, and 2 of the scheduled male clients defaulted in the month of Nov 2016. The month of Dec 2016 saw a total of 181 clients registered for MOP clinic. However, 178 clients 98(%) were seen, maintaining the compliance rate above minimum set target of 90%. Even though, we achieved 98% compliance, those defaulters were equally called up for their MOP clinic visits and same responded accordingly. In the fourth quarter of 2016 (Oct-Dec), a total of 588 patients were scheduled for Medical Out-Patient (MOP) clinic, 596 clients (101%) responded, and no chronic non-compliance was recorded for the quarter. In other words, the overall quality improvement process recorded 11% success above minimum set target for the year 2016. Thus, a total of 19 clients were captured as extra MOP clients for the fourth quarter of 2016.
The total number of MOP clients scheduled in the fourth quarter also saw the Male-Female Gender Ratio as approximately 1:1. Although, increase in the number of males who utilized the MOP clinic in the fourth quarter of 2016 was directly proportional to that of the females, it is also on record that male clients scheduled for MOP clinic were marginally higher than the female clients but more female clients than males utilized the clinic in this quarter
They were all counseled and health-educated individually during visits to the clinic to further sensitize them on the importance of keeping to their MOP appointments, ways to manage their conditions and prevent complications. The consistent compliance for the three months was also encouraging and positive feedback given to the clients to encourage them to keep it up. It is however important that the nurses and doctors step up their health educational capabilities to help these clients prevent complications of their conditions and improve their treatment outcomes.
Mop compliance tracking of hypertensive/diabetic patients for 2017
(Table 48-53) (Figure 40-44)
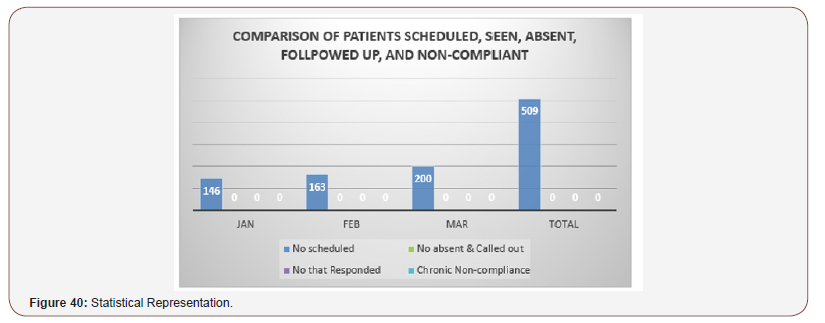
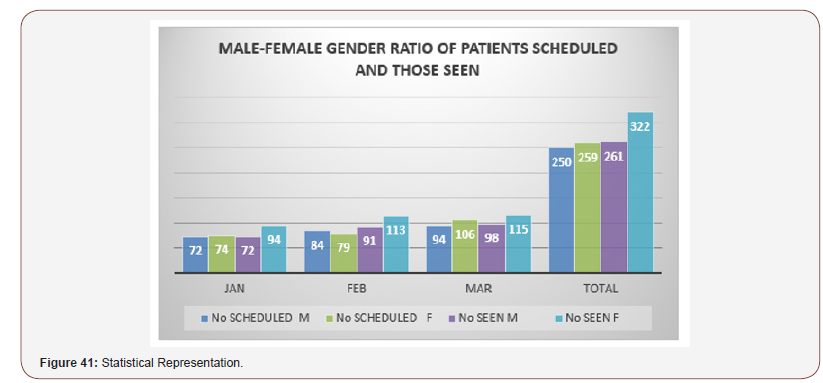
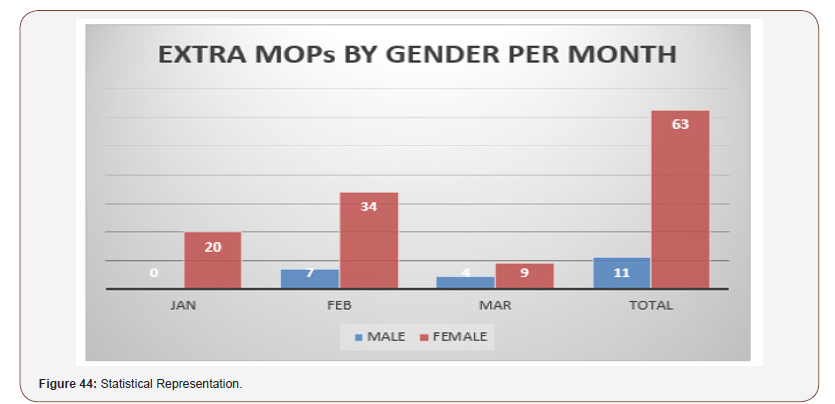
Table 48: Quarter 3: July - sept, 2016.
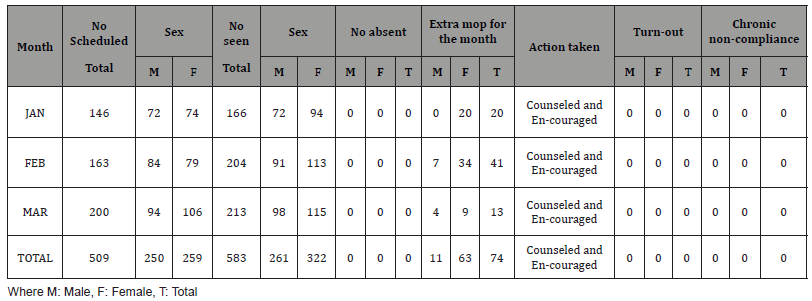
Table 49: Comparison of patients scheduled, those seen, those absent, followed up, and those that are non-compliant.
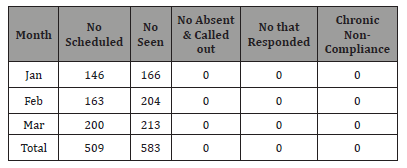
Table 50: Comparison of the male-female gender ratio scheduled and those seen.
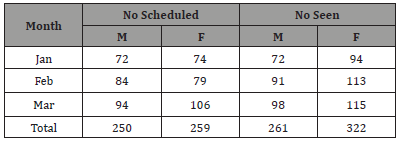
Table 51: Comparison of the male-female gender ratio that were absent and those that responded after a call-out.
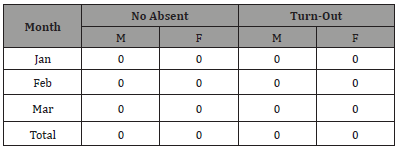
Table 52: Comparison of those that turned out and chronically noncompliant patients.
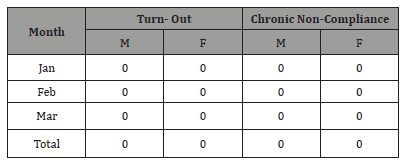
Table 53: Comparison of extra mops by gender per month.
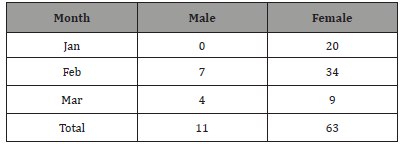
Report summary of first quarter of 2017
1. In the month of January 2017, 146 clients were scheduled for MOP clinic, 166 clients, representing 113.7% of the total scheduled patients responded. In other words, there was more than 100% compliance. An extra MOP of 20 clients, representing 13.7% was captured. Neither absenteeism nor chronic non-compliance was recorded for the month.
2. In February 2017, 163 clients were scheduled for MOP clinic, 204 were seen for the month. Since extra 41 clients were seen in addition to the number scheduled for the month of February, MOP compliance rate was increased by 35.2% above minimum set target. In other words, there was more than 100% compliance in the month of February 2017.
3. The month of March 2017 saw a total of 200 clients registered for MOP clinic. However, 213 clients were eventually seen, bringing an increase in compliance rate to 16.5% above minimum set target. Thus, 106.5% compliance was recorded due to extra 13 clients that utilized the MOP clinic for the month.
4. In the first quarter of 2017 (January – March), a total of 509 patients were scheduled for Medical Out-Patient (MOP) clinic, 583 clients (114.5%) responded, no absenteeism and no chronic non-compliance were recorded for the quarter. Thus, a total of 74 clients were captured as extra MOP clients for the first quarter of 2017.
5. The total number of MOP clients scheduled in the first quarter also saw the Male-Female Gender Ratio as approximately 1:1. Although, increase in the number of males who utilized the MOP clinic in the first quarter of 2017 was directly proportional to that of the females, it is obvious that females utilized the MOP clinic more than the males, from the statistical records gathered.
6. They were all counseled and health-educated individually during visits to the clinic to further sensitize them on the importance of keeping to their MOP appointments, ways to manage their conditions and prevent complications. The consistent compliance for the three months was also encouraging and positive feedback given to the clients to encourage them to keep it up.
7. It is however important that the nurses and doctors step up their health educational capabilities to help these clients prevent complications of their conditions and improve their treatment outcomes.
(Table 54-59) (Figure 45-49)
Table 54: Quarter 2: April - June 2017.
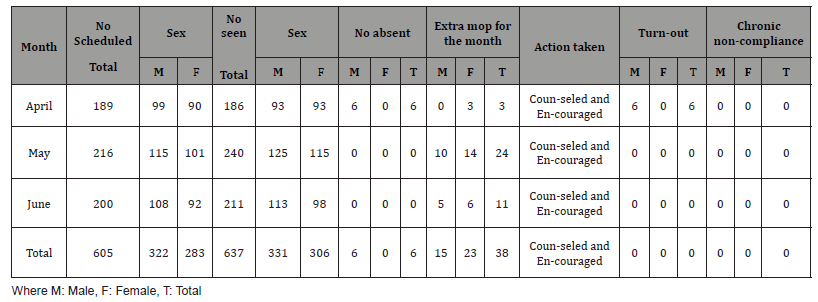
Table 55: Comparison of patients scheduled, those seen, those absent, followed up, and those that are non-compliant.

Table 56: Comparison of the male-female gender ratio scheduled and those seen.

Table 57: Comparison of the male-female gender ratio that were absent and those that responded after a call-out.
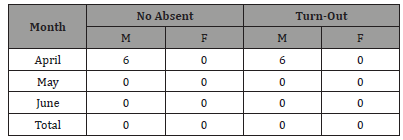
Table 58: Comparison of those that turned out and chronically noncompliant patients.
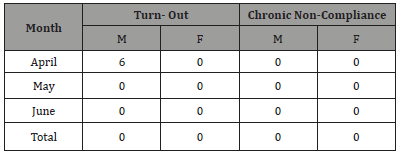
Table 59: Comparison of Extra Mops By Gender Per Month
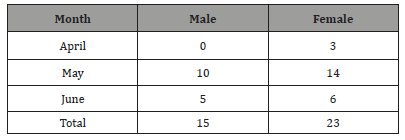

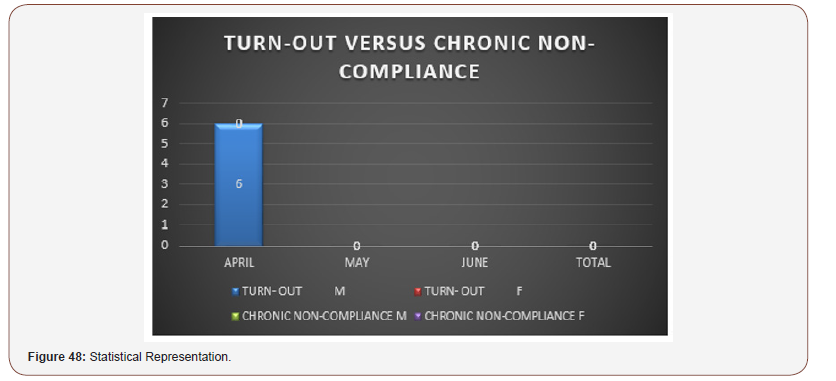
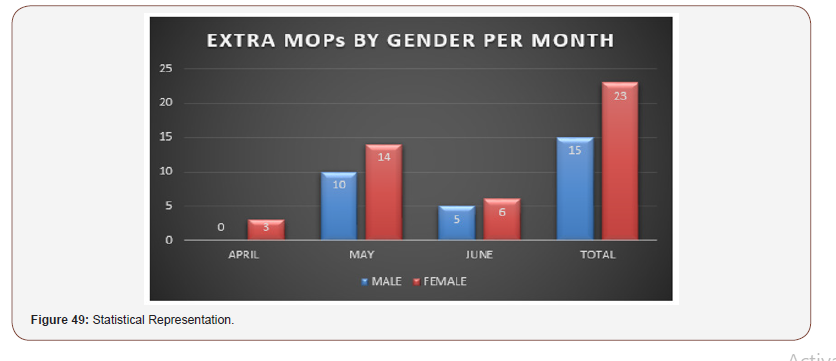
Report summary of the second quarter of 2017
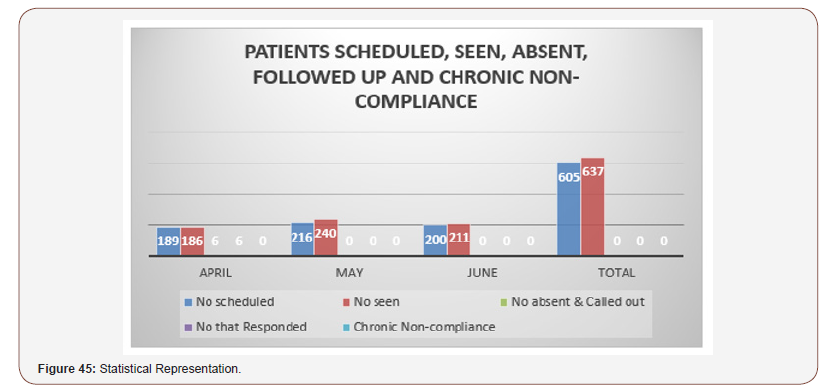
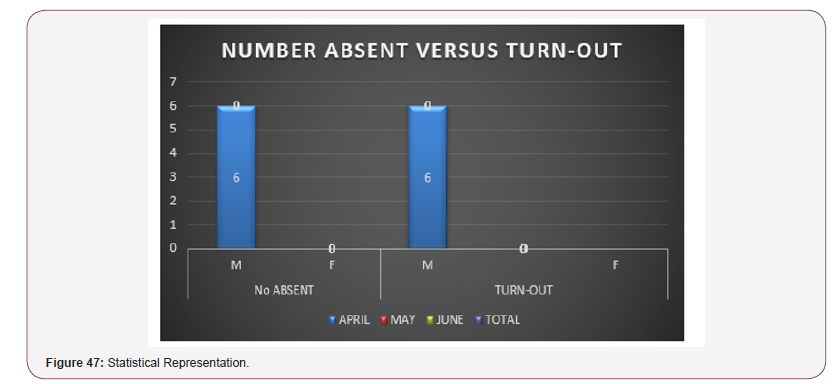
1. In the month of April 2017, 189 clients were scheduled for MOP clinic, 186 clients, representing 98.4% of the total scheduled patients responded. In other words, there was more than 90% compliance. An extra MOP of 3 female clients, representing 3.3% of scheduled patients, as well as 6 male defaulters, representing 6.1% were noted.
2. In May 2017, 216 clients were scheduled for MOP clinic, 240 were seen for the month. Since extra 24 clients were seen in addition to the number scheduled for the month of May, MOP compliance rate was increased by 21.1% above minimum set target. In other words, there was more than 100% compliance in the month of May 2017.
3. The month of June 2017 saw a total of 200 clients registered for MOP clinic. However, 211 clients (105.5%) were seen, bringing an increase in compliance rate to 15.5% above minimum set target. Thus, 105.5% compliance was recorded due to extra 11 clients that utilized the MOP clinic for the month.
4. In the second quarter of 2017 (April – June), a total of 605 patients were scheduled for Medical Out-Patient (MOP) clinic, 637 clients (105.3%) responded, and neither absenteeism nor chronic non-compliance was recorded for the quarter. In other words, the overall quality improvement process recorded 15.3% success above minimum set target for the year 2017. Thus, a total of 38 clients were captured as extra MOP clients for the second quarter of 2017. It is however of note that extra MOP clients in the first quarter (74 clients) were more than in the second quarter (38 clients).
5. The total number of MOP clients scheduled in the second quarter also saw the Male-Female Gender Ratio as approximately 1:1. Although, increase in the number of males who utilized the MOP clinic in the second quarter of 2017 was directly proportional to that of the females, it is obvious that males utilized the MOP clinic more than the females, from the statistical records gathered in the second quarter, as against females who utilized the MOP clinic more than the males in the first quarter.
6. They were all counseled and health-educated individually during visits to the clinic to further sensitize them on the importance of keeping to their MOP appointments, ways to manage their conditions and prevent complications. The consistent compliance for the three months was also encouraging and positive feedback given to the clients to encourage them to keep it up.
7. It is however important that the nurses and doctors step up their health educational capabilities to help these clients prevent complications of their conditions and improve their treatment outcomes.
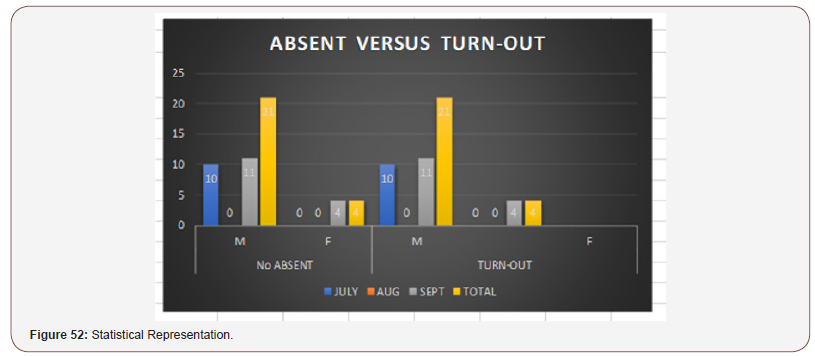
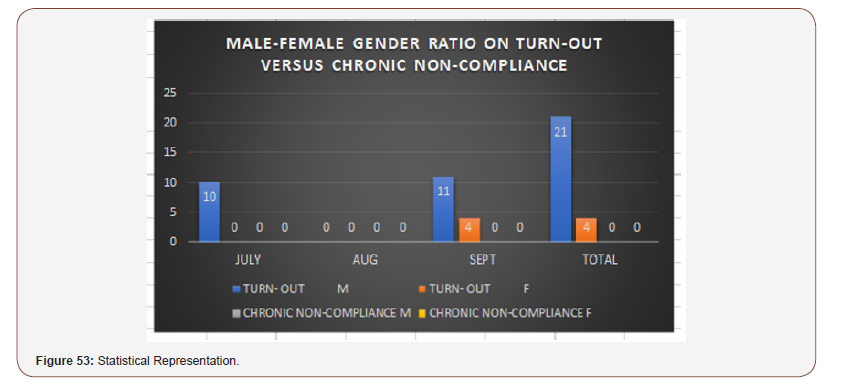
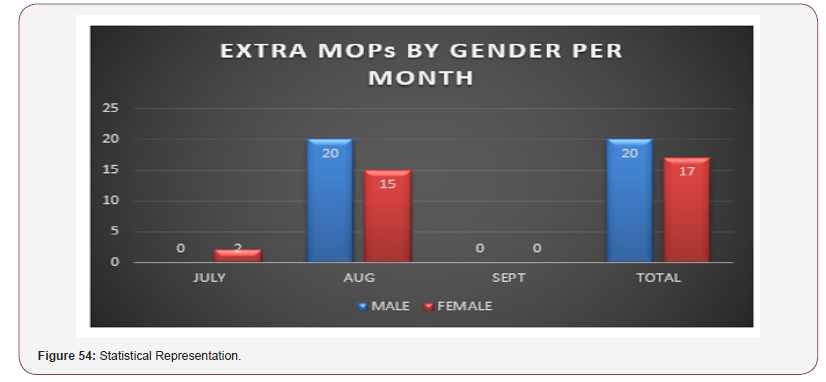
(Table 60-65) (Figure 50-54)
Table 60: Quarter 3: July – Sept, 2017.

Table 61: Comparison of patients scheduled, those seen, those absent, followed up, and those that are non-compliant.

Table 62: Comparison of the male-female gender ratio scheduled and those seen.
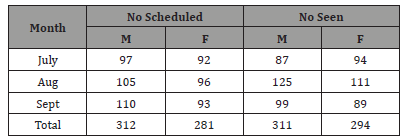
Table 63: Comparison of the male-female gender ratio that were absent and those that responded after a call-out.
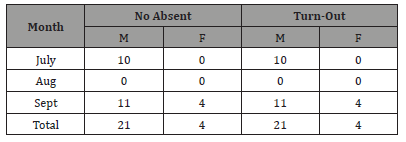
Table 64: Comparison of those that turned out and chronically noncompliant patients.
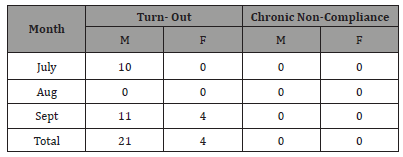
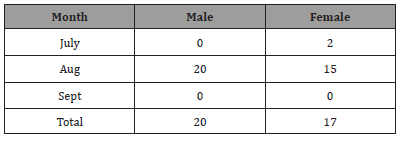
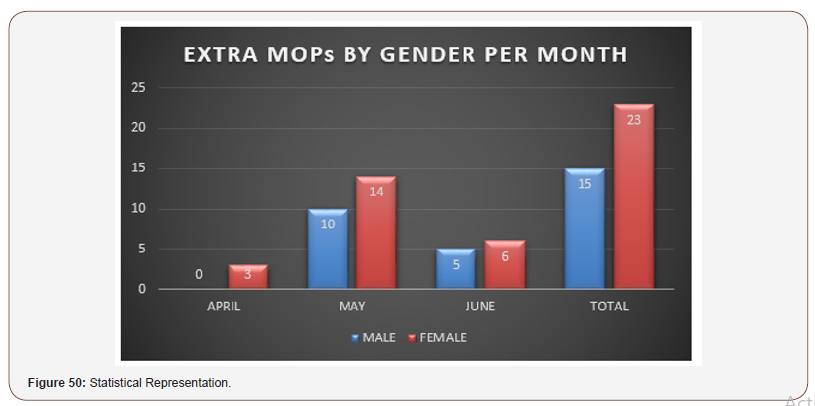
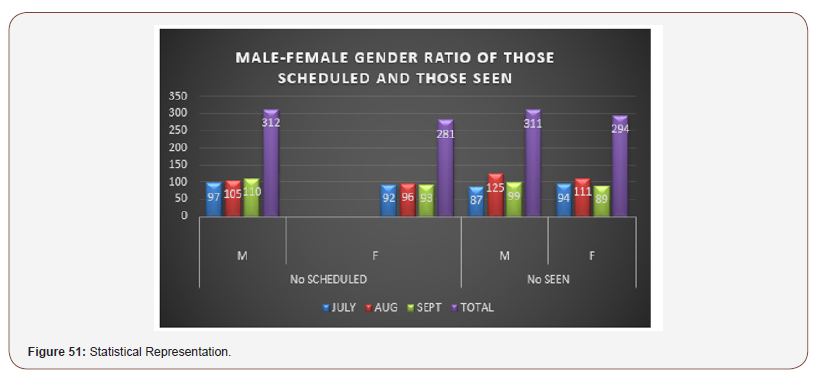
Table 65: Comparison of extra mops by gender per month.
Report summary of the second quarter of 2017
1. In the month of April 2017, 189 clients were scheduled for MOP clinic, 186 clients, representing 98.4% of the total scheduled patients responded. In other words, there was more than 90% compliance. An extra MOP of 3 female clients, representing 3.3% of scheduled patients, as well as 6 male defaulters, representing 6.1% were noted.
2. In May 2017, 216 clients were scheduled for MOP clinic, 240 were seen for the month. Since extra 24 clients were seen in addition to the number scheduled for the month of May, MOP compliance rate was increased by 21.1% above minimum set target. In other words, there was more than 100% compliance in the month of May 2017.
3. The month of June 2017 saw a total of 200 clients registered for MOP clinic. However, 211 clients (105.5%) were seen, bringing an increase in compliance rate to 15.5% above minimum set target. Thus, 105.5% compliance was recorded due to extra 11 clients that utilized the MOP clinic for the month.
4. In the second quarter of 2017 (April – June), a total of 605 patients were scheduled for Medical Out-Patient (MOP) clinic, 637 clients (105.3%) responded, and neither absenteeism nor chronic non-compliance was recorded for the quarter. In other words, the overall quality improvement process recorded 15.3% success above minimum set target for the year 2017. Thus, a total of 38 clients were captured as extra MOP clients for the second quarter of 2017. It is however of note that extra MOP clients in the first quarter (74 clients) were more than in the second quarter (38 clients).
5. The total number of MOP clients scheduled in the second quarter also saw the Male-Female Gender Ratio as approximately 1:1. Although, increase in the number of males who utilized the MOP clinic in the second quarter of 2017 was directly proportional to that of the females, it is obvious that males utilized the MOP clinic more than the females, from the statistical records gathered in the second quarter, as against females who utilized the MOP clinic more than the males in the first quarter.
6. They were all counseled and health-educated individually during visits to the clinic to further sensitize them on the importance of keeping to their MOP appointments, ways to manage their conditions and prevent complications. The consistent compliance for the three months was also encouraging and positive feedback given to the clients to encourage them to keep it up.
7. It is however important that the nurses and doctors step up their health educational capabilities to help these clients prevent complications of their conditions and improve their treatment outcomes.
(Table 60-65) (Figure 50-54)
Table 66: Quarter 4: Oct - Dec, 2017.
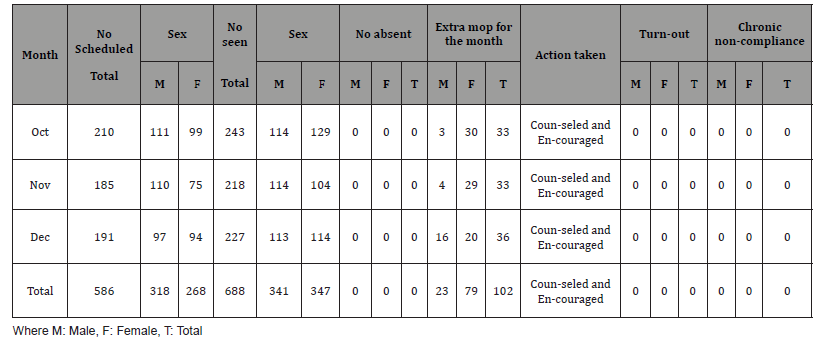
Table 67: Comparison of patients scheduled, those seen, those absent, followed up, and those that are non-compliant.

Table 68: Comparison of the male-female gender ratio scheduled and those seen.
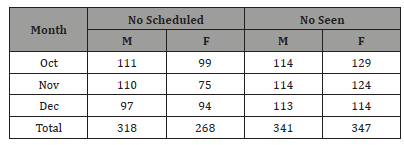
Table 69: Comparison of the male-female gender ratio that were absent and those that responded after a call-out.
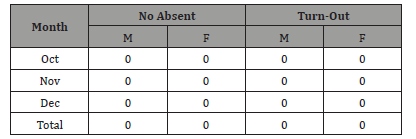
Table 70: Comparison of those that turned out and chronically noncompliant patients.
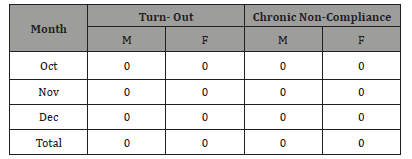
Table 71: Comparison of extra mops by gender per month.

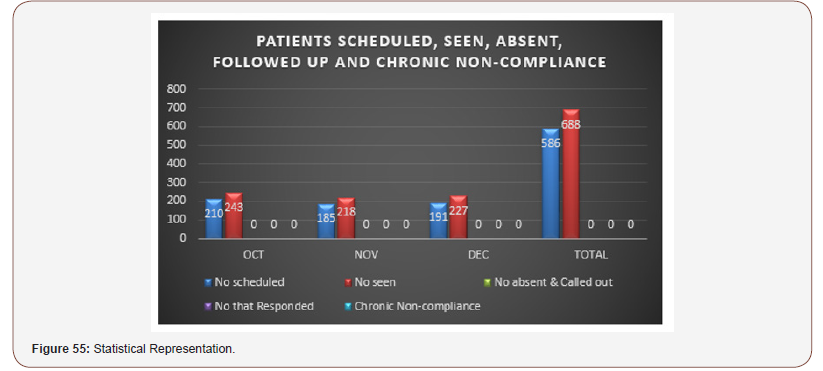
Report Summary of the fourth quarter of 2017
Results, interpretations and recommendations:
1. In the month of October 2017, 210 clients were scheduled for MOP clinic, 243 clients, representing 116% of the total scheduled patients responded. In other words, there was more than 100% compliance. An extra MOP of 33 clients, representing 16% was captured. Neither absenteeism nor chronic non-compliance was recorded for the month.
2. In November 2017, 185 clients were scheduled for MOP clinic, 218 were seen for the month. Since extra 33 clients were seen in addition to the number scheduled for the month of November, MOP compliance rate was increased by 28% above minimum set target. In other words, there was more than 100% compliance in the month of November 2017.
3. The month of December 2017 saw a total of 191 clients registered for MOP clinic. However, 227 clients were seen, bringing an increase in compliance rate to 29% above minimum set target of 90%. Thus, 119% compliance was recorded due to extra 36 clients that utilized the MOP clinic for the month.
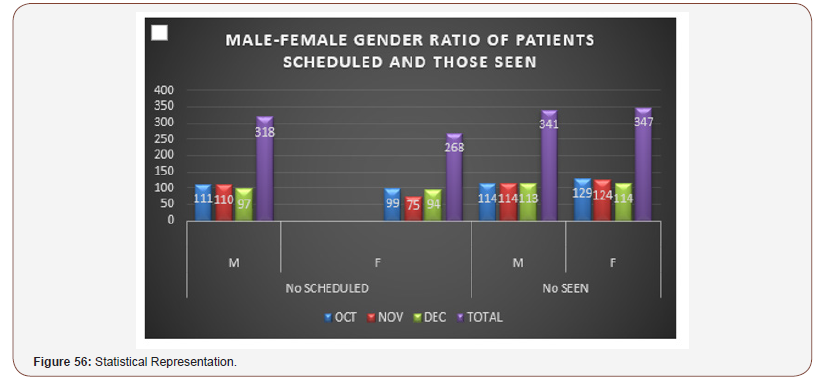
4. In the fourth quarter of 2017 (Oct – Dec), a total of 586 patients were scheduled for Medical Out-Patient (MOP) clinic, 688 clients (117%) responded, no absenteeism and no chronic non-compliance were recorded for the quarter.
5. The total number of MOP clients scheduled in the fourth quarter also saw the Male-Female Gender Ratio as approximately 1:1. Although, increase in the number of males who utilized the MOP clinic in the fourth quarter of 2017 was directly proportional to that of the females, it is obvious that females utilized the MOP clinic more than the males, from the statistical records gathered.
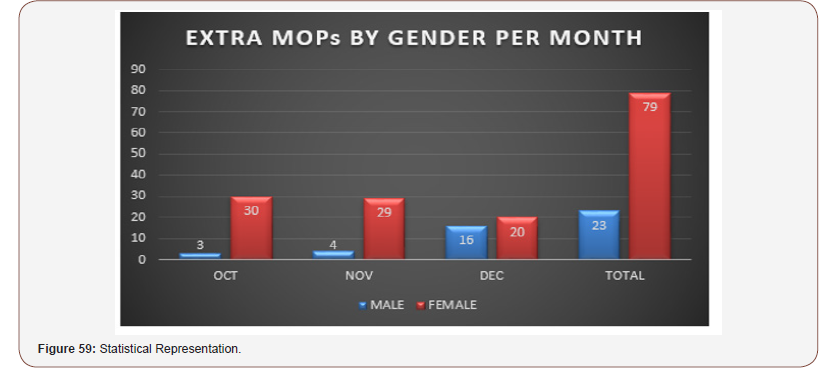
6. A total of 102 clients were captured as extra MOP clients for the fourth quarter of 2017, out of which 23 were males and 79 were females.
7. They were all counseled and health-educated individually during visits to the clinic to further sensitize them on the importance of keeping to their MOP appointments, ways to manage their conditions and prevent complications. The consistent compliance for the three months was also encouraging and positive feedback given to the clients to encourage them to keep it up.
8. It is however important that the nurses and doctors step up their health educational capabilities to help these clients prevent complications of their conditions and improve their treatment outcomes.
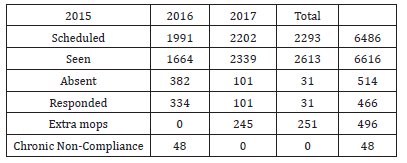
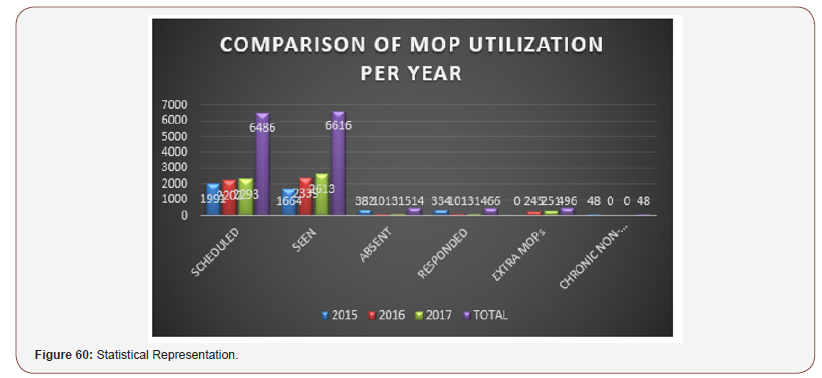
(Table 72) (Figure 60).
Table 72: Comparison of mop utilization per year.
Summary of mop utilization for the three years under review
1. In 2015, a total of 1991 clients were scheduled for MOP clinic, 1664 clients were seen, 382 were absent, 334 responded after a call-out, no extra MOP clients were captured, and 48 clients were recorded as chronically non-compliant.
2. In 2016, 2202 clients were scheduled for MOP clinic, 2339 were seen, 101 were absent. the same 101 clients captured as absent were called and followed up, and same people responded. 245 clients were captured as extra MOP clients who utilized the clinic without schedule, and no record of chronic non-compliance.
3. In 2017, a sum of 2293 clients were scheduled for MOP clinic, 2613 were seen, 31 out of the scheduled clients were absent, same 31 clients were followed up and same responded. 251 clients were captured as extra MOP clients for the year 2017 and there was no record of chronic non-compliance.
4. Within the 3 years under review, a total of 6486 clients were scheduled for MOP clinic, 6616 clients utilized the clinic, 514 clients were recorded as absent, 466 responded promptly after a follow-up, 496 extra clients utilized the clinic without schedule, and a total of 48 clients were seen as chronically non-compliant. However, these 48 clients were made up of patients who travelled out of the country, chronically ill and debilitating patients, and those who resigned their appointments with the company. Therefore, those of the patients who were still within reach and too old to come to the clinic were attended to through home visit.
Summary of chapter five
In chapter four, the presentations, findings, data analyses and interpretations of the study were carefully noted, through detailed presentation of the MOP Compliance Tracking of Hypertensive/ Diabetic patients for 2015, 2016 and 2017. Summary of MOP utilization for the three years under reviews was also included.
Summary, Implications and Recommendations
Introduction
In this chapter, the researcher will reflect back at the entire research process to pursue his findings to a logical conclusion, and possibly offer recommendations aimed at assisting the clients become more aware of the complications of non-compliance with treatment regimens so as to see the need to utilize adequately the MOP clinics and improve their health.
Summary of findings
Summary of MOP tracking of hypertensive/diabetic patients in 2015
1. In the first quarter of 2015 (January – March), a total of 518 clients were scheduled for Medical Out-Patient (MOP) clinic, out of which 330 responded and 188 were absent. The same number of patients were called up, out of which 175 (93.1%) of those clients turned out and 13 (6.9%) remained chronically non-compliant.
2. In the second quarter of 2015 (April – June), a total of 487 clients were on the schedule list, but a total of 545 clients utilized the MOP clinic, bringing an excess of 60 clients representing 12.3% seen in addition to the scheduled ones.
3. In the third quarter of 2015 (July – Sept), a total of 492 clients were scheduled for MOP clinic, but 550 clients were seen. Thus, an additional number of clients that visited the MOP clinic in this quarter was 80, representing 16.3% of the total scheduled patients for that quarter. A total 22 clients were absent, same called up and same responded. No record of chronic non-compliance.
4. In the fourth quarter of 2015 (Oct - Dec), a total of 494 patients were scheduled for Medical Out-Patient (MOP) clinic, out of which 325 (65.8%) responded, and 170 (34.2%) were absent. The same number of people absent were called up, out of which 135 (79.4%) of those clients turned out.
5. Many of the clients attributed this to the unexpected changes made to their duty schedules which, according to them, was inevitable due to the mass retrenchment/ retirement exercises done across all the locations.
Summary of MOP tracking of hypertensive/diabetic patients in 2016
1. In the first quarter of 2016 (January – March), a total of 534 clients were scheduled for Medical Out-Patient (MOP) clinic, 594 clients (111.2%) responded and no absenteeism or chronic non-compliance was recorded for the quarter. Thus, a total of 77 clients were recorded as extra MOP clients for the first quarter of 2016.
2. In the second quarter (April – June 2016), a total of 511 clients were registered for MOP clinic; 643 clients, representing 125.8% attended the clinic, bringing a total of 146(28.5%) as extra MOP clients for the second quarter of 2016. Although eight (8) of the male clients scheduled, defaulted in their MOP clinics, all eight (8) responded after a call-out, and there was no record of chronic noncompliance.
3. In the third quarter (July – Sept), 2016, there was a sharp drop in MOP compliance from the minimum set target of 90% down to 80%. A total of 36 clients (25 males and 11 females) made up the 20% that defaulted. On closer inquiry from those clients as touching their reasons for failing to attend their clinics as scheduled, their responses were mainly centered on misplacement of their appointment cards, forgetfulness of their appointment dates, some travelled out, while others could not imagine why they defaulted. And others experienced unplanned changes in their duty schedules offshore. The same number of defaulters were equally called up and same responded. Interestingly, only 3 clients were captured as Extra MOPs for the third quarter, but there were no records of chronic non-compliance.
4. In the fourth quarter of 2016 (Oct – Dec), a total of 588 patients were scheduled for Medical Out-Patient (MOP) clinic, 596 clients (101.4%) responded, and no chronic non-compliance was recorded for the quarter. In other words, the overall quality improvement process recorded 11.4% success above minimum set target for the year 2016.
5. Thus, a total of 19 clients were captured as extra MOP clients in the fourth quarter of 2016.
6. The total number of MOP clients scheduled in the fourth quarter also saw the Male-Female Gender Ratio as approximately 1:1. Although, increase in the number of males who utilized the MOP clinic in the fourth quarter of 2016 was directly proportional to that of the females, it is also on record that male clients scheduled for MOP clinic were marginally higher than the female clients but more female clients than males utilized the clinic in this quarter.
Summary of MOP tracking of hypertensive/diabetic patients in 2017
1. In the first quarter of 2017 (January – March), a total of 509 patients were scheduled for Medical Out-Patient (MOP) clinic, 583 clients (114.5%) responded, no absenteeism and no chronic non-compliance were recorded for the quarter. Thus, a total of 74 clients were captured as extra MOP clients for the first quarter of 2017. The total number of MOP clients scheduled in the first quarter also saw the Male-Female Gender Ratio as approximately 1:1. Although, increase in the number of males who utilized the MOP clinic in the first quarter of 2017 was directly proportional to that of the females, it is obvious that females utilized the MOP clinic more than the males, from the statistical records gathered.
2. In the second quarter of 2017 (April – June), a total of 605 patients were scheduled for Medical Out-Patient (MOP) clinic, 637 clients (105.3%) responded, and no chronic non-compliance was recorded for the quarter. In other words, the overall quality improvement process recorded 15.3% success above minimum set target for the year 2017. Thus, a total of 38 clients were captured as extra MOP clients for the second quarter of 2017. It is however of note that extra MOP clients in the first quarter (74 clients) were more than in the second quarter. The total number of MOP clients scheduled in the second quarter also saw the Male-Female Gender Ratio as approximately 1:1. Although, increase in the number of males who utilized the MOP clinic in the second quarter of 2017 was directly proportional to that of the females, it is obvious that males utilized the MOP clinic more than the females, from the statistical records gathered in the second quarter, as against females who utilized the MOP clinic more than the males in the first quarter.
3. In the third quarter of 2017 (July – Sept), a total of 593 patients were scheduled for Medical Out-Patient (MOP) clinic, 605 clients (102%) responded, and no chronic non-compliance was recorded for the quarter. In other words, the overall quality improvement process recorded 12.0% success above minimum set target. Thus, a total of 37 clients were captured as extra MOP clients for the third quarter of 2017. It is however of note that extra MOP clients in the first, second and third quarters were 74, 38 and 37 respectively. The total number of MOP clients scheduled in the third quarter also saw the Male- Female Gender Ratio as approximately 1:1. It is worthy of note that the MOP compliance rates in the third quarter of 2017 were consistently above 90% throughout the three months.
4. In the fourth quarter of 2017 (Oct – Dec), a total of 586 patients were scheduled for Medical Out-Patient (MOP) clinic, 688 clients (117%) responded, no absenteeism and no chronic non-compliance were recorded for the quarter. The total number of MOP clients scheduled in the fourth quarter also saw the Male-Female Gender Ratio as approximately 1:1. Although, increase in the number of males who utilized the MOP clinic in the fourth quarter of 2017 was directly proportional to that of the females, it is worthy of note that females utilized the MOP clinic more than the males, from the statistical records gathered. A total of 102 clients were captured as extra MOP clients for the fourth quarter of 2017, out of which 23 were males and 79 were females.
Implications of findings
Looking at the comparative study of MOP Compliance rates of Hypertensive/Diabetic patients, it is obvious that non-compliance with medical appointments distorts the smooth process of disease management. Non-compliance with, and non- adherence to, medical prescriptions have become common among all categories of clients, and especially among hypertensive/diabetic clients. This study is an eye opener into several reasons that clients give for defaulting in their medical appointments, not considering the negative impacts they might have on their individual health care and maintenance. Due to the increased rate of non-compliance, there were series of physiological, laboratory and radiological derangements recorded among the clients. But with increased awareness and commitment to individualized health care services, such clinical indicators have shown significant improvement among the clients within the three years under review. Meanwhile, continued quality improvement process of the hypertensive/diabetic patients within the period under review has greatly influenced the patients to change the way they look at things, thus making them to pay more attention to their health than before. Of note is that encouraging the clients to take ownership of their health has gone a long way in sensitizing them on the dangers associated with non-compliance with therapeutic regimens; this helps them to make informed choices as to whether they should forgo their medical appointment for whatever reason or not.
Recommendations
Following the comprehensive work done in this research, the researcher has the following recommendations for consideration:
1. The Nurses and Doctors to intensify their health educational strategies to sensitize the clients on the importance of keeping to their medical appointments with the physician.
2. All clients to be made to take ownership of their health care, so as to see the importance of adhering to medical advice.
3. All Nurses and Doctors to adequately follow the standard operating procedures and clinical guidelines on the management of hypertensive/diabetic clients to ensure positive treatment outcomes.
4. The PDSA Cycle should always be applied during Quality Improvement Process to avoid losing focus along the line.
5. Always use every Quality Improvement Process as an opportunity for change or innovation or to improve the existing process.
6. Quality Improvement Process (QIP) should be multidisciplinary, involving the Micro-systems approach, in order to embrace team work. Micro-systems here include the fundamental units that are actually involved in the process, and include the Nurses, Doctors, Pharmacists, Laboratory Scientists, Radiologists/Radiographers, Medical Records Staff, etc.
7. Patients’ Rights and Responsibilities are to be made readily available to all clients to enable them to understand their various positions in their care.
8. There should be periodic review of QIP in the facility to ensure up-to-date clinical guidelines and processes.
Conclusion
Quality Improvement Process is an essential ingredient needed to brace up with the current standards of practice in any health care setting. Embarking on this project through assessment of the quality improvement process of hypertensive/diabetic patients is a wonderful step towards Quality Assurance in our practice. Through quality improvement process, new discoveries occur, which also lead to new innovations. Quality Improvement Process assessment has also led to a tremendous improvement in the quality of care to the clients, greater awareness of personal health, rights and responsibilities. Through continuous health education to the clients, there are increased compliance rates with MOP clinic appointments and desirable treatment outcomes.
Acknowledgement
None.
Conflict of Interest
No conflict of interest.
References
- Anthony Mary K, Theresa Hertz, Judith (2000) Factors Influencing Outcomes After Delegation to Unlicensed Assistive Personnel. J Nurs Adm 30(10): 474-481.
- Basavanthappa BT (2000) Nursing Administration (1st), Jaypee Brothers, New Delhi, India.
- Douglass L M (1996) The effective nurse- leader and manager (5th Edn), Mosby: St. Louis, USA.
- Health Quality Ontario (2012) Quality Improvement Guide.
- John Wiley & Sons (July 2009) "The Quality Assurance Journal".
- Johnson M, Closkey JC (1992) The Delivery of Quality Health Care Series on Nursing Administration, Mosby, USA.
- Koch MW Fairly TM (1993) Integrated Quality Management: The Key To Improving Nursing Care Quality (1st), St. Louis, Missouri: Mosby Publications, USA.
- Marquis BL, Hutson CJ (2006) Leadership roles and management functions in nursing-Theory and application (5th), Philadelphia: Lippincott Williams and Wilkins, USA.
- National Academy of Sciences (1997) Preparing for the 21st Century Quality of Medical Practice. National Research Council, Office of Congressional and Government Affairs, 2101 Constitution Avenue, NW Washington, DC 20418.
- Scottish Publication Authority (1998) Quality Assurance Principles, Elements and Criteria. Hanover House, 24 Douglas Street, Glasgow. G2 7NQ and Iron mills Road, Dalkeith Midlothian, EH22 ILE.
- Thareja, Mannu, Thareja, Priyavrat (2007) "The Quality Brilliance Through Brilliant People". Quality World 4 (2).
- http://www3.interscience.wiley.com/journal/15634/home.
- http://annals.org/article.aspx?articleid=712942
-
Monday AC Adishi. Assessing the Quality Improvement Process of Hypertensive/Diabetic Patients through Medical Outpatient Compliance tracking in Chow Hospital, Warri, Delta State, Nigeria – A Three-Year Retrospective Study From 2015-2017. Iris J of Nur & Car.2(1): 2019. IJNC.MS.ID.000527.
-
Hypertensive;Diabetic patients; Retrospective study; Diabetes mellitus;Hypertension; Retroviral illness; Medical out patient clinic; Health care improvement project
-

This work is licensed under a Creative Commons Attribution-NonCommercial 4.0 International License.


