


 Research Article
Research on Decision-Making Problems in the Production Process of Enterprises —A Case Study of Problem B in the 2024 National College Student Mathematical Modeling Competition
Received Date: March 19, 2026; Published Date: March 25, 2026
Abstract
In the production process of manufacturers, it is necessary to consider not only the production status of spare parts and the final completion degree of products, but also the key factor of product qualification rate. During manufacturing processes, manufacturers must consider not only component production conditions and final product quality but also incorporate the critical factor of product pass rate. By evaluating finished goods’ pricing and quality based on consumer demand and market requirements, companies should analyse cost factors including inspection expenses, disassembly costs, and replacement expenses to determine whether to implement specific production operations. This study employs rational algorithms, utilizing hypothesis testing, confidence intervals, and rejection thresholds to derive optimal solutions. It identifies effective component inspection methods and pass rate testing strategies to maximize corporate profits. Additionally, the research provides actionable decision-making frameworks tailored to real-world scenarios, enabling businesses to optimize production and operational strategies through evidence-based approaches.
Keywords: Hypothesis Testing; Normal Distribution; Rejection Region; Confidence Interval
Introduction
With the legislation and implementation of the Extended Producer Responsibility (EPR) system, manufacturers are required to be responsible not only for the production process of products but also for the environmental responsibilities in the later stages of the product life cycle. The core of this system lies in shifting the environmental responsibility for products from traditional government management to the producers themselves, so as to incentivize manufacturers to design more environmentally friendly products and reduce resource waste and environmental pollution. This requires enterprises to consider product quality and the remanufacturing issue after the end of product service life in the product design stage, so as to continue the performance and value of products.
Enterprise production decisions refer to the choices made by enterprises on what to produce, how much to produce, and how to produce when considering short-term production activities [9,13]. Their main task is to make the most reasonable and effective use of the enterprise’s human, material, and financial resources through the enterprise’s own positioning under existing conditions to achieve the maximum economic benefits. Different production types have different effects on various enterprises, so enterprises must select the production type that best meets their requirements based on their actual situation.
Remanufacturing can not only extend the service life of products and increase their added value but also bring many benefits at the economic, environmental, and social levels. High-quality products can often attract more customers, increase market share, and thus boost sales [14]. Consumers are willing to pay higher prices for high-quality products, which can also improve the profit margin of enterprises. High product quality standards can also enhance brand image, strengthen consumer trust and loyalty, and thereby bring long-term economic benefits to enterprises. However, Fine [3] analysed that due to the learning curve effect, the higher the product quality, the greater the rate of production cost reduction, so that high-quality products obtain greater cost savings with the accumulation of product quantity compared to low-quality products. Gal-Or [4] analysed the relationship between product quality and output in a multi-firm market, and argued that under uniform demand distribution, it is necessary to reduce the average product quality to increase the total output, but none of these studies analysed the fixed cost investment in quality improvement. This paper mainly analyses the relevant data through hypothesis testing, rejection region, confidence interval [5-8] and other methods, and then puts forward suggestions for enterprises’ production decisions.
Combining the above analysis, we take of the 2024 National College Students’ Mathematical Modeling Competition as an example [11]. An enterprise needs to purchase two types of spare parts separately to produce electronic products, and assembles finished products by combining the two spare parts. If one of the spare parts in the finished product is unqualified, the finished product must be unqualified; however, even if both spare parts are qualified, the resulting finished product may not be qualified. For unqualified finished products, the enterprise can choose to scrap them or disassemble them at its own disassembly cost, but the disassembly process must ensure that the spare parts are not damaged. This study aims to derive the most suitable plan for the enterprise’s development through hypothesis testing, confidence intervals, rejection regions, and other methods.
Model Assumptions
1. It is assumed that when inspecting semi-finished or finished
products, the finished products are treated as a whole, and all
semi-finished or finished products are inspected during the
inspection, and vice versa.
2. It is assumed that the hardness, material, toughness and other
properties of the same batch of purchased parts are basically
the same.
3. No unexpected situations occur during the production
operation process, ensuring production efficiency.
Model Establishment and Analysis
Hypothesis testing [5], which is generated to address the need for uncertain judgment of population parameters or distributions in practical research and decision-making processes, is an important method of statistical inference. It is applied in numerous fields such as scientific research, social surveys, economic analysis, medical research, quality control, and decisionmaking. We often cannot directly obtain all the information about a population; instead, we can only infer the characteristics of the population from sample data. Hypothesis testing provides a scientific basis based on sample data for us, making decisionmaking more reliable.
In the process of an enterprise producing electronic parts and products, the goal is to design a sampling inspection plan with the minimum number of inspections as much as possible. Under the condition of meeting the nominal value of 10%, based on the designed sampling inspection plan, we respectively obtain the results under the condition of rejecting the parts if it is confirmed that the defective rate of parts exceeds the nominal value at a 95% confidence level, and accepting the parts if it is confirmed that the defective rate of parts does not exceed the nominal value at a 90% confidence level.
Model Establishment Step 1: Propose hypotheses
The null hypothesis is denoted as H0. As the hypothesis that
researchers aim to reject, the null hypothesis represents a status
quo. The alternative hypothesis is denoted as H1, , which represents
the result the researcher expects to obtain.
• Under the 95% confidence level, if the measured defective
rate of the spare parts exceeds the nominal value of 10%, we
choose to reject this batch of parts.
• Under the 90% confidence level, if the measured defective rate
of the spare parts is not higher than the nominal value, we
choose to accept this batch of spare parts.
That is, when q satisfies the null hypothesis H1: the defective rate q of the parts ≤ the nominal value c =10%, we accept this batch of spare parts. When q satisfies the alternative hypothesis H1: the defective rate c =10%, we reject this batch of spare parts.
Step 2: Select the test statistic
Choosing the appropriate test statistic in product decisionmaking is crucial. When selecting a test statistic, it is necessary to consider the population distribution, sample characteristics, sample size and other aspects to choose a suitable one, such as the common Z-test statistic and F-test statistic. Finally, according to the nature of the problem and the characteristics of the sample data, the Z-test statistic is selected, which is suitable for large sample sizes, known population variance and the Z-value distribution following the standardized normal distribution.
When the sample size is large, it can be approximately regarded as a normal distribution [12]. When the nominal value is known, the Z-test statistic is finally selected through screening.
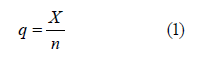
Let the total sample defect rate be p, the number of samples drawn be n, the number of non-conforming items contained in them be X , and the nominal value, i.e., the defect rate critical value, be c. Then the sample defect rate can be obtained:
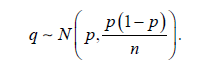
Since this sampling inspection is a random sampling, p follows a binomial distribution:

When the number of sampled units is sufficiently large, it can be approximated as a normal distribution:

From equations (1), (2) and (3), its expectation and variance are respectively:

Then the normal distribution of the sample defective rate is derived:
After standardizing it, the final test statistic is obtained:

Step 3: Determine the significance level
Choose a significance level (α ), such as 0.05 or 0.01 according to the specific situation of the problem. It represents the probability of the occurrence result when the null hypothesis is true. Under the 95% confidence level, (α = 0.05); under the 90% confidence level, α = 0.1.
Step 4: Calculate the sample size
In the first case, the batch of spare parts shall be rejected
if q > 0.1 at the 95% confidence level. The rejection region is set
 , and 0.95 u =1.645 under the standard normal
distribution.
, and 0.95 u =1.645 under the standard normal
distribution.
When the test statistic falls within the rejection region,
i.e., . Let q − c = ε, which denotes the error within a
controllable range, and take ε = 0.05. Then, at the 95% confidence
level, the sample size is given by
. Let q − c = ε, which denotes the error within a
controllable range, and take ε = 0.05. Then, at the 95% confidence
level, the sample size is given by
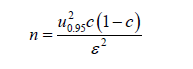
Solving this yields n = 97.
In the second case, the batch of parts is accepted if q ≥ 0.1 at the
90% confidence level. The rejection region is set as  ,
and u0.9 =1.282 under the standard normal distribution.
,
and u0.9 =1.282 under the standard normal distribution.
When the test statistic does not fall within the rejection region, i.e.,Z ≤ u0.9 Similarly, at the 90% confidence level, the sample size is

from which we obtain n = 59.
Step 5: Make a decision
At the 95% confidence level, a sample size of 97 is selected to determine whether to accept the batch of spare parts. If the defective rate exceeds the nominal value of 10%, the batch shall be rejected.
At the 90% confidence level, a sample size of 59 is selected to determine whether to accept the batch of spare parts. If the defective rate does not exceed the nominal value of 10%, the batch shall be accepted.
Decision Algorithm for Each Stage
The experimental data from Problem B of the 2024 Mathematical Modeling Contest are used for analysis. Based on the decisions made, specific decision schemes are provided for the cases in Table 1 below, together with the corresponding decision basis and indicator results.
During the inspection of spare parts, unqualified ones are directly discarded. In this case, the purchasing cost of qualified spare parts is increased. For example, when purchasing 10 units of Spare Part 1, the total purchasing cost is 40 yuan. If one of them is defective, only 9 qualified units of Spare Part 1 enter the assembly process. Thus, the purchasing cost per qualified Spare Part 1 is defined as 40/9, approximately 4.444 yuan.
Table 1: Profit per finished product under each scheme.

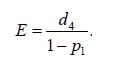
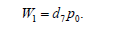
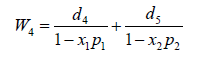
Let x1, x2, x3 denote whether Part 1, Part 2, and each assembled product are inspected, respectively; let x4 denote whether defective finished products are disassembled. Let p1 , p2 , p3 be the defective rates of Part 1, Part 2, and the finished product, respectively; let d1 ,d 2,d3 be their inspection costs, and W2 ,W3 ,W5 the inspection expenses. Let d4,d5 be the unit purchase prices of Part 1 and Part 2; let W4 be the total purchase cost of spare parts; let d6 be the assembly cost of the finished product, d7 the market selling price, and W1 the sales revenue; let d8 be the replacement loss for defective finished products, and W6 the replacement cost; let d9 be the disassembly cost; let p0 be the probability that a finished product is successfully sold.
The expected unit purchase price of a qualified spare part is derived as follows: The probability that Part 1 is qualified in the first draw is 1− p1 ; The probability that Part 1 is qualified only in the second draw is p1(1− p1).
The qualified probability when only the 1st spare part drawn for the third time is qualified is p12(1− p1)
The qualified probability when only the nth drawn part 1 is a qualified product is p1n-1(1− p1).
Finally, the defined expected value of the cost of spare part 1 is

We obtain

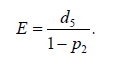
The expected cost of part 1 defined as n approaches infinity is
Similarly, the expected value of the cost defined for spare part 2 is
One finished product is assembled using Part 1 and Part 2. An enterprise can only obtain profit when qualified finished products are sold in the market. Therefore, we first analyse the qualified rate of assembled finished products, that is, the probability of not being returned after entering the market. Let event A represent that Part 1 enters the assembly process, namely

Let event B represent that Part 2 enters the assembly process, namely

Thus, the unqualified rate of spare parts entering the assembly process is

Even if both spare parts are qualified, the assembled finished product is not necessarily qualified. According to Table 1, the unqualified rate in this case is p3 =10%, and the qualified rate is 1− p3.
Then the probability of successful final sale is

From equations (6) (7) (8) (9), we can get

The sales revenue obtained from each assembled finished product is
The inspection cost for Part 1 is W2= x1d1 ; The inspection cost for Part 2 is W3= x2d2.
Finally, when choosing whether to inspect, the total purchase cost of spare parts is
The inspection cost for the assembled finished product is W5= x3d3. The replacement loss for unqualified finished products returned by customers is

To obtain a reasonable decision scheme, we need to maximize the profit, namely

The objective function is derived as:

Given the defective rates of the two spare parts and the finished
product, decisions are made for each stage of the enterprise’s
production process.:
a) Whether to inspect the spare parts (Part 1 and/or Part 2).
If a certain type of spare part is not inspected, all such parts
directly enter the assembly process. If inspection is performed,
any defective parts identified are discarded immediately.
b) Whether to inspect each finished product. If no inspection is
performed, all finished products directly enter the market. If
inspection is performed, qualified products enter the market,
while unqualified products proceed to the next processing
step.
c) Whether to disassemble unqualified finished products. If
disassembly is performed, the disassembled parts repeat
Steps a) and b) for further processing. If disassembly is not
performed, unqualified finished products are discarded
directly.
d) For unqualified products returned by customers, the enterprise
shall unconditionally replace them at its own cost, and the
unqualified products shall repeat Step c).
The values of x1,x2,x3 can be obtained by calculating Formula (10), which are used to determine whether to inspect the spare parts and finished products. When considering whether to disassemble unqualified products, a comparison is made between the sum of the disassembly cost and assembly cost d9 + d6 and the sum of the unit purchase prices of the spare parts d4 + d5 . If d9+ d6 > d4 + d5 , disassembly of unqualified finished products is rejected; otherwise, disassembly is adopted.

By calculating the objective function, the corresponding values of x1,x2 and x3, under different scenarios are obtained. The detailed results are presented in Table 2 below:
Table 2:Results of x1,x2,x3 under different cases.

By comparing the magnitude of d9+ d6 > d4 + d5 the
unqualified finished products in Cases 1 to 5 are disassembled,
while those in Case 6 are not disassembled. Based on the above two
decision criteria, the obtained decision schemes and corresponding
indicators are as follows:
Case 1: Part 1 is inspected, Part 2 is inspected, the assembled
finished product is not inspected, and the returned unqualified
finished product is disassembled. The profit per finished
product is 14.3556 yuan.
Case 2: Part 1 is inspected, Part 2 is inspected, the assembled
finished product is not inspected, and the returned unqualified
finished product is disassembled. The profit per finished
product is 5.1000 yuan.
Case 3: Part 1 is inspected, Part 2 is inspected, the assembled
finished product is not inspected, and the returned unqualified
finished product is disassembled. The profit per finished
product is 11.9556 yuan.
Case 4: Part 1 is inspected, Part 2 is inspected, the assembled
finished product is inspected, and the returned unqualified
finished product is disassembled. The profit per finished
product is 7.3000 yuan.
Case 5: Part 1 is not inspected, Part 2 is inspected, the
assembled finished product is not inspected, and the returned
unqualified finished product is disassembled. The profit per
finished product is 9.9600 yuan.
Case 6: Part 1 is inspected, Part 2 is not inspected, the
assembled finished product is not inspected, and the returned
unqualified finished product is not disassembled. The profit per
finished product is 19.3545 yuan.
Conclusion
This paper uses hypothesis testing and probability statistics methods to make decisions at each stage of the production process. By conducting regular hypothesis tests, it assesses whether it is worthwhile to invest in more expensive raw materials or advanced production equipment, timely identifies problems in the production process, helps enterprises conduct cost-benefit analysis, thereby improving product quality and customer satisfaction. Furthermore, enterprises can evaluate the advantages and disadvantages of different solutions based on data and statistical analysis to make more scientific decisions. Compared with [10], we found that although the methods (tools) used were different, the resulting decision-making options were essentially similar.
Fund Project
National Natural Science Foundation of China (Nos. 11771007); Henan Natural Science Foundation (Nos.252300423520,262300421861) and Nanyang City Basic and Frontier Research Program Project.
References
- Meng Qingyu, Liu Tingting (2020) Standard Supply and Supporting System for Remanufacturing Industry [J]. China Industrial Economy 5: 134-152.
- Xie Jiaping, Chi Linna, Liang Ling (2019) Optimal Production Decision under Carbon Emission Constraints [J]. Chinese Journal of Management Science 27(8): 123-132.
- Fine CH (1986) Quality improvement and learning in productive systems [J]. Management Science 32(10): 1301-1315.
- Gal-Or E (1983) Quality and quantity competition [J]. The Bell Journal of Economics 14(2): 590-600.
- Mao Shisong, Cheng Yiming, Pu Xiaolong (2019) A Course in Probability and Mathematical Statistics (3rd Edition) [M]. Beijing: Higher Education Press.
- Yang Bo, Hu Zhao (2018) A Brief Discussion on the Setting of the Null Hypothesis in Hypothesis Testing [J]. Statistics & Decision 12: 79-81.
- Lu Yali (2017) Analysis of Two Types of Errors in Hypothesis Testing [J]. Journal of Higher Education 38(6): 112-115.
- Xu Yongpeng (2016) Discussion on Sampling Inspection Scheme for a Batch of Products [J]. Industrial Engineering and Management 21(3): 145-150.
- Shen Weijun (2015) Shen Shaojun. Research on Enterprise Cost Control Based on Value Chain Management [J]. Accounting Research 4: 89-96.
- Liang Haizhou, Wang Jialu, Yuan Xin, et al. (2021) Decision-making Optimization of Remanufacturing Production System under Uncertain Quality [J]. Computer Integrated Manufacturing Systems 27(5): 1432-1441.
- Organizing Committee of the National College Mathematical Modeling Competition (2024) Higher Education Press Cup National College Mathematical Modeling Competition Problems [EB/OL].
- Jiang Qiyuan, Xie Jinxing (2020) Selected Cases of Mathematical Modeling [M]. Beijing: Higher Education Press.
- Li Taixin, Jin Xihan (2022) Research on Optimization of Enterprise Production Decision under Digital Transformation [J]. China Industrial Economy (3): 123-141.
- Pan Rongrong, Luo Jianqiang, Yang Zichao (2023) Digital Technology Empowering the Servitization Transformation of Manufacturing Enterprises [J]. China Industrial Economy 2: 132-150.
- Wu Peng, Lü Youchang (2024) Multi-period Production Decision Optimization for Remanufacturing Systems considering Quality Uncertainty [J]. Journal of Management Sciences in China 27(1): 45-58.
-

This work is licensed under a Creative Commons Attribution-NonCommercial 4.0 International License.


