


 Research Article
Prediction of Scale Formation and Corrosion Problems Associated with the Use of Groundwater in Industry: A Case Study in Northeast Cairo, Egypt
Received Date:January 27, 2026; Published Date:March 12, 2026
Abstract
Objectives
Using of the groundwater in industry is recommended as an important alternative solution to overcome the deficiency of fresh surface water resources in Egypt. This work aims to predict the scaling and corrosion impacts that may result from using the groundwater in industrial activities.
Material and Methods
Study method showed that 35 water samples were collected from the study area and analyzed for major ions using ion chromatographic and inductively coupled plasma- spectrometric techniques.
Results
The study results showed that 42.8% of sampling sites are being neither precipitating nor dissolving a scale layer of CaCO3, which make them suitable for being as source of industrial water. In case of using Stiff Davis index, results showed that 74.28% of the sampling sites were also suitable for industrial water in the studied area. On the other hand, using Rhyznar stability index, showed that 54.28% of these values were corrosively aggressive. While in case of using of Puckorious Stability 71.42 % of the sampling sites were showed little scaling and corrosion tendencies, while the rest of sampling sites with 28.57 % had tendency of little scale formation.
Conclusion
Study results recommend the using of suggested modified advanced water treatment method to mitigate the predicated corrosion problems resulting from using of groundwater at the studied areas.
Keywords:Groundwater; Scale Formation; Corrosion; Saturation Index; Water Treatment
Introduction
Egypt is an arid country in north-east Africa, but has a large hydro-geologic potential with many groundwater aquifiers widely distributed throughout the country. Groundwater serving a wide variety of users such as the agricultural, domestic, commercial, recreational and industrial sectors [1]. It is regarded as a stable resource compared to surface water, particularly in areas like Egypt, where the fresh surface water is scarce or occasionally supplied [1]. The aquifers are large water reservoirs, which provide buffer storages during the dry years and their quality is usually better than that of the surface water. it was reported that the quality of groundwater plays an essential role for quantifying the water state with respect to the necessities of human industrial needs. Moreover, the groundwater quality is a vital determinate of the efficient operation of many industrial sectors [2].
Variable water resources in Egypt are limited mainly to the Nile River, rainfall and groundwater reservoirs. In Egypt, fresh groundwater contributes to less than 20% of the total potential of water resources, where the groundwater resources mangment provides solution against decline in water sources, especially in areas where aridty is increasing [3].
The quality of the groundwater can be seriously threatened directly or indirectly by the climatic changes, natural processes, human activities and atmospheric inputs [4]. The most common crucial problems associated with the quality of groundwater are scale formation and corrosion phenomena (It was defiend tha). Such problems decrease the effectiveness of industrial water systems and increase the maintenance (or replacing) costs of production equipment [5,6]. It was reported that the scale formation is a term used to describe any undesirable substances precipitated on the metal surfaces such as supply water systems (tubes, pipes, valves, etc.). It is, for instance, consists of deposited minerals, corrosion products, bacterial accumulation and deposited silt and sand grains coming from aquifers. The scale that is deposited inside the water systems of industrial facilities often causes serious technical problems such as blockages in water pipelines and declines in thermal transfer in heat exchangers (Fuller, 2014; Egbueri, 2020). It was reported that the critical parameters affecting the formation of scales are water pH, temperature, alkalinity, total hardness, calcium hardness, ionized silica and dissolved gases as well as dissolved minerals such as calcium carbonate. Technically, the scale has a low thermal conductivity of 0.2 to 1.3 Btu/hrft0F which prevents proper cooling of metal surface on which it forms. From the economic point of view, the scale formation can greatly affect heat transfer performance, for instance, 1mm,1.5mm and 7mm thick scales can increase cost by 7.5%, 15% and 70%, respectively [5,6].
Materials and Methods
Study Area and Existing Industries
It was defiend that the corrosion is the partial dissolution of the materials comprising the treatment and supply systems, pumps, pipes, valves and tanks. It is a vital problem where it robustly affects the natural and industrial environments. Not only the corrosion leads to water leaks that in turn increase the maintenance (or replacing) costs, but it also contaminates water flow inside pipelines. In general, the corrosion rate depends on both the type of the metals and the physicochemical parameter of water. The most common factors affecting the corrosion rates of water industrial systems include abnormal water total dissolved solids, pH, chloride, high temperature and water flow rate, dissolved metals, dissolved gases, and bacterial load as well as iron and steel specifications of pipelines (Fuller, 2014; Egbueri, 2020). At the beginning of the new millennium, industrial water demand has been increasing in Egypt with the pace of industrial growth. most industrial areas exist in the greatly fruitful Nile Valley flood plain. The study area, Mostorod industrial area, located at the Northeast Cairo, Egypt, is one of these important industrial areas. Mostorod area contains a number of industries such as oil product processing projects, and it will receive more activities in the future. This work discusses the scale formation and corrosion problems that may result from using the groundwater in industrial activities in Mostorod area. In this regard, numerical water quality indices including Langelier Saturation Index (LSI), Ryznar stability index (RSI), Puckorius scaling index (PSI), Stiff-Davis index were used to reveal the groundwater quality. Accordingly, decision support suggestions will discussed to augment the likelihood of a successful usage of groundwater for the current and projected industrial projects [5,6].

The investigated area is located in the arid zone of Egypt and its climate is almost dry throughout most of the year, with very hot summer months and a mild winter ones. The climate is characterized by high evaporation rate (121.3 mm/year) that exceeds 9 times greater than the precipitation (14.7 mm/year. The area lies on the eastern bank of the Nile River, within the latitudes 30° 06’ 15” and 30° 10’ 45” north and longitudes 31° 15’ 49” and 31° 22’ 45” east (Figure 1). It overlooks directly Ismailia Canal that is a branch of the Nile River in the southeastern part of the Eastern Nile Delta. The land surface is nearly flat and rises 16m above mean sea level (amsl) in the west to 14m (amsl) in the east.
The common land use patterns in Mostorod area are the residential, agriculture and industry lands. The study area occupies part of the eastern Nile River floodplain formed of a Holoceneclayey silt layer (5-15m thick). It is underlain by the Pleistocene graded sand and gravel layer representing the main aquifer (Figure 2). The field investigations revealed that these wells are of 3-8 inches diameters and have depths ranging from 15-30m (shallow wells) in the urban area to 50-60m (relatively deep wells) in the industrial and agricultural areas. Depth to water (from the ground surface) in wells that tap the aquifer ranges from about 2.3m near Ismailia Canal in the west and northwest to 4.5m in the east and south.

Existing industries in Mostorod area are numerous and strategic. The main industrial sectors are Cairo Oil Refining Company (CORC), Public Company for Ceramics and Porcelain, Sornaga Company for Ceramics, Mostorod Water Treatment Station, Petroleum Pipeline Company, Misr Petroleum Company, Petroleum Gas Company, Misr Glass Company, Al Saad for Aluminum Company, and Public Company for Ceramics and Porcelain (Figure 3). As oil product processing projects are among the emerging industries, the Egyptian Refining Company (ERC) is established by the Egyptian government in recent years in Mostorod area to meet the increasing demand for refined oil products in Egypt. The ERC aims to upgrade the range of products and comprises several new units (OPEC, 2016).
Sampling and Laboratory Analysis Techniques
It was observed that the representative thirty-five groundwater samples collected from production wells tapping the Pleistocene aquifer and two surfacewater samples taken from Ismailia Canal. Before sampling process, all wells purged for about 20 minutes to remove the standing water in casings (at least 3 to 5 times of the internal volume of the well water is removed). Concurrently, physicochemical parameters, including water pH, Electrical Conductivity (EC), Total Dissolved Solids (TDS) and Dissolved Oxygen (DO) carried out in-situ to observe the water chemical stability. After stabilization of these parameters, the groundwater samples collected in 2 liters-polyethylene bottles rinsed twice with the same water of a well. Filtration of surface water samples carried out using 0.45 μm pore-sized papers. For trace element analysis, drops of concentration. Nitric acid were added to the samples to decrease the pH value (<2 pH unit) in order to mitigate the metal precipitation. The bottles were closed firmly to prevent evaporation and contamination, and they were kept in a refrigerator (at ~ 4ºC), and in a short period transported to the laboratory to conduct the required analyses. Coordinates of sampling sites identified by the Global Positioning System device (GPS) model-eTrex, Personal Navigator Garmin Ltd. The collected water samples analyzed chemically for major ions and trace elements following the standard analytical protocol descried by [7] ASTM, 2024. The analysis carried at the water analysis unit of Desert Research Center, Cairo, Egypt. Dissolve d major ions for which concentrations determined in water from samples comprised bicarbonate (HCO3), chloride (Cl-), calcium (Ca++), magnesium (Mg), sodium (Na) and potassium (K). The major cations (Na, K, Mg and Ca) and major anions (HCO3, SO4, and Cl) were determined by ion chromatography (ICS-1100,

Dionex, Sunnyvale, CA, USA). The concentrations of trace elements including cupper (Cu), iron (Fe), nicle (Ni), manganese (Mn) and lead (Pb) measured by inductively coupled argon plasma (ICAP, Thermo 6500). The content of the chemical constituents expressed in terms of mg/L. Other physical properties of water (pH, EC, TDS and DO) determined by a water- quality multiprobe device, Manta 2, Model Sub 3, USA. The anion-cation balance method presented here to determine the reliability of major ion analyses of fresh- or saline water assumes that major ions comprise most of the total dissolved solids in a water sample, and requires that all major ion concentrations measured.
Using Different Scale Formation and Corrosion Indices
In order to assess the corrosion and scale formation that may result from using the groundwater in industries in the study area, the common indices of Langelier SaturationIndex (LSI), Ryznar Stability index (RSI), Puckorius Scaling Index (PSI), and Stiff-Davis Index (SDI), were calculated (Table 1). The LSI is an equilibrium model derived from the theoretical concept of saturation and provides an indicator of the degree of saturation of water with respect to calcium carbonate. The LSI approaches the concept of saturation using pH as a main variable. Bicarbonates (mg/l) concentration was used to express the water alkalinity as follows: The Bicarbonates (mg/l) concentration will be used instead of Alkalinity as will be used in LSI calculator, based on the relation:
Bicarbonate (mg/l)=Total Alkalinity in mg/l as CaCO3 x 1.22 [8]. The RSI is an empirical method for predicting scaling tendencies of water based on a study of operating results with water of various saturation indices. This index is often used in combination with the Langelier index to improve the accuracy of predicting the scaling or corrosion tendencies. The RSI indicates the degree of saturation of CaCO3 in water and was calculated by pH, alkalinity (bicarbonate), calcium concentration, total dissolved solids. The PSI attempts to quantify the relationship between saturation state and scale formation by incorporating an estimate of buffering capacity of the water into the index [8]. It was calculated in a manner similar to the RSI. An equilibrium pH (pHeq) rather than the actual system pH was used to account for the buffering effects (Table 1). It was observed that Puckorius Scaling Index (PSI) attempts to quantify the relationship between saturation state and scale formation by incorporating an estimate of buffering capacity of the water into the index .The best review of the LSI, RSI and PSI methods was made independently by Cavano in an article published in The Analyst magazine in the fall of 1999.Cavano reported that the PSI method provided the most accurate values of the three methods. Total dissolved solids were between 500 and 1,000 parts per million (ppm), The calcium hardness (as CaCO3) was between 50 and 700 ppm, The total alkalinity (as CaCO3) was between 10 and 800 ppm, and The temperature was between 100 and 150°F (38 and 66°C). This index was the most complying with the study results (Table1), as 90% of the Mostord sampling sites measuring parameters were complying with PSI’s chemical parameters ranges (Table2). The SDI method is one of the easiest ways to calculate calcium carbonate scaling tendencies. The Stiff-Davis index attempts to overcome the short comings of the Langelier Index with respect to high total dissolved solids’ waters and the impact of “common ion” effects on the driving force for scale formation. Like the LSI, the Stiff-Davis index has its basis in the concept of saturation level. The solubility product used to predict the pH of saturation (pHs) for a water is empirically modified in the Stiff-Davis index. Stiff-Davis indices will predict that water is less scale forming than the LSI calculated for the same water chemistry and conditions. The deviation between the indices increases with ionic strength. Interpretation of the index is by the same scale as for the Langelier Saturation index, (Table 1). The LSI should be used for low TDS ranges (<10,000 ppm) and the stiff -Davis (S&DSI) is used for high TDS ranges (>10,000 ppm). In general, the Langelier Saturation Index (LSI) is used for brackish waters and the Stiff & Davis Stability Index (S&DSI) for seawater. At the pH of saturation (pHS), the water is in equilibrium with CaCO3. The novelty of our study being clearly showed by a comparive study of using different saturation indexes of groundinorder to select the suitable sites which will be used in industrial purposes with suggesting a flow chart of modified ground water treatment method usingdifferent alternatives of Polyphosphate, orthophosphatesor quatarnary ammnoium chloride corrosion inhibitors, this were not showed by other authors ‘s articles [9].
Table 1:Corrosion and scale formation indices (IwonaSkoczko et al,2019, Calford Odhiambo Otieno, et al, 2024).
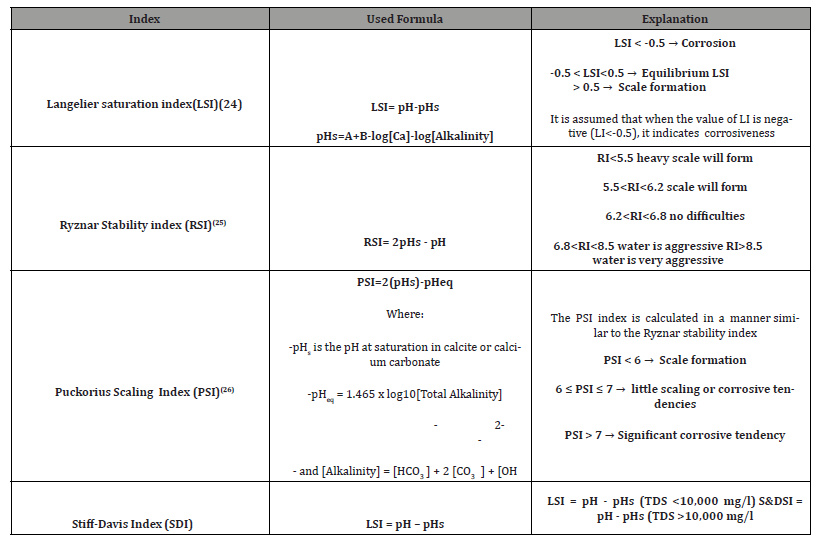
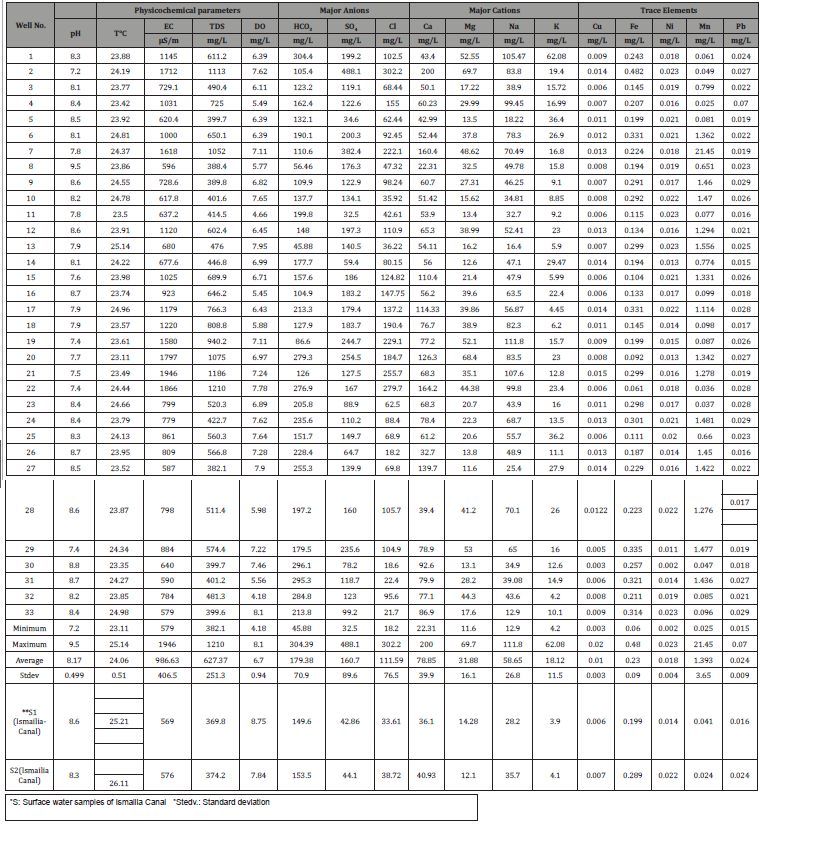
Table 2:Chemical consituent data of water samples from the Quaternary aquifer and Ismailia Canal, Mostorod area, Northeast Cairo, Egypt.
Results and Discussion
Chemistry of Groundwater
Physico-chemical parameters and concentrations of major ions and some trace elements determined for water samples collected from the Pleistocene aquifer and the Nile water in Ismaila Canal are listed in Table 3-2. In addition, a statistical summary of the chemical constitunents is also presented in Table 3-1. Ion balance analysis was performed on each sample; the results indicated that the percentage differences between the sum cations and anions were less than ±4%. The chemical results reveal that the physicochemical parameters of the Pleistocene groundwater show a wide range and are generally higher than those of Nile water of Ismailia Canal. The high standard deviations Table 3-1 can be attributed to the influence of evaporation and hydrogeochemical processes such as dilution, water-rock interaction, mixing, etc. The groundwater in the study area is slightly alkaline to alkaline where the pH varies from 7.2 to 9.5 standard unit (average= 8.17). The EC and salinity (as TDS) have values ranging from 579-1964μS/ cm (average= 986.6 μS/cm) and 382-1210 mg/L (average= 627.4 mg/L). Both the EC and TDS values are found to increase towards the east, away of the Ismailia Canal that contains fresh water. The dissolved oxygen (DO) concentration in the examined groundwater samples is lower than that in the water of the Ismailia Canal. The DO has values ranging from 4.18 mg/L to 8.10 mg/L (averge= 6.10 mg/L). It was observed that the dissolved major ions in the studied groundwater samples are generally higher than those in the water of Ismailia Canal, as showed in table 2. The concentrations of the major ions in the groundwater decrease generally due the charchtersitices of west region (i.e. towards the Ismailia Canal). The HCO3, SO4 and Cl ions have concentration values ranging from 45.9- 304.4 mg/L (average= 179.4 mg/L), 32.5-488.1mg/L (average= 160.7 mg/L) and 18.2-302.2 mg/L (average = 111.6 mg/L), respectively. The Ca, Mg, Na and K ions have values varying between 22.3 mg/L and 200 mg/l, 11.6 mg/l and 69.7 mg/L, 12.9 mg/l and 111.8 mg/L , and 4.2 mg/l and 62.1 mg/L with respective averages of 78.9 mg/L, 31.9 mg/L, 58.7 mg/L and 18.1 mg/L, respectively. The surface water of Ismailia Canal has larger contents (meq/L) of calcium and bicarbonate ions and, therefore, this water typically is a calcium bicarbonate water. On the other hand, the content of major ions varies spatially in the Pleistocene aquifer in the study area. Generally, the groundwater from the aquifer is predominantly bicarbonate and sulphate types and is distinctive in the study area because of its large calcium component The concentrations of trace elements in the examined groundwater samples differ from place to place, and they are generally greater than those of the Ismailia Canal water (Table 2). The range and (average) values of the Cu, Fe, Ni, Mn, and Pb in the groundwater samples are 0.003-0.02 mg/L (0.01 mg/L), 0.06-0.48 mg/L (0.23 mg/L), 0.002-0.023 mg/L (0.018 mg/L), 0.025-21.5 mg/L (1.4 mg/L), and 0.015-0.07 mg/L (0.024 mg/L), respectively. The occurrence of the these elements with high concentration levels in the Pleistocene-groundwater samples may be the result of the mixing with agricultural, municipal and industrial effluents [9].
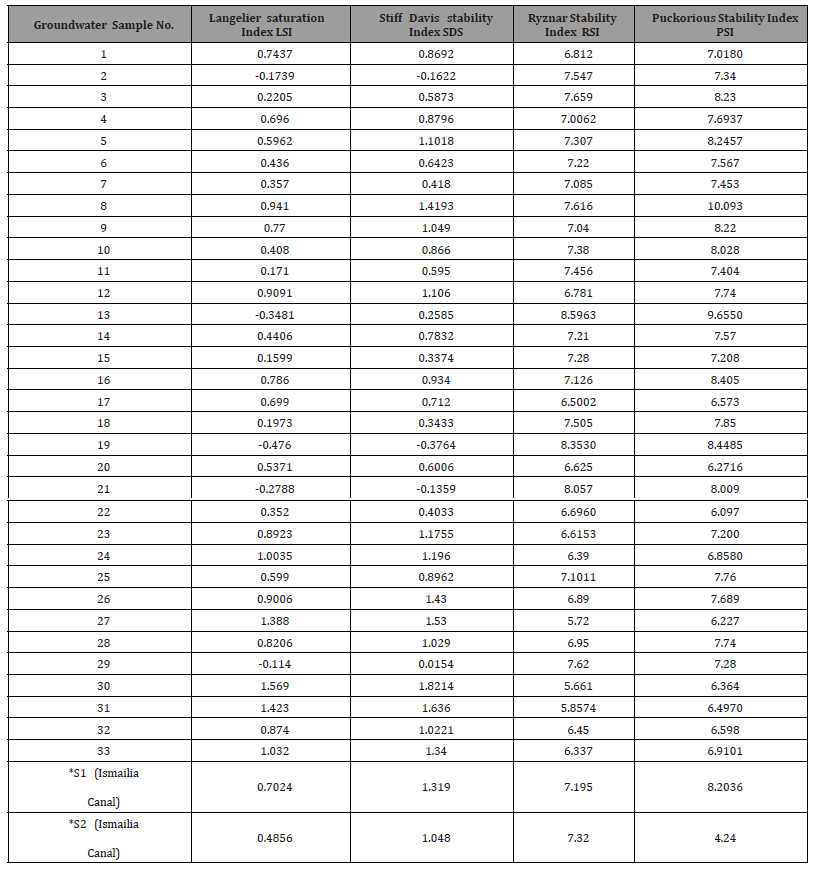
Table 3:Using scale and corrosion water saturation indexes.
The effects of different anions and cations concentrations in industrail water
It was reported that HCO3− influences the acidity of water, which in turn makes it corrosive. The concentration of bicarbonate in the examined ground water (Table3-2) was with average =179.38 mg/l which ranged from 45.9-304.4 mg/L. Similarly, the presence of sulfate in water could facilitate its corrosion activities. Table 2. showed that sulfate concentrations were ranged from 32.5- 488.1mg/L with (average= 160.7 mg/L), the metallic materials in water distribution channels are easily exposed to major corrosion risks due to the conversion of sulfate in water to corrosive sulfides by anaerobic sulfate-reducing bacteria. An increment in the number of sulfur-producing bacteria increases the amount of hydrogen sulfide gas that reacts with metallic surfaces of the distribution system to cause corrosion. High chloride concentrations can increase the tendency of water to cause corrosion in distribution systems. Table 2, showed that the chlorides values are ranged (18.2-302.2 mg/L) with average 111.6 mg/L. Nearly all metals will corrode to some degree. The rate and extent of the corrosion depend on the degree of dissimilarity of the metals and the physical and chemical characteristics of the media, metal, and environment. In water that is soft, corrosion occurs because of the lack of dissolved cations, such as calcium and magnesium in the water. In scale forming water, a precipitate or coating of calcium or magnesium carbonate forms on the inside of the piping. This coating can inhibit the corrosion of the pipe because it acts as a barrier, but it can also cause the pipe to clog. Table 2. showed that calcium and magnesium and sodium mean average results were 78.9 mg/L, 31.9 mg/L and 58.7 mg/L, respectively. Water with high levels of sodium, chloride, or other ions will increase the conductivity of the water and may promote corrosion. High dissolved solids, such as salts and can induce chemical corrosion. Table 2, showed that the both EC and salinity (as TDS) have values ranging from 579-1964 μS/cm (average= 986.6 μS/cm) and 382-1210 mg/L (average= 627.4 mg/L). The Iron release from corroded iron pipes is the principal cause of “colored water” problems in drinking water distribution systems. The corrosion scales present in corroded iron pipes restrict the flow of water, and could deteriorate the water quality. Table 2, showed that iron values were ranged from 0.06-0.48 mg/L and with average (0.23 mg/L). The effect of dissolved oxygen (DO), as key water quality parameter, on iron release from the old corroded iron pipes. It was reported that the interaction of DO with iron pipes covered with naturally aged scales (several decades old), as are present in most unlined iron/steel pipes being in use in drinking water distribution systems [7]. On the other hand, table 2, showed that the DO values, ranging from 4.18 mg/L to 8.10 mg/L with averge value = 6.10 mg/L for the groundwater samples. It was reported that copper can enter into the water through natural deposits in rock and soil, but more often, as a result of corrosion in household plumbing. As the result measured concentrations with different anions, cations and trace elements as: Sulfate, Chlorides, TDS, Ca, Mg, Na, K and Fe etc. [10,27]. Table 2. showed that copper values were ranged from 0.003-0.02 mg/L with average value (0.01 mg/L). As the result copper showed lower tendency for scale formation in the ground water samples used in study.
Using Scale and Corrosion Water Saturation Indexes as Indicators for Industrial Water Quality
The using LSI in industrial water assessment was considered as
one of the most frequently used indices used to assess the corrosive
impact of CaCO3 concentrations on the water distribution systems
and industries. Table 3 and Fig 5. showed that the highest LSI values
were found in sites (30, 31, 27, 33, 24, 8, 12, 26, 23, 32, 28, 16, 9, 1,
S1 ,17 ,4 ,16, 5 and 20) with values (1.5,1.423 and 1.38, 1.032, 1.003,
0.94, 0.909, 0.906, 0.89, 0.87, 0.82, 0.78, 0.77, 0.74, 0.702, 0.699,
0.696, 0.59,and 0.53) which means the water tendes to precipitate
a scale layer of CaCO3 (Table1), which also showed that 57.1 % of
the selected 35 ground water sampling sites, had the tendency to
form scale layer of CaCO3 which lead to cause scale blocking layer
inside the water tubes when using these ground water sites as a
water source for the selected Mostord industrial region. Table 3
and Fig 5 Also showed that the rest of sampling sites (42.8%)
niether precipating nor dissolving a scale layer of CaCO3(water is in equilibrium) (Table1), As the result, these sampling sites
(42.8%) were suitable for using as a source of industrial water in
Mostord area. On the other hand Table 2. And Fig 6 showed that
the highest pH values were found in sampling sites (8, 30,16, 26,
,31,S1) with values (9.5, 8.8, 8.7, 8.7, 8.7, and S1) these will support
the increasing probability of scale formation at these sites as being
detected by using LSI. Using Stiff-Davis index as showed in Fig 7,
when its TDS values were <10,000 mg/l (Table 1). Table 3 and
Figure 7 showed that the highest SDI values were found in sites
(30, 31, 27, 8 , 24, 5,12, 32,23) with values (1.8,1.63 ,1.53, 1.41,
1.17, 1.101,1.06, 1.022,0.403) which means that the water tendes
to precipitate a scale layer of CaCO3 as showen in (Table 1). It was
observed that Fig 7 showed that 26.4 % of the selected 35 ground
water sampling sites, had the tendency to form scale layer of CaCO3
which lead to cause scale blocking layer inside the water tubes when
using these ground water sites as a water source for the selected
Mostord industrial region. Table 3 and Fig 7, showed that the rest of
sampling sites (74.28%) niether precipating nor dissolving a scale
layer of CaCO3(water is in equilibrium) (Table 1), As the result,
these sampling sites(74.28%) were suitable for using as a source
of industrial water in Mostord area. In case of using Ryznar index
the Table3. and Figure 8, showed that the highest RSI values were
found in sites (13, 19, 21, 3, 8, 2, 11, 10, S2, 5, 15, 6, 14, 16, 25, 9, 28, 26, 1, 22, 23,17, 24, 32, 33, 31) with values (8.59,8.35, 8.05, 7.65,
7.61, 7.54,7.45,7.38, 7.32, 7.30, 7.28,7.22,7.21, 7.12, 7.10, 7.04, 6.95,
6.89, 6.81, 6.78, 6.69, 6.61, 6.5, 6.43, 6.33 and 5.83). These values
showed that 54.28% of these values were corrosively aggressive as,
6.8 Study the using of advanced ground water treatment system An modified treatment method is being sugested to overcome
the corrosive potiential resulted from the previous studied
groundwater corrosion indixes calculations, as showed in Figure
10. The intake well is suggested to be in the inlet opening, where
a screen is suggested to separate the floating material, then
Aerators used to remove the gases from the water, where the
outlet water passed to coagulant tank where the coagulant is add
into the water. Then the water inter flash mixer unit where the
coagulator are mixed. Then the clarification process (Flocculation
and sedimentation), where flocs being formed then getting settled
down in sedimentation step. The outlet water then suggested to be
passed to filter beds where fine and colloidal matter being removed
and finally the disinfection of treated well water is suggested to kill
microorganisms and also destroy organic impurities This suggested
treated ground water become suitable for household as reached
the distribution system. Injection of polyphosphate (corrosion
inhibition) or quatarnary ammnoium chlorideare necessary for
corrosion protection of different distribution water tubes in case
of using selected well water in the industrial purposes. In brine
phases results showed that “quaternary ammonium chloride
would not efficiently inhibitedcarbon dioxide corrosion for up 20
ppm of inhibitor concentration. At higher concentrations, such as 60 to 100 ppm were required to reduce carbon dioxide corrosion to
90% inhibition efficiency. On the other hand reverse Osmosis unit
added in case of using the selected ground water as demineralized
industrial source with costbenefit analysis stud, bsed on the kind
of industry. Figure 10. Suggested modified treatment flowchart of
intake well water used in industry The study results showed that, the highest LSI values were
found in sites (30, 31, 27, 33, 24, 8, 12, 26, 23, 32, 28, 16, 9, 1, S1
,17 ,4 ,16, 5 and 20), this showed that 57.1 % of the selected 35
ground water sampling sites, had the tendency to form scale layer
of CaCO3, leading to cause scale blocking layer inside the water
tubes when using these ground water sites as a water source for
the selected mostord industrial region, where the rest of sampling
sites (42.8%) are niether precipating nor dissolving a scale layer
of CaCO3(water is in equilibrium), As the result, 42.8% of these
sampling siteswere suitable for using as a source of industrial
water in Mostord area. In case of using Stiff-Davis index, the study
results showed that the highest SDI values were indicated in sites
(30, 31, 27, 8 , 24, 5,12, 32,23) with values(1.8,1.63 ,1.53, 1.41, 1.17,
1.101,1.06, 1.022,0.403), where these results showed that 26.4 %
of the selected 35 ground water sampling sites, had the tendency
to form scale layer of CaCO3, lead to cause scale blocking layer
inside the water tubes, where 74.28% of the rest of sampling sites
are niether precipating nor dissolving a scale layer of CaCO3(water
is in equilibrium), As the result were recommended to be used
as a source of industrial water in Mostord area. In case of using
Ryznar index, the study results showed that the highest RSI values were indicated in sites (13, 19, 21, 3, 8, 2, 11, 10, S2, 5, 15, 6, 14,
16, 25, 9, 28, 26, 1, 22, 23,17, 24, 32, 33, 31). As the result, there
will be corrosively aggressive as, 6.8 All of the experimental protocols were not need to get ethic
approval as there were no experimental animals used. All of authors consent that this manuscript was published in
this journal. No consent to participate. No Conflict of interest. All data generated or analyzed during this
study are included in this published article. Conflict of Interest: The authors declare no competing interest.


Conclusion and Recommendation
Funding: No Funds Ethics approval
Consent to Publish
Consent to Participate
Conflict of Interest
Data availability
Declarations
References
- Gleeson T, Cuthbert M, Ferguson G, Debra Perrone D (2020) Global Groundwater Sustainability, Resources, and Systems in the Anthropocene. Annu Rev Earth Planet Sci 48: 431-463.
- Abdel Moneim AA, Zaki S, Diab M (2014) Groundwater conditionsand the geoenvironmental impacts of the recent developmentin the south estern part of western desert of Egypt. journal of water resourcesand protection 6: 381-401.
- I.Abdel-Shafy, Aziz.Kamel (2016) Groundwater in Egypt issue: Location, amount, contamination, renewable, future overview. Egypt J Chem 59(3): 321-362.
- El-Sayed SA, Morsy SM (2018) Hydrogeological assessment of Moghra aquifer, North Western Desert, Egypt. Annals Geol Surv Egypt pp. 110-130.
- Shams M, Mohamadi A Sajadi SA, (2012) Evaluation of corrosion and scaling potential of water in rural water supply distribution networks of tabas, Iran. World Appl Sci J 17(11): 1484-1489.
- Valdez B, Schorr M, Quintero M, García R, Rosas N, (2010) Effect of climate change on durability of engineering materials in hydraulic infrastructure: an overview. Corrosion Engineering Science and Technology 45(1): pp. 34-41.
- Hassan Taghipour, Mohammed Shakerkhatibi, Mojtaba Pourabar, Medi Belvasi, (2012) Corrosion and scaling potential in drinking water distribution system of tbrize, Northwestern Iran, Health promotion perspective 2: 103-111.
- IwonaSkoczko, EwaSzatyłowicz (2019) Treatment Method Assessment of the Impact on the Corrosivity and Aggressiveness for the Boiler Feed Water. Journal of Water 11: 1-14.
- Bouslah S, Djemili L, Houichi L, (2017) Water quality index assessment of Koudiat Medouar reservoir, North Algeria using weighted arithmetic index method. Journal of water and land development, 35: 221-228.
- ASTM (2024) Standard specification of reagent water. ASTM D1193-06. United States. 11.01.
- Abbasi T, Abbasi SA (2012) Water quality indices. Elsevier, Amsterdam, Netherlad pp. 384.
- Brown RA, Kumar (2011) A New Perspective on Eratosthenes’ Measurement of the Earth. The Physics Teacher 49: 445-447.
- Calford Odhiambo Otieno, Alice Makonjo Wekesa (2024) Assessment of groundwater stability using corrosion and scaling trendenvy indices on selected springs in Menga region in Nyamira country, Kenya. Open Journal of Microphysics 14: 79-88.
- CERS (Center for Environmental Research and Studies) (2014) Method Statement of Groundwater Quality Baseline Study of ERC Refinery Project, Mostorod, Cairo, Egypt. Center for Environmental Research and Studies (CERS), Cairo University, Egypt 19.
- Environics (2010) EIA Study for Greater Cairo Metro Line No. 4 Phase 1-Final Report. National Authority for Tunnel, 297.
- Ibrahim M (2001) Earth and Environment Science. 69012089: 1-6.
- Lin L, Jiang W, Xu X, Xu P (2020) A critical review of the application of electromagnetic fields for scaling control in water systems: mechanisms, characterization, and operation: npj Clean Water 3: 25.
- Mirzabeygi M, Naji M, Yousefi N, Shams M, Biglari H et al. (2016) Evaluation of corrosion and scaling tendency indices in water distribution system: a case study of TorbatHeydariye. Iran: Desalination and Water Treatment.
- Palazzo J, van der Merwe, G Combrink (2016) The accuracy of calcium-carbonate based saturation indices in predicting the corrosivity of hot brackish water towards mild steel. journal of south America institute of Mining and metallergy 115: 1229-1238.
- Tavanpour N, Noshadi M (2016) Scale Formation and Corrosion of Drinking Water Pipes: A Case Study of Drinking Water Distribution System of Shiraz City: Modern Applied Science. 10(3): 166-177.
- Worley Parsons (2008) Environmental and Social Impact Assessment, ERC Hydro- Cracking Complex Project at Mostorod, Appendix 12.2, Clearance and Land Contamination Study Plan for North Plot and South Plot 1. Worley Parsons Infrastructure and Environment Limited, Maadi, Cairo, Egypt, 18.
- Worley Parsons (2008a) Egyptian Refining Company Environmental and Social Impact Assessment Erc Hydro-Cracking Complex Project at Mostorod, Final Version, Appendix 1.1–Upgrade Works Agreement: WorleyParsons Infrastructure and Environment Limited.
- WorleyParsons (2008b) Environmental and Social Impact Assessment Erc.
- Hydro-Cracking Complex Project at Mostorod, FINAL VERSION, Chapter 1 – Introduction: WorleyParsons Infrastructure and Environment Limited. Brown, R. A. and Kumar, 2011, A New Perspective on Eratosthenes’ Measurement of the Earth. The Physics Teacher 49: 445-447.
- UNIP (2023) Quality assurance for freshwater quality monitoring-technical guidance document. United Nations Environment Programme 1-76.
- USGS (2024) Potential corrosivity of untreated groundwater in Louisiana, Scientific investigation report 2024-5035, Department of transportation and development, U.S. Department of the Interior, Geological Survey 1-48.
UNESCO (United Nations Educational, Scientific and Cultural Organization) (2004) Groundwater resources of the world and their use, Zektser, I. S. and Everett, L. G.eds, UNESCO, IHP-VI, series on groundwater 6:1- 346.
-

This work is licensed under a Creative Commons Attribution-NonCommercial 4.0 International License.