 Research Article
Analysis of Serotonin in Caenorhabditis Elegans Subjected to Micro-Dosing with Psilocybin| Iris Publishers
Douglas B Craig1,3*, Rubeena Gosal1, Victoria Steele2, Sarah Thomson1 and Paul Holloway2
1Department of Chemistry, University of Winnipeg, Winnipeg, MB, Canada
2Department of Biology, University of Winnipeg, Winnipeg, MB, Canada
Douglas B Craig, Department of Chemistry, University of Winnipeg, Winnipeg, MB, Canada
Received Date:October 03,2025; Published Date:October 15, 2025
Abstract
A method was developed for the analysis of serotonin in Caenorhabditis elegans. Samples were subjected to solvent-solvent extraction from basic conditions into n-heptanol. The serotonin was then back-extracted into acetic acid, the solution diluted into basic buffer, and labelled with 3-(2-furoyl) quinoline-2-carboxaldehyde in the presence of cyanide. The sample was analyzed by capillary electrophoresis utilizing post-column laser-induced fluorescence detection within a sheath flow cuvette. Under these conditions serotonin was detected at 1 M. C. elegans was cultured in the presence and absence of psilocybin. The presence of psilocybin was found to decrease the concentration of serotonin from 0.9 to 0.5 mg/mg protein.
Keywords: Caenorhabditis elegans; Capillary Electrophoresis; Micro-Dosing; Psilocybin; Serotonin
Introduction
Micro-dosing is the practice of consuming small doses of traditional psychedelic drugs such as psilocybin on an intermittent, regular schedule. The micro-dose does not produce discernable physical or psychological effects. Typically, a micro-dose is between 1/10 and 1/20 of the dose of psychedelic drugs that would typically produce a psychedelic “trip”. For psilocybin this is 0.1 to 0.5 g of dried mushrooms or 1-5 mg of pure psilocybin. The most popular dosing schedule is to consume a micro-dose every 3 days. Microdosing is claimed by proponents to provide several psychological and social benefits including increases in creativity, productivity, sociability, focus, analytical thinking, positive mood, and memory [1,2]. Formal placebo-controlled trials of micro-dosing are few and anecdotal reports of benefits may be biased and inaccurate [3]. In this regard the current legal and regulatory climate makes scientific studies difficult to perform.
Psilocybin is a serotonergic psychedelic and its active metabolite, psilocin, interacts with serotonin 2A receptors [4]. Caenorhabditis elegans is a well-studied animal model of the human central nervous system and behavior but has advantages of small size, fast growth, ease of maintenance and possesses analogs of the human serotonin receptors [5]. By micro-dosing C. elegans one can determine whether serotonin concentrations change in the worms and whether an underlying biochemical change may be responsible for the effects attributed to micro-dosing in humans. In this initialstudy a method was developed for the analysis of serotonin in C. elegans using solvent-solvent extraction, fluorogenic labeling with 3-(2-furoyl) quinoline-2-carboxaldehyde, and separation using capillary electrophoresis coupled to post-column laser-induced fluorescence detection within a sheath flow cuvette.
Methods and Materials
Organisms & Reagents: The N2 wild-type strain of Caenorhabditis elegans and E. coli OP50 were obtained from the Caenorhabditis Genetic Centre of the University of Minnesota (Minneapolis MN). Nematode Growth Media (NGM) agar consisted of 2.5 gL-1 peptone, 15 gL-1 agar (Accumedia, Boulder CO), 1 mM MgCl2, 1 mM CaCl2 and 25 mM K2HPO4/KH2PO4 (VWR, Edmonton AB) (pH 7.0). Psilocybin was obtained as a 1 mgmL-1 solution in methanol from Toronto Research Chemicals (Toronto ON). 3-(2-furoyl) quinoline-2-carboxaldehyde (FQ ATTOTAGTM FQ derivitization reagent) was obtained from Invitrogen (Waltham MA). Serotonin (5-hydroxytryptamine, 3-(2-aminoethyl)-1H-indol- 5-ol) and all other chemicals were purchased from Sigma-Aldrich (St. Louis MO).
Capillary Electrophoresis (CE) Instrument: Separations were performed using an in-laboratory constructed CE instrument which utilizes post-column laser-induced fluorescence detection within a sheath flow cuvette. Details of the instrument, including a schematic, have been published previously [6]. The injection end of a 30 cm long uncoated fused silica capillary with inner and outer diameters of 10 and 145 mm respectively, as well as a 0.5 mm diameter platinum wire connected to a high voltage power supply, was placed into a buffer containing vessel in the injection carousel. Approximately 1 mm of external polyamide coating was removed by flame from the detection end of the capillary before its insertion into a quartz sheath flow cuvette containing a 250 X 250 μm inner bore (Hellma, Markham ON). The capillary was grounded through the sheath flow buffer within the cuvette. The 488 nm emission of a solid-state laser (Coherent, Santa Clara CA) was focused using a 6.3 X, N.A. 0.2 microscope objective (Melles Griot, Carlsbad CA) approximately 10 μm below the detection end of the capillary. Emission was collected at 90o using a 60X, N.A. 0.7 microscope objective (Universe Kogaku, Oyster Bay NY) and passed through a 615DF45 optical filter (Omega Optical, Brattleboro VT) and a slit, and onto a photomultiplier tube (PMT, Hamamatsu model 1477, Shizuoka Japan). The analog signal was collected at 10 Hz and digitized using a Pentium 4 computer through a PCI-MIO-16XE I/O board utilizing LabViewTM software (National Instruments, Austin TX). The same board was used to control the electrophoresis voltage and set the PMT bias, which was at 1100 V. The buffer flowing through the sheath flow cuvette was 10 mM sodium tetraborate containing 5 mM NaCN, 25 mM SDS, and 2.5 mM acetate (pH unadjusted, ~9.2). Sample and running buffer were identical to the sheath buffer. Data was analyzed using IgorProTM (WaveMetrics, Lake Oswego OR).
C. elegans culture: N2 wild-type worms were grown at 22°C on Nematode Growth Media (NGM) agar plates inoculated with E. coli OP50. Standard methods were used to maintain cultures of N2 [7]. N2 was transferred to fresh plates by chunking agar from an old plate to a new one. Harvesting of worms was performed by washing an NGM plate of N2 worms with 1.5 mL of sterile M9 (Sigma-Aldrich, Mo. USA) in 3 increments of 0.5 mL. The combined wash was centrifuged at 1,200 RPM for 4 minutes followed by a rest of 2 minutes to pellet the adult worms. Supernatant was removed and the worms resuspended in 0.75 mL of sterile M9 and centrifuged as before. This step was repeated. The final pellet of washed worms was resuspended in 0.3 mL of sterile M9. Washed worms were immediately frozen at -80oC until used. Psilocybin was obtained as a 1 mg/mL solutions in methanol. Psilocybin methanol solution was added to freshly poured NGM agar plates to a final concentration of 14 mg/L (0.35 mg per 25 mL plate). Plates were inoculated with OP50 and incubated in the dark for 16 hours. C. elegans were transferred from NGM-OP50 plates to the psilocybin containing plates by chunking and were incubated in the dark at room temperature for 7 days before harvesting.
The protein concentration in the C. elegans pellets were determined using the Bradford assay against BSA as a standard.
Sample Preparation: 50 mL of the C. elegans pellets were suspended with 50 mL of 50 mM sodium tetraborate (pH unadjusted, ~9.2). 100 mL of n-heptanol was added and the sample vortexed for 1 min. The emulsion was separated by centrifugation at 13,000 x g for 3 min. 60 mL of the organic layer was put aside and 60 mL of fresh n-heptanol was added to the sample. The sample was again vortexed, centrifuged, and 60 mL of the organic layer put aside. This was repeated for a total of 3 extractions and the 3 volumes of 60 mL organic phase were pooled. 100 mL of 5 mM acetic acid was added to the pooled 180 mL of organic layer and vortexed for 1 min. The emulsion was separated by centrifugation at 13,000 x g for 3 min. 50 mL of the aqueous phase was removed and added along with 50 mL of 20 mM sodium tetraborate containing 10 mM NaCN, and 50 mM SDS (pH unadjusted, ~9.2) to a vial containing 100 nmoles of dry FQ. The sample was vortexed and incubated at 85oC for 60 min. This yielded a sample in buffer that was identical to the running buffer used in the CE separation. The samples were then diluted by addition of an equal volume of running buffer.
Results and Discussion
FQ is a non-fluorescent reagent that reacts with primary amines, such as serotonin (Figure 1), in the presence of cyanide to form a highly fluorescent product [8]. The use of a fluorogenic reagent is especially useful for high sensitivity analysis. Despite being in large excess, the residual labelling reagent produces very little signal while the product, often present at a low concentration, is highly fluorescent. This allows for a strong analyte signal in the presence of a low background. FQ has been used for the detection of small amines [9] and proteins [10], providing sub-nanomolar detection limits. The pKa of the amine group on serotonin is 9.97 and for the hydroxyl group it is 10.73. The product of the reaction of FQ and cyanide with serotonin at pH 9.2 is uncharged. SDS is commonly used in capillary electrophoresis as an additive to provide a pseudo-stationary phase which aids in the separation of uncharged analytes [11].

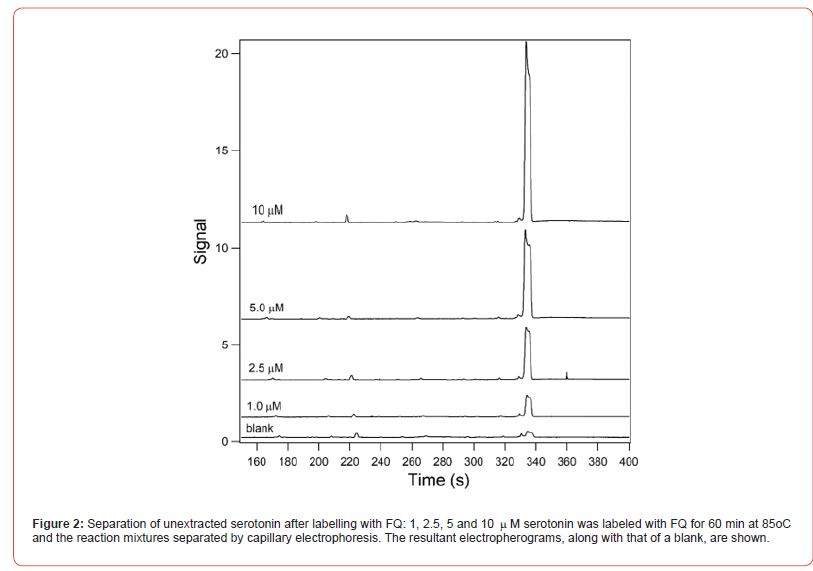
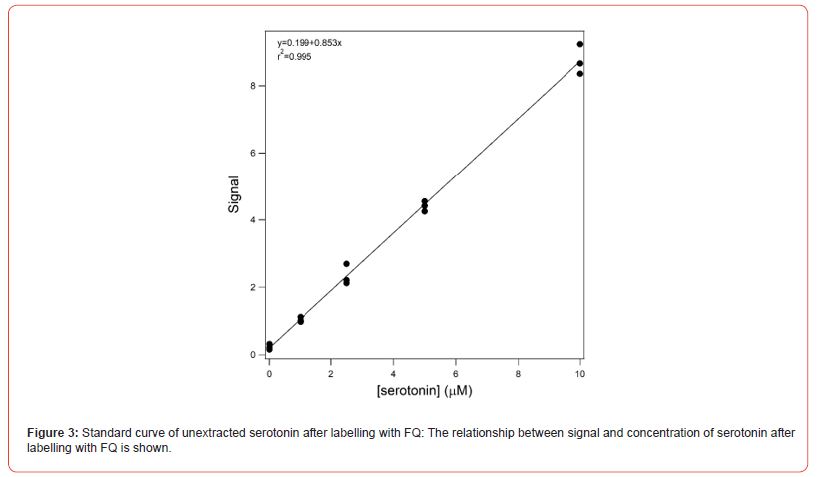
Figure 2 shows the resultant electropherograms for the separation of 1, 2.5, 5 and 10 mM labelled serotonin and a blank. Samples were made in triplicate. 50 mL of serotonin dissolved in 10 mM sodium tetraborate containing 5 mM NaCN, 2.5 mM acetic acid and 25 mM SDS (pH unadjusted, ~9.2) was added to 100 nmoles of dry FQ. The FQ was dissolved by vortexing and the sample incubated at 85oC for 60 min. Post-incubation the sample was electrokinetically injected into a 30 cm long capillary and separated at an electric field of 500 Vcm-1. The separation buffer was identical to the sample buffer. A small peak was present in the blank that had an identical mobility to that of the labelled serotonin. Separation time was less than 6 min. There was no need to flush the capillary between runs. Figure 3 shows the relationship between fluorescence signal and serotonin concentration. The relationship was linear between 1 and 10 mM with an r2 value of 0.995. The upper limit of 10 mM was due to saturation of the detector at higher concentrations.
Analysis of the C. elegans samples could not be performed without a prior solvent-solvent extraction. Because FQ reacts with proteins and other amines, which are widely abundant in all cells, labelling of the samples without pre-treatment resulted in a forest of overlapping and saturating peaks, which completely obscured the peak due to the labelled serotonin.
50 mL aliquots of control C. elegans and that treated with psilocybin were added to 50 mL of 50 mM sodium tetraborate (pH unadjusted, ~9.2). 100 mL of n-heptane was added to the sample and the sample was vortexed for 1 min in order to extract the serotonin [12]. The organic and aqueous layers were resolved by centrifugation for 3 min at 13,000 X g. 60 mL of the organic layer was removed and replaced with 60 mL of fresh n-heptane and the sample extracted a second time. 60 mL of the organic layer was again removed. The extraction was repeated for a third time and the 3 sets of 60 mL of organic phase were pooled. 100 mL of 5 mM acetic acid was added to the pooled organic phase. The sample was again mixed by vortex for 1 min to back extract the serotonin into the aqueous phase. The layers were resolved by centrifugation. 50 mL of aqueous phase was added to 50 mL of 20 mM sodium tetraborate containing 10 mM NaCN and 50 mM SDS.
50 mL of 50 mM sodium tetraborate (pH unadjusted, ~9.2) was added to 50 mL aliquots of 5, 10, and 25 mM serotonin and these standards were treated identically to that of the C. elegans samples. Blanks contained no serotonin. 100 mL of the samples were added to 100 nmoles of dry FQ. The FQ was dissolved by mixing with a vortex for 1 min and the samples incubated at 85oC for 60 min. 50 mL of sample was diluted with 50 mL of 10 mM sodium tetraborate containing 5 mM NaCN, 25 mM SDS and 2.5 mM acetic acid (pH unadjusted, ~9.2) prior to injection into the capillary.
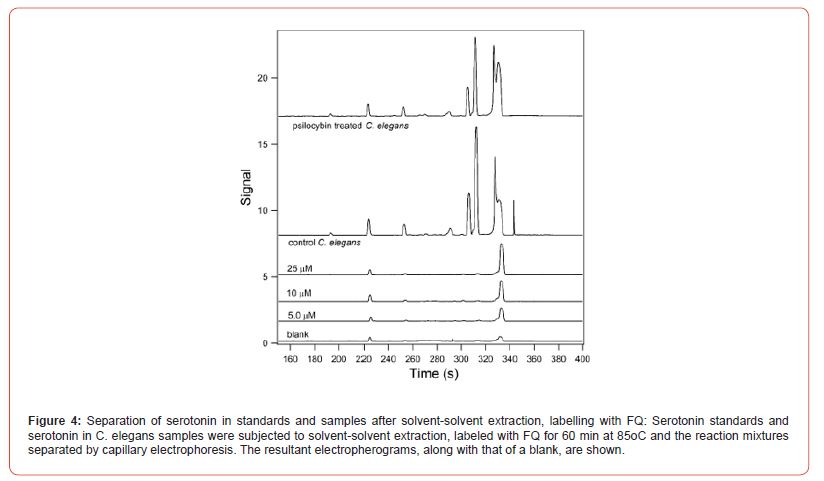
Figure 4 shows the resultant electropherograms for the analysis of blanks, standards, and samples that were subjected to solvent-solvent extraction prior to analysis. The C. elegans samples contained a small number of extra peaks that were not present in the standards. Presumably these were due to analytes that were coextracted along with the serotonin. This illustrates the importance of using a separation method in order to resolve these signals.
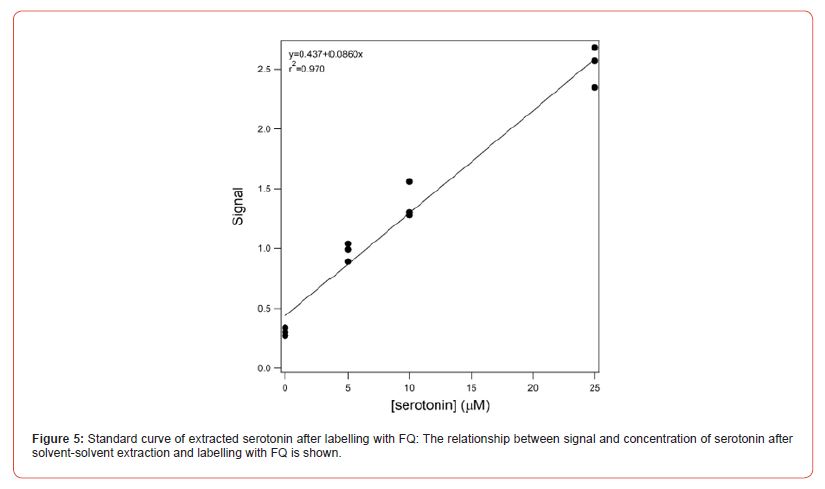
The signal obtained for the standards when the extraction process was performed (Figure 4) were substantially lower than those when no extraction was used (Figure 2). Keeping in mind that the samples whose electropherograms are shown in Figure 4 were diluted by half prior to injection, there was a loss of more than half of the signal due to the extraction. This is likely due to incomplete extraction. Figure 5 shows the relationship between fluorescence signal and serotonin concentration in the standards that were subjected to extraction.
Despite the incomplete extraction, the method was capable of detecting serotonin in the C. elegans samples. In the control worm pellet the concentration of serotonin was determined to be 26 mM and in the worms treated with psilocybin it was 41 mM. Based on visual inspection, the sample grown in the presence of psilocybin appeared to have a higher density than that grown in its absence. In order to adjust for this, the serotonin concentrations were divided by the protein concentration in the samples. Protein concentrationwas determined using the Bradford assay against standards of BSA, made in duplicate, ranging in concentrations from 0.2 to 1.0 mgml- 1 (r2=0.996). When corrected to the protein concentrations the control worm sample contained 0.9 mg serotonin per mg protein and the treated worm sample contained 0.5 mg per mg of protein.
Future work: The objective of this study was to develop a method for the analysis of serotonin in C. elegans. This was performed on C. elegans cultured in the presence and absence of psilocybin. The future objectives are to determine the effect of micro-dosing of C. elegans with various hallucinogens, at different concentrations, to assess the effect on serotonin levels.
Summary
Micro-dosing is the regular consumption of small amounts of psychedelic drugs as a means to provide psychological benefits by increasing serotonin levels. The objective of this study was to develop a method for the analysis of serotonin in C. elegans, which has been used as a model of the human central nervous system. C. elegans which had been cultured in the presence of psilocybin was compared to a control culture. FQ is a fluorogenic reagent which reacts with primary amines in the presence of cyanide. Labelling of the C. elegans samples without prior sample preparation was not fruitful as it produced a forest of saturating and overlapping peaks in the resultant electropherogram due to the presence of many different amine containing compounds. Rather, serotonin was extracted into n-heptanol under basic conditions and then back-extracted into acetic acid prior to labelling. Under these conditions serotonin was detected at a concentration of 5 mM. This sensitivity was sufficient to detect serotonin in the C. elegans. The extraction process was of moderate efficiency in that the majority of the serotonin appears to have not been extracted from the sample. In the absence of extraction, serotonin was detected at 1 mM. Serotonin was determined to be present at 0.9 mg/mg protein in the control sample and at 0.5 mg/mg protein in the psilocybin treated sample. This is not consistent with psilocybin-treatment resulting in an increase in serotonin as is suggested by proponents of micro-dosing. Future studies will analyze larger sample sizes of C. elegans as well as the effect of different hallucinogens at varying concentrations.
Acknowledgements
This study was supported by a grant from the Natural Sciences and Engineering Research Council (Canada).
References
- JM Rootman, P Kryskow, K Harvey, P Stamets, E Santos-Brault, et al. (2021) Adults who microdose psychedelics report health related motivations and lower levels of anxiety and depression compared to non-microdosers. Scientific Reports 11(1): 22479.
- LS Kaertner, MB Steinborn, H Kettner, MJ Spriggs, L Roseman, et al. (2021) Positive expectations predict improved mental-health outcomes linked to psychedelic microdosing. Scientific Reports 11(1): 1941.
- NRPW Hutten, NL Mason, PC Dolder, KPC Kuypers (2019) Self-rated effectiveness of microdosing with psychedelics for mental and physical health problems among microdosers. Front. Psychiatry 10: 672.
- MK Madsen, PM Fisher, D Burmester, A Dyssegaard, DS Stenbaek, et al. (2019) Psychedelic effects of psilocybin correlate with serotonin 2A receptor occupancy and plasma psilocin levels. Neuropsychopharmacology 44(7): 1328-1334.
- M Markaki, N Tavernarakis (2020) Caenorhabditis elegans as a model system for human diseases. Current Opinion in Biotechnology 63: 118-125.
- DB Craig, EA Arriaga, P Banks, Y Zhang, A Renborg, et al. (1995) Fluorescence-based assay by capillary electrophoresis laser-induced fluorescence detection for the determination of a few -galactosidase molecules. Anal. Biochem 226(1): 147-153.
- AK Corsi, B Wightman, M Chalfie (2015) A Transparent window into biology: A primer on Caenorhabditis elegans, WormBook, ed. The C. elegans Research Community, WormBook.
- SC Beale, Y-Z Hsieh, D Wiesler, M Novotny (1990) Application of 3-(2-furoyl)quinoline-2-carbaldehyde as a fluorogenic reagent for the analysis of primary amines by liquid chromatography with laser-induced fluorescence detection. J. Chromatogr A 499: 579-587.
- X Liu, L-X Yong, Y-T Yu (2003) Determination of biogenic amines by 3-(2-furoyl)quinoline-2-carboxaldehyde and capillary electrophoresis with laser-induced fluorescence detection. J. Chromatogr. A 998: 213-219.
- DM Pinto, EA Arriaga, D Craig, J Angelova, N Sharma, et al. (1997) Picomolar Assay of Native Proteins by Capillary Electrophoresis Precolumn Labeling, Submicellar Separation, and Laser-Induced Fluorescence Detection. Anal. Chem 69(1): 3015-3021.
- S Terabe, K Otsuka, K Ichikawa, A Tsuchiya, T Ando (1984) Electrokinetic separations with micellar solutions and open-tubal capillaries. Anal Chem 56: 111-113.
- GP Jackman, VJ Carson, A Bobik, H Skews (1980) Simple and sensitive procedure for the assay of serotonin and chatecholamines in brain by high-performance liquid chromatography using fluorescence detection. J. Chromatogr. 182: 277-284.
-
Douglas B Craig*, Rubeena Gosal, Victoria Steele, Sarah Thomson and Paul Holloway. Analysis of Serotonin in Caenorhabditis Elegans Subjected to Micro-Dosing with Psilocybin. Insi in Chem & Biochem. 3(3): 2025. ICBC. MS.ID.000562.
-
Caenorhabditis elegans; Capillary Electrophoresis; Micro-Dosing; Psilocybin; Serotonin
-

This work is licensed under a Creative Commons Attribution-NonCommercial 4.0 International License.


