 Research Article
Mitigation Of Red Chilli Supply Chain Risks in Bali, Indonesia
Ratna Komala Dewi1*, Nyoman Parining1 and Bambang Admadi Harsojuwono2
1Agribusniness Department, Agriculture Faculty, Udayana University, Badung, Bali, Indonesia
2Agroindustry Technology Department, Agriculture Technology Faculty, Udayana University, Badung, Bali, Indonesia
Ratna Komala Dewi, Agribusniness Department, Agriculture Faculty, Udayana University, Badung, Bali, Indonesia
Received Date:October 25, 2023; Published Date:November 17, 2023
Abstract
Red chilies (Capsicum annum) are perishable, seasonal, and come in all shapes and sizes. Throughout the supply chain, various treatments have been experienced, resulting in accelerated damage, both physiologically and mechanically, causing economic losses. The purpose of this study was to formulate identification, ranking, and risk mitigation plans for the red chillies supply chain at the red chili supply chain level in Bali Province. Supply Chain Operations Reference (SCOR) mapping is used to identify risk events and risk agents; risk ranking using the Failure Mode and Effect Analysis (FMEA) method; formulation of a risk mitigation plan in accordance with AS/NZS. Risk events and risk agents at every level of the supply chain are spread out in the plan, source, make, deliver, and return activities, except for retailers who are only identified in the plan, source, and make activities. The highest risk in the red chilli supply chain in the Intolerable category is at the farmer level, while the highest risk is for collecting traders, wholesalers, and retailers in the As Low As is Reasonably Practicable (ALARP) category. Supply chain actors are recommended to carry out periodic risk assessments and integrated risk mitigation planning according to the risk agent they are facing to minimize the impact of risk.
Keyword:red chilies; supply chain; risk mitigation; Bali Province
Introduction
One of the vegetables that have the potency to be developed in the province of Bali is red chilli. The demand for red chilli in Bali is relatively high because in addition to local people’s consumption it also meets the needs of hotels and restaurants [1]. On the other hand, red chilli (Capsicum annum) is perishable, seasonal, and has various shapes and sizes [2]. Red chilli farming in Bali Province in 2020 was carried out in eight districts. Bangli Regency and Karangasem Regency are centers of red chilli production in Bali Province. In 2020, chilli production in Bangli Regency was 4,883 tons (60.67% of the production of Bali Province), and in Karangasem Regency as much as 1,075 tons (13.36%) of production in Bali Province. Red chilli production in Bali Province fluctuates and tends to decline. Red chilli production in 2020 decreased by 21% compared to 2019 production (BPS Provinsi Bali, 2020). Most of the production factors are not efficient [3]. The effectiveness of the use of red chilli production factors is below 80%, so it is not effective in terms of farming [4]. According to Adnyasari [5] there are six red chilli trading systems in Karangasem Regency, Bali Province, and involve several institutions in each channel. According to [6] there are several differences in the activities carried out by trade administration institutions, so each channel has various operational efficiencies, ranging from 135.27 - 1,242.26%. This value indicates the complexity of the supply chain network, which indicates that there is a risk in the red chilli supply chain [7]. Risk is everywhere, can come at any time, and is difficult to avoid. If these risks happen to an organization, the organization can suffer significant losses [7]. In the red chilli supply chain, post-harvest actors in the red chilli supply chain need to carry out risk mitigation, namely the strategy taken to reduce farming losses Based on this risk mitigation development, the supply chain will run smoothly, supply chain actors will benefit, and consumers will be satisfied [8]. The purpose of this study is to formulate risk identification, risk ranking, and risk mitigation plans at each level of the red chili supply chain.
Research Method
Material
This research was conducted in Bali Province in 2021. The types of data used are quantitative data and qualitative data, which are obtained from primary data and secondary data. Data was collected through in-depth interviews and documentation studies. The tools used include structured questionnaires, writing instruments, and recording devices. The research population is all actors in the red chili supply chain in the province of Bali. The sample of supply chain actors is determined by the Snowball Sampling method.
Research Implementation
This research is a qualitative descriptive study to identify
risks, rank risks, and create risk mitigation plans. The stages of
research and analytical methods used at each stage follow [9]
as follows:
1. Identifying the risks that may occur is carried out in two
steps. The first step is to map the company’s supply chain
activities with the SCOR model which is assessed from the plan,
make, source, deliver, and return framework that has been
adjusted to the research limits. The second step is to conduct
in-depth interviews to identify risk events and risk agents [10].
2. Risk ranking is carried out in three steps, namely (1)
assessing risk using the FMEA method, taking into account
where there are three factors that are taken into account, namely
severity (S), occurrence (O), and detection (D) with a scale of
1-10; (2) ranking the weighting of the Risk Priority Number
(RPN) on a scale of 1-1000 obtained from the multiplication of
three factors, which is formulated as follows (RPN = Severity x
Occurrences x Detection); (3) mapping the risk level using the
FMEA risk level map [11].
Create a risk mitigation plan through the formulation of risk
mitigation as described by AS/NZS 4360 (2004) and Lestari et al.
(2018) as follows:
1. Mitigate risk, namely reducing the opportunities and
impacts of risks that occur.
2. Transfer risk, namely transferring and transferring risk to
other parties [12-15].
3. Avoid risk, namely avoiding the opportunities and
impacts of risks that occur; (4) Retail risk, which is accepting
the existing risks because the opportunities and impacts are
not too disruptive to the company’s supply chain processes.
Observation Variable
Observational variables in this study are the activities of supply chain actors including plan, make, source, deliver, and return; risk event and risk agent for each activity of supply chain actors; severity (S) of risk events and occurrences (O) and detection (D) of risk agents for each supply chain actor; mitigate risk, transfer risk, and avoid risk for each supply chain actor [16-20].
Data Analysis
The data analysis method used in this study was in line with to
the research objectives, namely:
1. To identify possible risks, it is analyzed by (1) mapping
the company’s supply chain activities using the SCOR model
and (2) identifying risk events and risk agents.
2. To rank the risks, it is analyzed through (1) risk
assessment using the FMEA method; (2) risk priority number
(RPN) weighting ranking and (3) risk level mapping using
FMEA risk level map.
3. To make a risk mitigation plan, it is analyzed through the
formulation of risk mitigation as described by AS/NZS 4360
(2004).
Results And Discussion
Table 1:Risk events for red chili supply chain actors in Bali Province
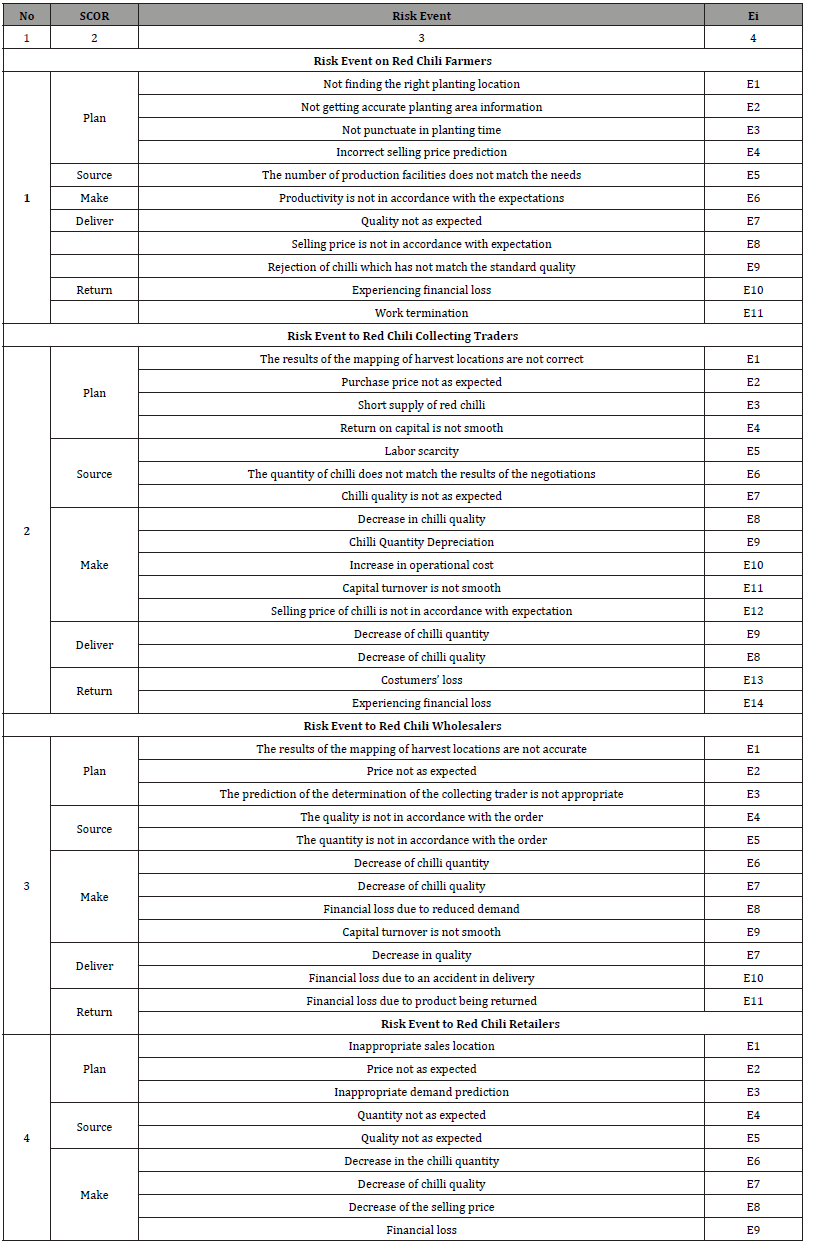
Table 2:Risk agent on red chili supply chain actors in Bali Province.
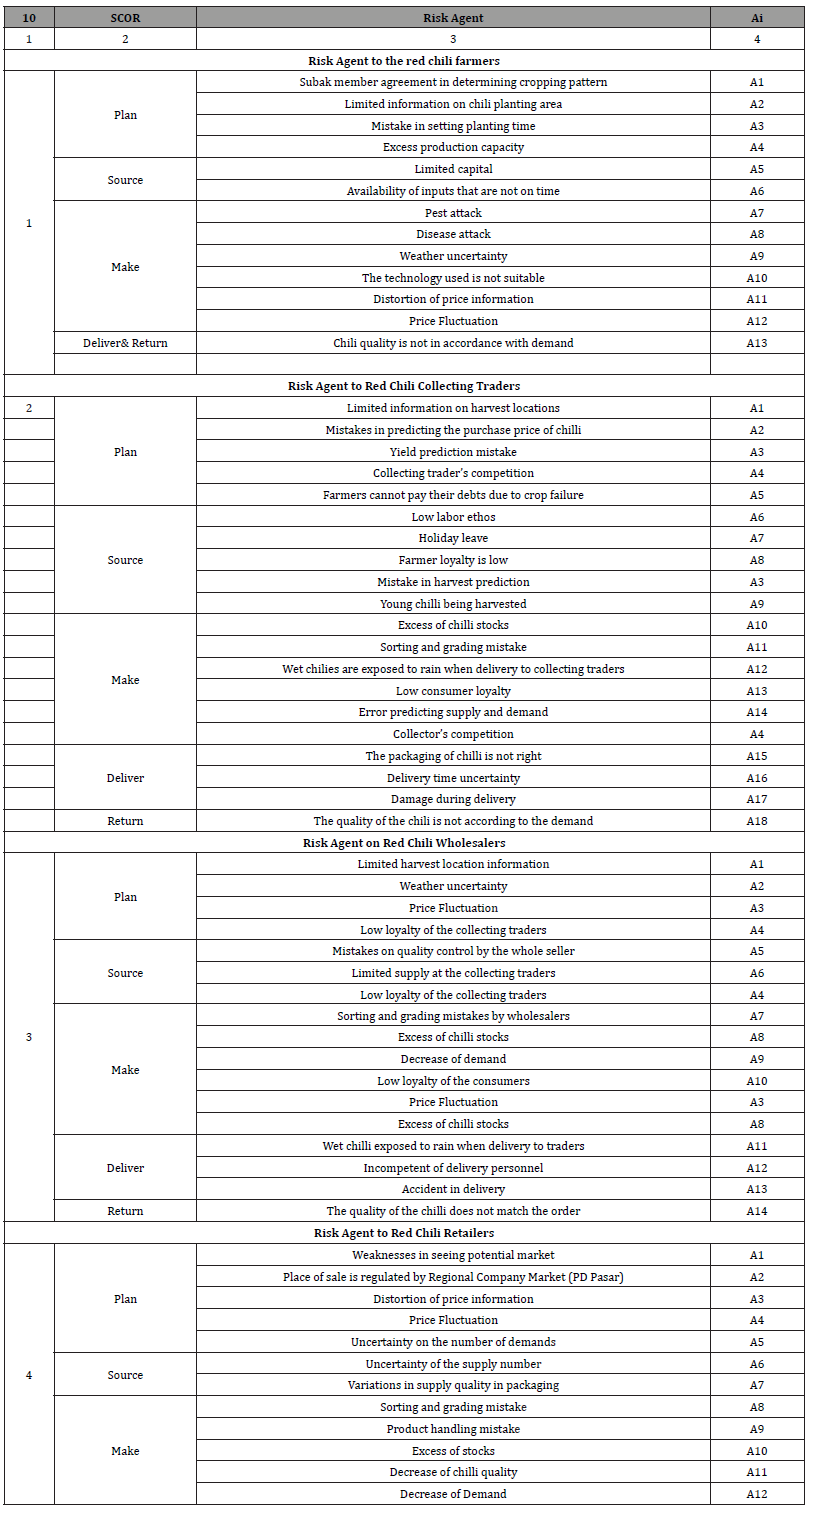
Identification of Risk Events and Risk Agents of Red Chilli Supply Chain in Bali Province Risk events have been identified and categorized in the SCOR model. The results of risk event identification for each supply chain actor can be seen in Table 1 below. Farmers, collectors, and red chilli wholesalers face risk events on plan, source, make, deliver, and return. Specifically, retailers do not face risk events or deliver and return. This is because the sales system at retailers does not accept returns of goods that have been purchased by consumers and consumers who come to retailers to buy red chilli, so there is no delivery of goods. The risk agents for each red chilli supply chain actor are identified and categorized in the SCOR model. Table 2 presents the risk agents for each actor in the red chilli supply chain in Bali Province. The types of risk agents due to risk events for red chilli supply chain actors are relatively diverse. The number of risk agents at retailers is the lowest [21- 23] which is 11 types compared to the other three actors. This is partly due to the fact that retailers do not have delivery and return activities. The risks inherent in each of its activities are related to the success or failure of a supply chain. The main cause of these various risk factors is due to imperfect coordination and lack of information sharing between nodes/levels in the agricultural product supply chain.
Risk ranking at each level of the red chilli supply chain.
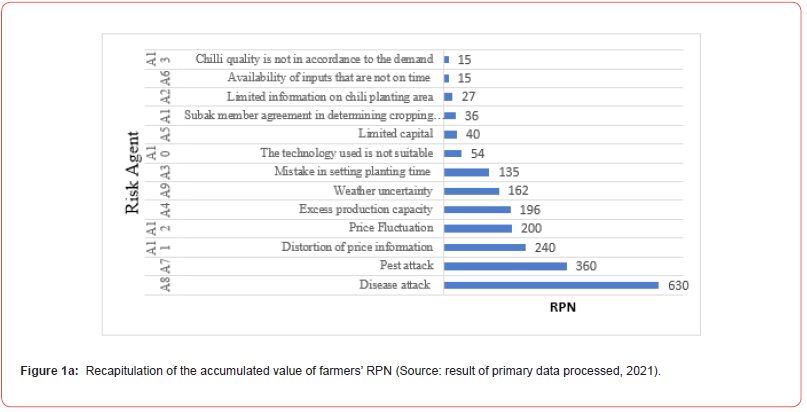
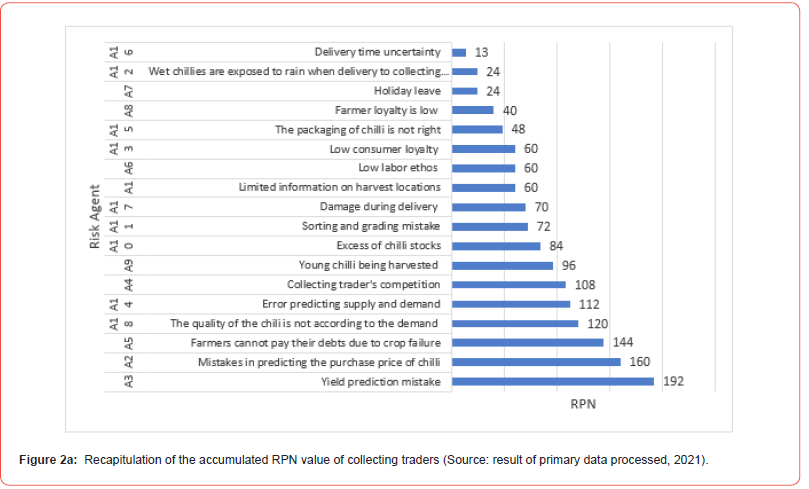
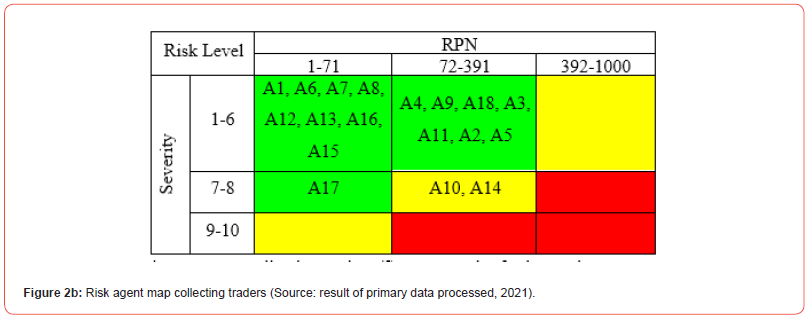
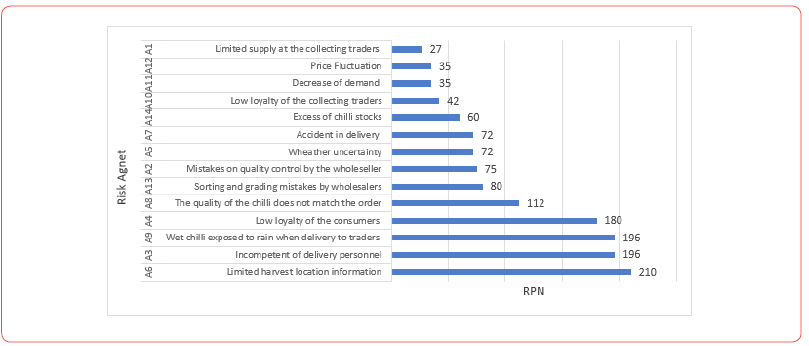
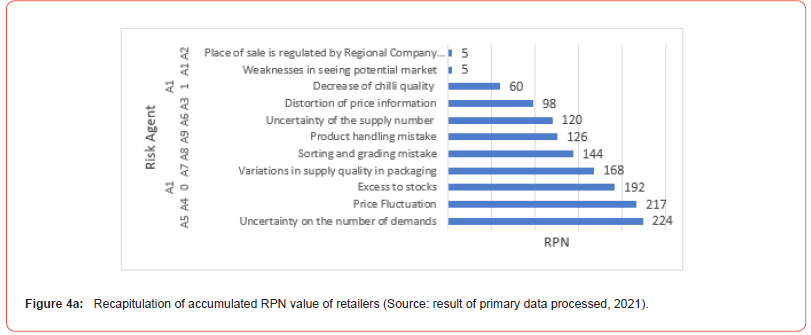
The ranking or risk assessment is shown based on the results of the recapitulation of the accumulated RPN values at each level of the red chilli supply chain in Figure 1a-4a. After obtaining the ranking as shown in Figure 1a-4a, then mapping is carried out based on the RPN value and severity value at each level of the supply chain. The risk agent map for each level of the red chili supply chain is shown in Figure 1b-4b.



Risk ranking for red chilli farmers.
The results of the risk assessment on red chilli farmers are shown in Figure 1a and the results of the evaluation of the risk agent are shown in Figure 1b. The highest risk agent for red chilli farmers is disease, followed by pest attacks, price distortions, price fluctuations, abundant production capacity, and weather uncertainty. This shows that the causes of the risk of conventional red chilli farming are disease, pests, and weather uncertainty. The influence of climate change affects the incidence of pests and diseases, host-pathogen interactions, so it becomes a major setback for vegetable cultivation. Pest and disease attacks and price variations are risks that require urgent intervention. Figure 1a In general, red chilli farmers are small farmers, with low status, production and business capital. This situation resulted in farmers being bound to sell their products of to the owner of the capital and receive the price determined by the owner of the capital. In addition, distortions and price fluctuations often occur. The sensitive farmers are weak in making decisions on the commodities they cultivate. The risk agent category for red chilli farmers can be seen in Figure 1b below. Based on the results of the evaluation of risk agents contained in the Farmer Risk Agent Map. that the risks faced by farmers are in three risk categories, namely the acceptable category, the category that requires action to handle or control risks which must be determined immediately, and the category that requires risk management or control measures, and category which requires immediate action. Risk agents in the acceptable category consist of six risk agents (46.15%), meanwhile 7.70% in the category that requires action to handle or control risks that must be determined immediately, and 46.15% risk agents are in the category that requires fast action [24-27].
Risk ranking of red chilli collecting traders.
The results of the risk assessment on the red chilli collectors are shown in Figure 2a and the results of the evaluation of the risk agent are shown in Figure 2b. The three highest risk agents for collecting traders are mistakes in predicting crop yields, followed by mistake in predicting the purchase price of chilies, and farmers are being unable to pay their debts due to crop failure. Next, we can observe the risk agent map on the red chilli collecting traders in Figure 2b. Based on the results of the risk agent evaluation contained in Figure 2b, that the risk agents faced by collecting traders are 88.89% are in the acceptable risk category and only 11.11% are in the category that requires risk management actions that must be determined immediately, namely the excess stock of chili and the error in predicting demand.
Risk ranking of red chilli wholesalers.
The results of the risk assessment on red chilli wholesalers are shown in Figure 3a and the results of the evaluation of the risk agent are shown in Figure 3b. The three highest risk agents for wholesalers are limited supplies at collecting traders, followed by price fluctuations, and a decline in demand due to the COVID-19 pandemic. Next, the Risk Agent Map for Red Chili Wholesalers can be seen in Figure 3b. Figure 3a Based on the results of the risk agent evaluation contained in Figure 3b, the risks faced by wholesalers fall into two risk categories, namely the acceptable category and the category requiring risk management actions that must be determined immediately [28-30]. Risk agents in the acceptable category consist of 10 risk agents (71.43%) and four risk agents (28.57%) in the category that requires risk management actions that must be determined immediately (Ray, 2021). Figure 3a. Recapitulation of the Accumulated RPN Value of Wholesalers (Source: result of primary data processed, 2021). Figure 3b
Risk ranking of red chilli retailers.
The results of the risk assessment on red chili retailers are shown in Figure 4a and the results of the evaluation of the risk agent are shown in Figure 4b. (figure 4a). The three highest risk agents for retailers are the uncertainty of the amount of demand, followed by price fluctuations, and excess stock. Next, the Risk Agent Map for Red Chilli Retailers can be seen in Figure 4b. Based on the results of the evaluation of risk agents contained in Figure 4b, that the risk agents faced by retailers are in two risk categories, namely seven risk agents in the acceptable category and four risk agents in the category that requires risk management actions that must be determined immediately. Based on the four risk agent maps, supply chain actors can find out the risk categories they face. Therefore, supply chain actors at every level need to carry out risk assessments on a regular basis in order to be able to mitigate risks early to reduce losses (Chowdhury & Quaddus, 2015). In Figure 1a- 4a it can be observed that the highest RPN value at each level, the highest is found in farmers, which is 630 and the lowest is found in collecting traders, which is 179. This shows that farmers face the greatest risk and collecting traders who face the lowest risk in red chilli supply chain in Bali Province. The highest risk in the red chilli supply chain in Bali Province based on the RPN value is included in the Intolerable category at the farmer level. This is supported by that the level of risk of red chilli production at the farmer level is relatively high as indicated by the coefficient of variation of 4.3. Therefore, farmers need to carry out mitigation planning and implement it. also argues that farmers need to carry out preventive strategies, namely carrying out routine and planned maintenance from seeding to harvesting. The results of this study are also supported by the results of the research from there are still red chilli distribution channels that are not efficient when viewed from the value of the share of producers or the level of profit of red chilli farmers, which is less than 70%. Partially there are red chili production factors that are not efficient, namely seeds and manure, as well as inefficient production factors, namely foliar fertilizers, calcium fertilizers, pesticides, and labor in addition in their study of the Cocoa supply chain in Kare Village showed that supply chain performance conditions were not optimal.
The highest risk at the level of collecting traders, wholesalers, and retailers is in the As Low As is Reasonably Practicable (ALARP) category. Risks in the Intolerable and ALARP categories still need risk mitigation planning. This is intended to minimize the impact of the risk that will be faced and the probability of the emergence of the cause of the risk, so as to minimize losses. In the risk agent map (Figure 1b-4b), only risk agents for farmers consist of three risk categories, namely categories that are acceptable, categories that require action to handle or control risks that must be determined immediately, and categories that require quick action. The risk agent for farmers in the category that requires risk control measures that must be determined immediately is 46.15%. This value is relatively high, but farmers in the province of Bali continue to do red chilli farming in every planting season, both rainy and dry seasons. This attitude of farmers is supported by the results of research by that most farmers in Sumberharjo Village, Prambanan District have the attitude of wanting to continue red chili farming.
Risk Mitigation Planning for Red Chili Supply Chain Actors
Mitigation planning is carried out after knowing the results of the FMEA risk level map. Risk mitigation planning in this study was carried out in accordance with AS/NZS 4360 (2004), namely mitigate risk, transfer risk, avoid risk, and retain risk. However, treatment with retain risk is not used because it is risk-accepting. The risk agent given by the mitigation plan is a risk agent that is in the ALARP and Intolerable categories because it is considered to disrupt the red chili supply chain flow. Risk mitigation planning for red chili supply chain actors in Bali Province is presented in Table 3.
Table 3:Risk mitigation planning for red chili supply chain actors in Bali Province.
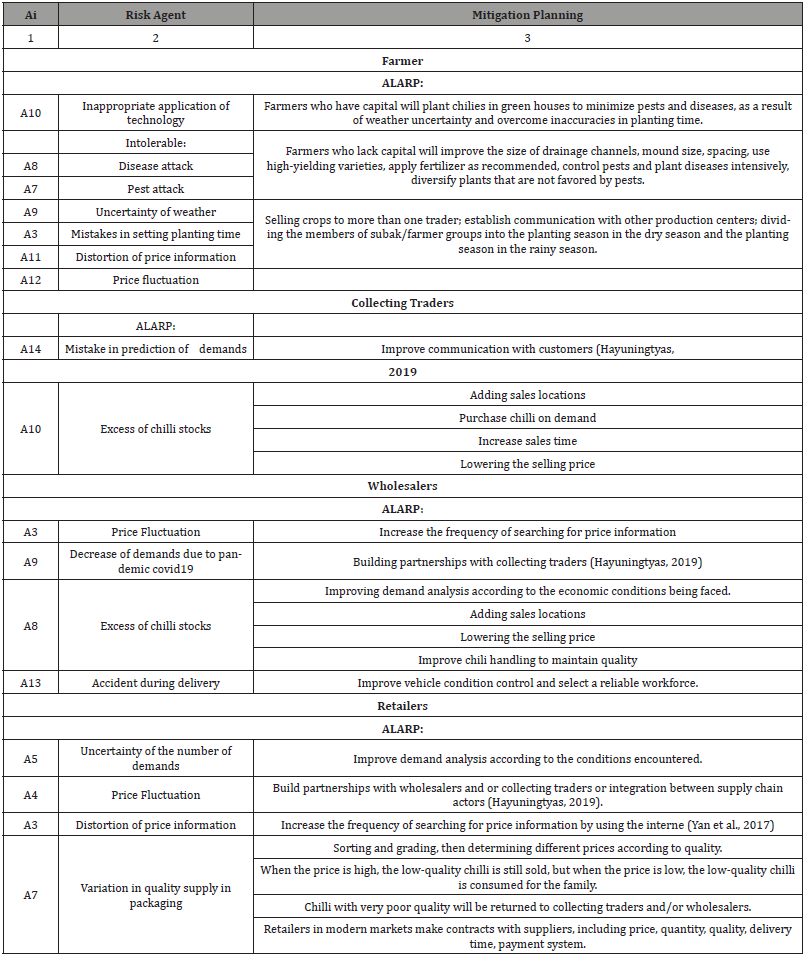
The results show that the risk mitigation planning for each red chilli supply chain actor varies, so it is necessary to carry out an integrated risk mitigation plan according to the risk agent. Integrated risk mitigation planning as a mitigation strategy to improve the ability of the red chilli supply chain. This also in line with proposes a single approach is not sufficient to provide solutions in all types of risk scenarios, whereas, a combination of approaches is most effective, particularly in the supply chain of perishable agricultural products, price and demand uncertainty. Through the implementation of integrated supply chain management, it is hoped that consumers will get better product quality, better service, and lower price; retailers will get increased sales volume, faster and better process of procurement goods and selling them, stable prices, better profits; traders will get more controlled inventory, better product quality, and increased profits; and farmers as producers will get higher productivity and selling prices, so their incomes increase [31].
Conclusion
Based on the results of the analysis and discussion, in the red chilli supply chain, 11 risk events and 13 risk agents have been identified at the farmer level, 14 risk events and 18 risk agents at the level of collecting traders, 11 risk events and 14 risk agents at the whole seller level, and nine risk agents, and 12 risk agents at retailer level. The highest risk in the Intolerable category is at the farmer level, while the highest risk in the other three supply chain actors is in the ALARP category. The risk mitigation planning for each red chilli supply chain actor varies, so it is necessary to carry out an integrated risk mitigation planning according to the risk agent.
Acknowledgment
Our appreciation goes to the Rector of Udayana University through the LPPM of Udayana University who has assisted in the research funding as well as PPL, Subak administrators, respondents, students, and various parties who have contributed to the implementation of the research and writing the journal manuscripts.
Author Contributions
RKD as well as the corresponding author plans, designs, carries out the research and creates the manuscript, NP carries out research, analyzes the data and reports, BAH analyzes the data, creates and translates the manuscript.
Conflict of Interest
The author declares that there is no potential conflict of interest in connection with the research, writing, and/or publication of this article.
References
- Adnyasari PS, Dewi RK, Susrusa KB (2017) Analysis of The Red Chili Trading System in Besakih Village, Rendang District, Karangasem Regency. J Agrib and Agri 6(4): 486-494.
- Andersen TJ (2008) The Performance Relationship of Effective Risk Management: Exploring the Firm-Specific Investment Rationale. Long Range Plan. 41(2): 155-176.
- Arifin M, Wartapa V (2021) Farmers' Attitudes about The Sustainability of Red Chili Farming in Sumberharjo Kapanewon Prambanan Village, Sleman Regency. J. I. Pert. Pol. 27(2): 66-75.
- AS/NZS 4360. (2004) Risk Management. 3rd Standards Australia/Standards New Zealand All. 11-29.
- Avinadav T, Chernonog T, Perlman Y (2015) The Effect of Risk Sensitivity on A Supply Chain of Mobile Applications Under A Consignment Contract with Revenue Sharing and Quality Investment. Int J Prod Econ 168: 31–40.
- Ayyogari K, Sidhya P, Pandit MK (2014) Impact of Climate Change on Vegetable Cultivation-A Review Int J Of Agri Env & Biotech 7(1): 145-155.
- Badan Pusat Statistik Provinsi Bali (2020) Statistik Hortikultura Provinsi Bali 2020, 39.
- Bjorkan M, Billing SL (2022) Commercial Seaweed Cultivation in Scotland and The Social Pillar of Sustainability: A Q-Method Approach to Characterizing Key Stakeholder Perspectives. Frontiers In Sust Food Sys, 6: 1-13.
- Chen J, Zhao X, Shen ZJM (2015) Risk Mitigation Benefit from Backup Suppliers in The Presence of The Horizontal Fairness Concern. Dec Sci 46(4): 663-696.
- Chowdhury MMH, Quaddus MA (2015) A Multiple Objective Optimization Based QFD Approach for Efficient Resilient Strategies to Mitigate Supply Chain Vulnerabilities. Omega 57: 5-21.
- Christopher M, Holweg M (2011) Supply Chain 2.0: Managing Supply Chains in The Era of Turbulence. Int J Physic Dis and Log Manag 41(1): 63-82.
- Dahlan R, Winarni S, Sunengsih S (2017) Multivariate Analysis of Factorial Variance on The Effect of Chili Type and Type of Packaging on Chili Characteristics. Pros Sem Stat MIPA UNPAD. (SNS VI), 475-483.
- Dewi RK, Parining N (2017) Risk Mitigation of Red Chili Production in The Village Besakih, Bali Province. J Eco and Sust Dev 8(4): 197-201.
- Ebile PA, Ndah HT, Wiinsche JN (2021) Agricultural Risk Assessment to Enhance the Food Systems of The Mbororo Minority Community in The Northwest Region of Cameroon. J Agri and Rural Dev in The Tropic and Sub Tropic 122(2): 207-217.
- Hanafi MM (2021) Risk Management. ANDI. Yogyakarta, pp. 8-9.
- Hariharan G, Suresh P, Nagarajan S (2018) Supply Chain Risk Mitigation Strategies and Its Performance of Smes. Int J Pure and App Math 119(15): 741-749.
- Hayuningtyas M, Marimin, Yuliasih I 2019) Performance Improvement, Risk Mitigation and Institutional Analysis in The Red Chili Supply Chain in Garut Regency. J Tek Ind Pert 30(1): 22-35.
- Le TD, Nguyen TV, Muoi NV (2022) Supply Chain Management of Mango (Mangifera Indica L.) Fruit: A Review with A Focus on Product Quality During Postharvest. Front In Sust Food Sys 5: 1-16.
- Lestari FP, Dewi RK, Suamba IK (2018) Supply Chain Risk Analysis at PT. Fisheries Nusantara (Persero) Benoa Bali. Branch SOCA 12(2): 2-187.
- Nooraie SV, Parast MM (2016) Mitigating Supply Chain Disruption throught The Assessment of Trade-Offs Among Risks, Costs and Investments in Capabilities. Int J Prod Eco 171(1): 8-21.
- Pujawan N, Mahendrawathi (2017) Supply Chain Management. ANDI, Yogyakarta, 269-294.
- Ray P, Jenamani M (2016) Sourcing Decision Under Disruption Risk with Supply and Demand Uncertainty: A Newsvendor Approach. Annals Operate Res 237(12): 237-262.
- Ray P (2021) Agricultural Supply Chain Risk Management Under Price and Demand Uncertainty. Int J Of Sys Dyn App 10(2): 17-45.
- Sangurjana IGWF, Widyantara IW, Dewi ZAL (2016) The Effectiveness and Efficiency of The Use of Production Factors for Large Chili Farming in Baturiti Village, Baturiti District Tabanan. E-J. Agri & Agro 5(1): 1-11.
- Saptana C, Muslim SH, Susilowati (2018) Chili Commodity Supply Chain Management in Dry Land Agroecosystems in East Java. Agri Pol Anal 16(1): 19-41.
- Septiana W, Marimin Y, Herdiani L, Haditjaroko (2016) Method and Approach Mapping for Agri-Food Supply Chain Risk Management: A Literature Review. Int J Supply Chain Manag 5(2): 51-64.
- Situmeang H (2011) Risk Analysis of Curly Red Chili Production in The Pondok Menteng Farmer Group, Citapen Village, Ciawi District, Bogor. Tesis. IPB, Bogor.
- Wang K, Yan V, Fu K (2020) Research on Risk Management of Agricultural Products Supply Chain based on Block Chain Technology. O J Buss and Manag 8: 2493-2503.
- Wijayanti, NWA, Dewi RK, Widyantara IW (2018) Analysis of The Efficiency of Using Red Chili Farming Production Factors in Besakih Village, Rendang District, Karangasem Regency. J Agribusiness and Agritourism 307-315.
- Xu J, Zhuang J, Liu Z (2016) Modeling and Mitigating the Effects of Supply Chain Disruption in A Defender–Attacker Game. Annals of Op Res 236(1): 255-270.
- Yan B, Wang X, Shi P (2017) Risk Assessment and Control of Agricultural Supply Chains Under Internet of Things. AGREKON. 56(1): 1-12.
-
Ratna Komala Dewi*, Nyoman Parining and Bambang Admadi Harsojuwono. Mitigation Of Red Chilli Supply Chain Risks in Bali, Indonesia. 4(4): 2023. GJNFS.MS.ID.000591.
-
Food safety, Liquid chromatography, Amino benzene boronic acid, Raman spectroscopy, Traditional food, Food safety testing, Black tea, Apple’s, Agricultural products, Environmental pollutants
-

This work is licensed under a Creative Commons Attribution-NonCommercial 4.0 International License.


