 Research Article
Numerical Validation of the Pedestrian Crossing Speed Calculator (PCSC) using Finite Element Simulations
B Rubrecht1, C Bastien1*, H Davies1, R Wellings2 and B Burnett2
1Institute for Future Transport and Cities, Coventry University, Priory Street, Coventry, UK
2University Hospital of Coventry and Warwickshire, Clifford Bridge Road, Coventry, UK
Christophe Bastien, Department of Future transport and cities, UK.
Received Date: June 21, 2019; Published Date: August 01, 2019
Abstract
In fatal pedestrian to vehicle collisions, accident investigators must attempt to reconstruct events that led up to the collision to determine liability in a court of law. In the absence of suitable video footage, the vehicle speed is calculated using particle-based throw distance calculators such as the Searle method. Until recently, no methods concentrated on the velocity of the crossing pedestrian, vital for determining responsibility. A new approach, the Pedestrian Crossing Speed Calculator (PCSC), which uses evidence left on the bonnet and windscreen along with pedestrian anthropometry to calculate a pedestrian crossing speed, has been proposed in a previous research, and validated against three real accidents where the pedestrian approach was orthogonal to the vehicle. The range of application of the PCSC theory is investigated in this paper. This study has considered 48 Finite Element simulations to further validate the PCSC against a saloon type and SUV vehicles. In the case of the saloon type, the PCSC theory for a pedestrian crossing approach angle <10°, i.e. a pedestrian crossing trajectory no longer perpendicular to the vehicle trajectory, has been fully vindicated. The study has also confirmed the PCSC hypothesis stating that for saloon vehicles the relationship between and increase in bonnet dent width was caused by an increase in pedestrian gait angle. The study also concluded that the PCSC theory was less conclusive in the case of SUV collisions. This paper confirms that PCSC is unique and can have an important role in the field of accident reconstruction and for law enforcement; with the potential to determine vehicle speeds from a known pedestrian crossing speed, which will allow the calculation of the vehicle velocity in the absence of physical evidence left on the road surface.
Nomenclature
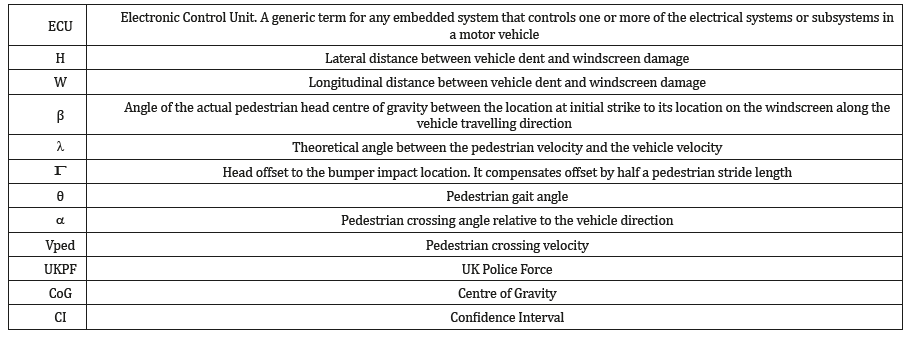
Introduction
Pedestrian collisions are often tragic and sometimes even fatal events that happen all around the world. These events are caused by the pedestrian, careless driving or a combination of the two. The Police authorities are then responsible for gathering all the evidence leading to the fatal collision. Evidence can be found in multiple ways, like video footage (either CCTV or dashcam), data from the vehicle ECU, or if necessary, witness statements and physical evidence left on the road, such as skid marks. Pedestrian throw distance calculators such as Searle’s method can then be used with physical evidence to estimate the velocity corridor the vehicle was expected to be travelling in, although using this method, the crossing speed of the pedestrian cannot be ascertained. The Pedestrian Crossing Speed Calculator (PCSC) [1] is a new particle-based method of accident reconstruction that uses physical evidence left on the front end of the vehicle to calculate the crossing speed of the pedestrian. Not only this, but if the pedestrian crossing speed is known, then it can be applied in reverse to find the velocity of the vehicle.
When a pedestrian impacts a vehicle, the first point of contact is between the bumper and knee [2,3]. After initial contact, the pedestrian rotates about the bonnet leading edge and hits the windscreen, the impact of which is offset laterally and longitudinally from first contact [4]. This head contact location is heavily influenced by two factors; the front-end geometry of the vehicle and the height of the pedestrian. A bonnet with a lower height leading edge carries the pedestrian further onto the vehicle [5] and a tall pedestrian is 17% more likely to hit the windscreen [6]. (Figure 1) shows an example of the pedestrian kinematics with different front-end geometries, using Madymo a pedestrian multibody computer model [1]. The Searle method is currently used in UK court proceedings, which is a particle-based mathematical model which uses evidence markers such as skin marks and pedestrian throw distance to calculate a vehicle velocity [8]. It has been shown to compare well to a collection of accident data, predicting vehicle velocities close to the known values [9]. Several deficiencies exist with this method. A constant friction coefficient of 0.7 is used, which is not representative of a change in road condition, i.e. dry (0.73), wet (0.67), icy (0.30) [10]. Differences in velocities between the pedestrian and vehicle at the moment of impact also require the use of a projection efficiency, which is dependent on vehicle front end geometry.

The Pedestrian Crossing Speed Calculator (PCSC) is a new forensic investigation tool that can be used to calculate the crossing speed of a pedestrian. It assumes the pedestrian to be a particle and uses vector algebra to determine a directional vector post-impact.
The basic theory of the PCSC is based on the ratio between two angles [1]

Equation 1-Basic theory of PCSC.
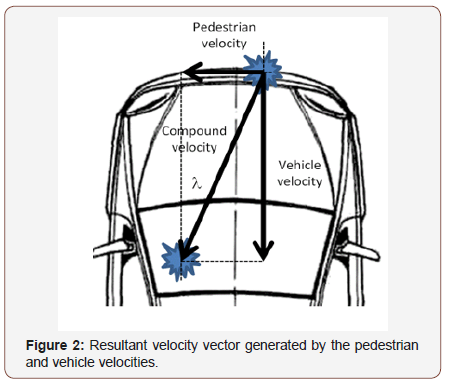
The first angle, λ, is the absolute angle of the pedestrian-vehicle velocity vector, which can be seen in (Figure 2). This vector is measured using two impact locations, the dent left on the leading edge of the bonnet by the pedestrian’s leg, and the dent left at the top of the bonnet or windscreen by the pedestrian’s head.

Equation 2 - Absolute angle of the pedestrian-vehicle compound velocity vector.
It is assumed in Equation 3 that the pedestrian is travelling on a path perpendicular to the vehicle’s direction of travel. This may not always be the case and so a non-zero approach angle between the pedestrian and vehicle can be observed. This change of angle is included in Equation 2, where α is the approach angle of the pedestrian. It should be noted that Equation 2 reverts to Equation 1 when the approach angle α is zero. The correction value is added to the vehicle velocity if the pedestrian is travelling towards from the car, and visa-versa.

Equation 3- Absolute angle of the pedestrian-vehicle compound velocity vector with pedestrian approach angle included.
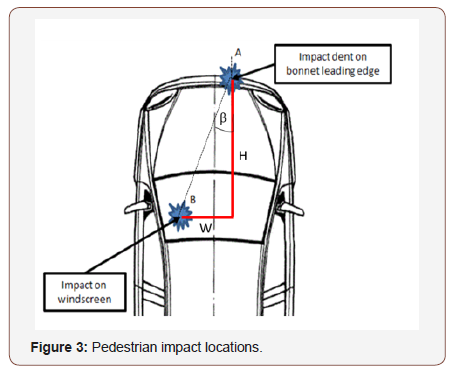
It should also be noted that there are multiple ratios of vehiclepedestrian velocities that can fulfil λ. The ratio of velocities however must be calculated from the impact evidence on the vehicle. The angle β is the head approach angle of the pedestrian between impacts of the leg on the bumper and head on the windscreen. Overly simplified, it is the angle between these two impact points. The lateral distance between these points is W, and the longitudinal distance between them is H. This can be observed in (Figure 3).
The angle β is therefore a function of W and H, however the pedestrian’s head may be offset from the leg impact location. This is captured in the term Γ_generic, and as such β can be calculated as per Equation 3.

Equation 3 - Head approach angle of the pedestrian between bumper and windscreen impact points.
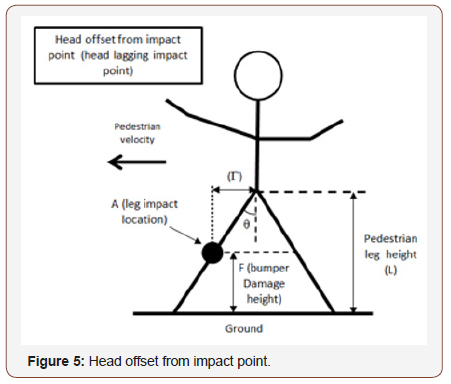
The head position relative to the leg impact location will be determined by anthropometric factors such as leg length, and the condition of the pedestrian pre-impact. This condition is based on the hip gait angle of the pedestrian, θ. The distance between the bonnet impact location and the pedestrian’s head will be larger than for a wider pedestrian stance, and near zero for a standing stance. (Table 1) summarizes the maximum hip gait angles for a given stance. It must be noted that this does not divulge the crossing speed. For example, a pedestrian crossing at running speed can have a running gait, as well as a standing or walking gait depending where in their stride they are at impact.
Table 1: Pedestrian conditions for different crossing types [1].

If the pedestrian’s head is forward of the bonnet impact point, the head approach angle β will be smaller than λ. If the pedestrian’s head is trailing the bonnet impact point, then β will be greater than λ. This is illustrated in (Figure 4). Equation 4 shows Γ_generic, which depends on the pedestrian condition pre-impact, i.e. width of pedestrian gait, anthropometrics etc.
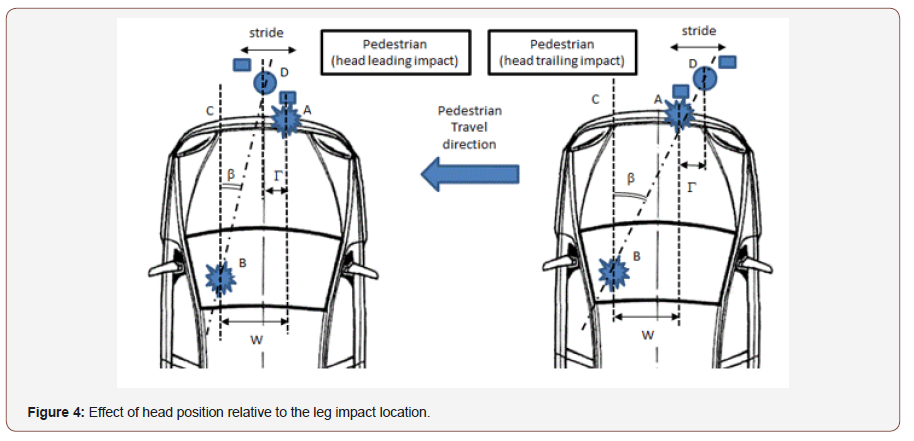

Equation 5 - Head offset from impact point
The distance Γ_generic is illustrated in Equation 5, where L is the pedestrian leg length, F is the height of bumper impact, θ is the pedestrian gait width and α is the approach angle of the pedestrian to the vehicle. These pedestrian measurements can be seen in (Figure 5).
Combining the full equations for λ and β produces Equation 6:
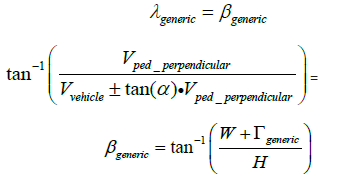
Equation 6 - Full PCSC equation
The PCSC has already been verified [1], using data from three real collisions to show the PCSC can predict velocities consistent with the findings of the UKPF. These collisions all occurred with an approach angle α, of 0° and has been highlighted by the authors as a limitation of this verification.
This paper will attempt to further validate the PCSC by running FE simulations using the THUMS4.01 human body model and assess the extent of usefulness on the PCSC theory. The Latest computer human body technologies involve finite element model (THUMS and GHBMC [13]). These models are designed to replicate the physical properties of the human body and are based on the results of many studies and CT scans [1]. It has been proven that THUMS can predict the dynamic impact and response compared to a PMHS to within ±15% [14,15]. THUMS has also been validated for post impact kinematics, producing results consistent with the Searle method at speeds up-to 40km/h [15].
The study will investigate changes in pedestrian crossing speed, pedestrian approach angle, pedestrian gait angle and different vehicles class (standard saloon and SUV), with the purpose of testing the validity of PCSC by creating more accident samples, albeit numerical. The hypothesis that an increase in dent width leads to an increase in pedestrian gait angle will also be questioned, as this is important for forensic investigators in a real-world collision.
Methodology
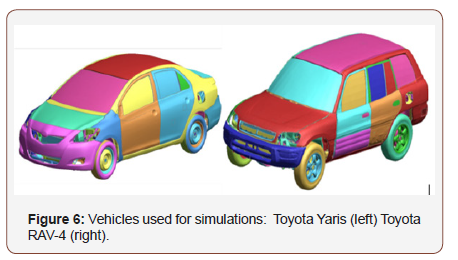
In order to test the PCSC theory, pedestrian-vehicle collisions were simulated using the THUMS model and a Toyota Yaris (saloon) and RAV-4 (SUV), as illustrated in (Figure 6). The ultimate aim was to compare the computer model pedestrian response against the PCSC theoretical predictions.
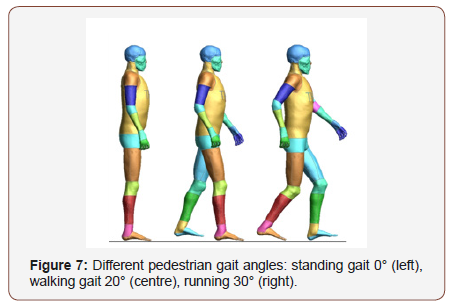
Pedestrian crossing speeds of 0.0, 1.4 and 3.0m/s were arbitrary used, representing standing, walking and running respectively whilst covering a wide range of crossing speeds. Three pedestrian gaits were also considered, with the THUMS model posture being modified to 0°, 20° and 30° representing a standing, walking and running gait respectively. The positioning of the pedestrians is shown in (Figure 7). It should be noted that for the running gait pedestrian the struck leg is forward of the head center of gravity, unlike the standing and walking gaits. This was done to test the PCSC in both scenarios and was observed that the pedestrian will fall on their side/front with a standing/walking gait and on their side/back with a running gait.
For a standing gait, the pedestrian can be crossing at standing, walking or running speeds. Yet for a running gait the pedestrian can only be crossing at running speed. The possible crossing speeds to pedestrian gait permutations are shown in (Table 2). Each of these permutations was also run for an approach angle α of 0°, 10°, 20° and 30°.
Table 2: Possible pedestrian crossing speeds depending on gait.

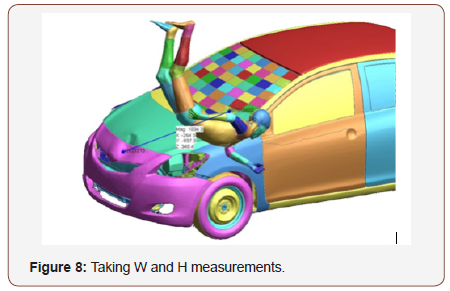
A total of 48 simulations, 24 simulations for each vehicle-12 standing, 8 walking and 4 running were computed. These simulations were set to an end time of 0.3s, which was an adequate time to capture pedestrian head to windscreen contact. For each simulation, the variables W and H were measured on the vehicle, using D3PLOT [16] as a post-processor interface. An example measurement is illustrated in (Figure 8). The distance between the center of the dents is taken, and then the appropriate X and Y measurements recorded, as per the PCSC equation requirements.
The leg length of the THUMS AM50 human model is measured to be 867mm (from hip joint to foot). The bumper damage height is generally consistent to each vehicle for every simulation. This is because the directional vector begins at the point of rotation. As the plastic bumper is relatively soft, it deforms under the impact from the pedestrian. This does not cause the pedestrian to begin rotating towards the bonnet. The stiffer metal bumper beam is the component that changes the pedestrian’s directional vector, with the contact height for this being consistent across the simulations. For the Toyota Yaris, this was 517mm, and for the Toyota RAV-4 it was 687mm from the ground. The height at which the point of rotation occurred was checked in every simulation and most of the simulations were the same heights, with a variance of ±30mm.
Dent Width Investigation
During a collision, a pedestrian could rotate after the initial contact with the vehicle. This rotation can be influenced by the offset between the pedestrian’s center of gravity situated in the navel area and the area of the leg contacting the vehicle. When the approach angle is zero and the pedestrian has a small gait, for saloon vehicles, a narrow dent will be observed on the bonnet; this was proposed as an important assumption for the PCSC equation derivation. This is because no rotation of the pedestrian will occur, so they fall onto their side. As the hip gait angle increases, the offset between the leg contact and head Cog also increases which will rotate the pedestrian onto their front or back. It has therefore been hypothesized that an increased pedestrian gait will create a wider dent in the bonnet, as illustrated in (Figure 9).

Using the simulations, the width of the bonnet dent left by the pedestrian is measured. In a real-world accident, the evidence is not limited to just the bonnet damage. It is possible that during a collision with a low enough velocity, the elastic limit of the bonnet may not be overcome, and no dent is left. The spring back of the bonnet must also be considered, which would make the measured dent created by the pedestrian contact narrower. However, smear marks left on the bonnet, such as dirt, may be used to suggest the width of the pedestrian in contact with the bonnet. Therefore, it is more suitable to measure the contact width of the pedestrian.
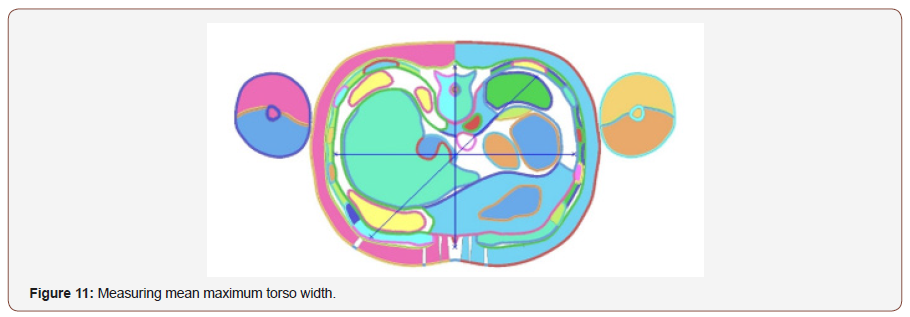
The simulation animation is stopped when the pedestrian is in full contact with the bonnet. A parallel cut section to the bonnet is then made and translated in the local z-direction until a profile representative of the bonnet dent width is observed in the postprocessor. The width of the torso is then measured in line with the deepest deformation of the dent, as seen in (Figure 10). To relate these measurements to the rotation of the pedestrian, the measured torso contact is divided by the mean maximum torso width of THUMS at rest. This measurement can be seen in (Figure 11), and for a real-world case can be measured by a post-mortem. The THUMS model gives an average torso with of 303mm. This gives a ‘torso ratio’, which returns a value of ‘1’ when the pedestrian has landed square on their front or back. Values over ‘1’ can be obtained, as the thorax can compress during impact, increasing the contact seen on the bonnet.

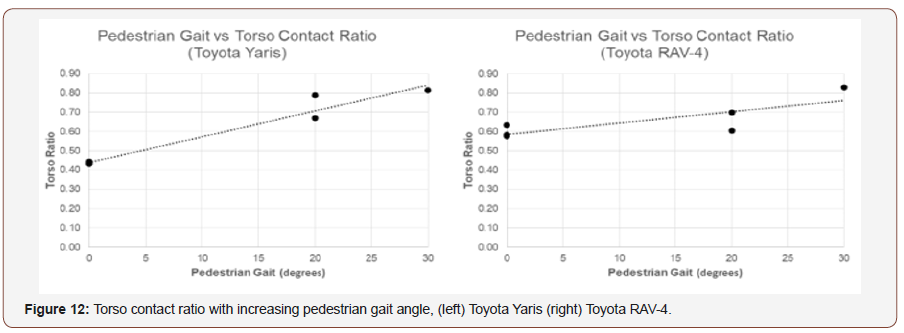
All dent width measurements can be found in tabulated form in Appendix A. (Figure 12) shows the measurement results for the Toyota Yaris and RAV-4 respectively when the approach angle α is 0. It can be observed that the hypothesis holds true for the Toyota Yaris, where an increase in pedestrian gait angle produces a visible increase in torso ratio. However, the same conclusion cannot be drawn for the Toyota RAV-4, as the torso ratios only slightly increase with a change in approach angle. This would lead to inconclusive evidence being collected at the scene of the accident and could not provide objective information on the pedestrian gait angle at impact.
It is also important to evaluate if this hypothesis works when the pedestrian-vehicle approach angle is not orthogonal, or a nonzero angle. As discussed in section 3, simulations between 0-30° were run and the measurements were also collected from these simulations. (Figure 13) shows the results of these measurements, plotted as approach angle against torso ratio, with different markers used to distinguish different pedestrian approach angles.
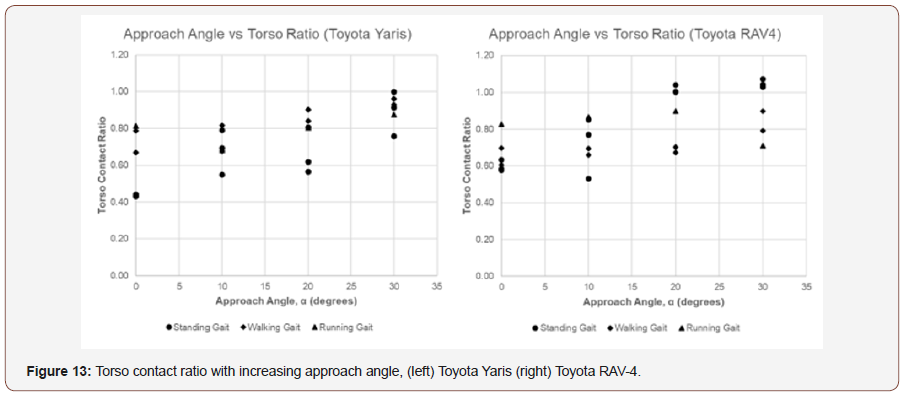
Torso contact ratio with increasing approach angle, (left) Toyota Yaris (right) Toyota RAV-4. The results of the Toyota Yaris show that for an approach angle above 0°, the pedestrian gait width cannot be distinguished from the dent width alone. If this were to be possible, the measured dent widths would need to be sequential, starting with the smallest gait (standing) producing the smallest dent, and the largest gait (running) producing the largest dent. This does not occur for approach angles above 0°. The Toyota RAV-4 could not provide distinguishable contact ratios at 0°, and the trend continues into higher approach angles. It can therefore be concluded that the dent width cannot be used to distinguish the pedestrian gait angle for an SUV.
Comparison between theoretical and numerical PCSC predictions
All graphs contain a ‘true’ gradient line, where the predicted pedestrian velocity is equal to the known pedestrian velocity from the simulation, as per the PCSC Equation 5. Upper and lower bounds are 95th percentile confidence intervals (CI) of the data sets. It can be observed that some samples have fewer dataset points, consequently the CI is smaller, nevertheless it can be observed that the datasets generated are close enough to land within the 95th percent confident interval, hence voiding the need for further computation. For each pedestrian velocity, the standard deviation is calculated, and the upper and lower bounds are evaluated as per Equation 6 [17]. The results of simulations for the Toyota Yaris with an approach angle of 0° are illustrated in (Figure 14), and the same for the Toyota RAV-4 in (Figure 15). Tabulated results of all simulations are provided in Appendix B.

Equation 6 - Calculating confidence intervals [17]
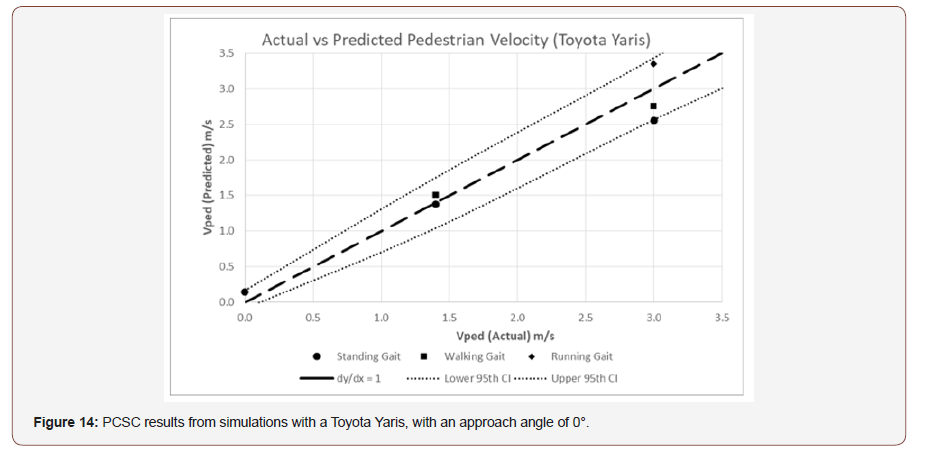
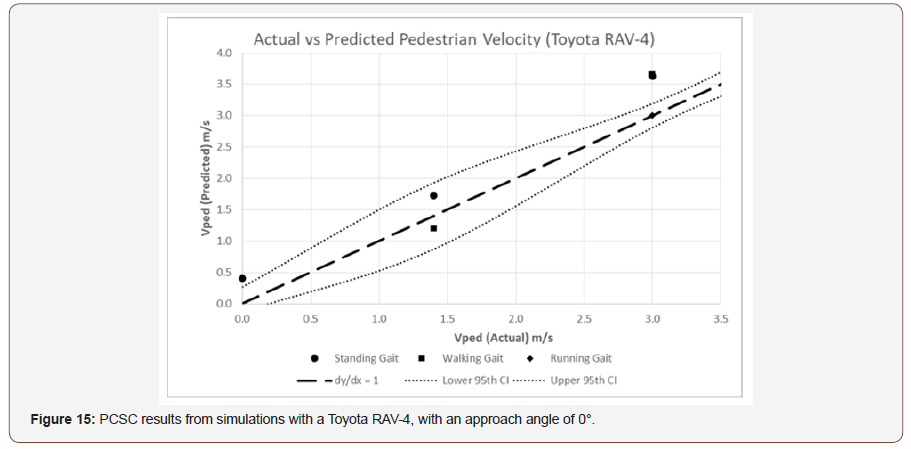
The results for the Toyota Yaris show that the PCSC can accurately return a pedestrian crossing velocity within a 95% confidence interval for α= 0°. The results of the Toyota RAV-4 are less conclusive, tending to overestimate the crossing velocity of the pedestrian. The reasons for this will be discussed later. However, the RAV-4 for a running gait at running speed the calculator returned a value of 3.0m/s, identical to the known pedestrian crossing velocity (Figure 16) and (Figure 17).
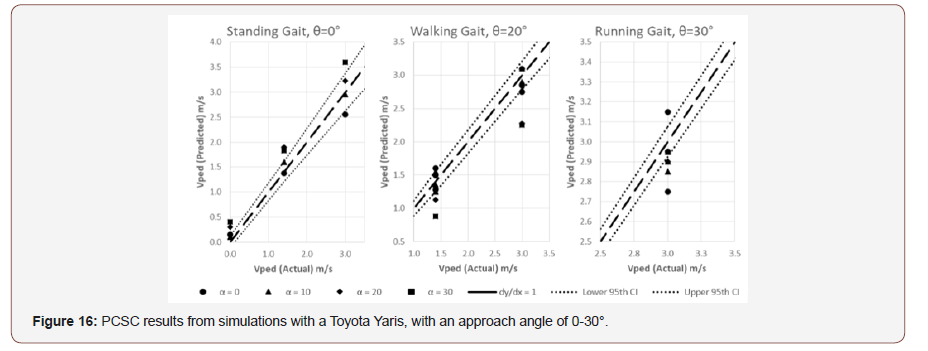
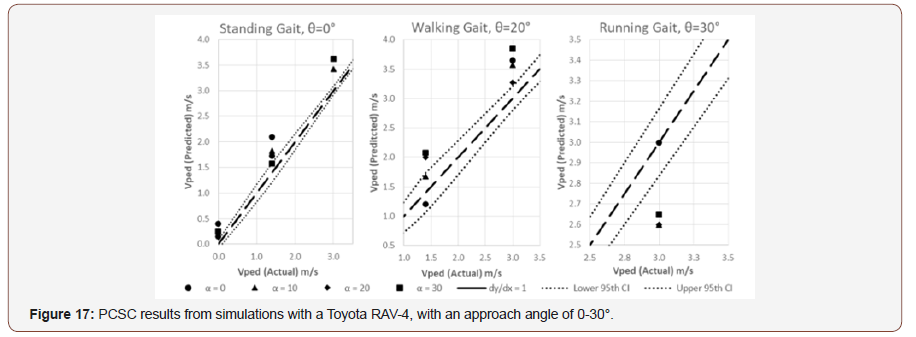
For a change in approach angle with the Toyota Yaris, for both the standing and walking gaits above 10°, the predicted velocity falls outside of the confidence intervals. For the running gait, the confidence interval is very narrow, causing the results to also fall outside. However, this still gives a good indication of the general crossing speed of the pedestrian at the time of impact. The change in approach angle with the Toyota RAV-4 in (Figure 17) shows the results of an SUV type vehicle are not suitable for the PCSC. The standing and walking gaits overestimate the predicted velocity, and the results with a running gait are underestimated.
Discussion
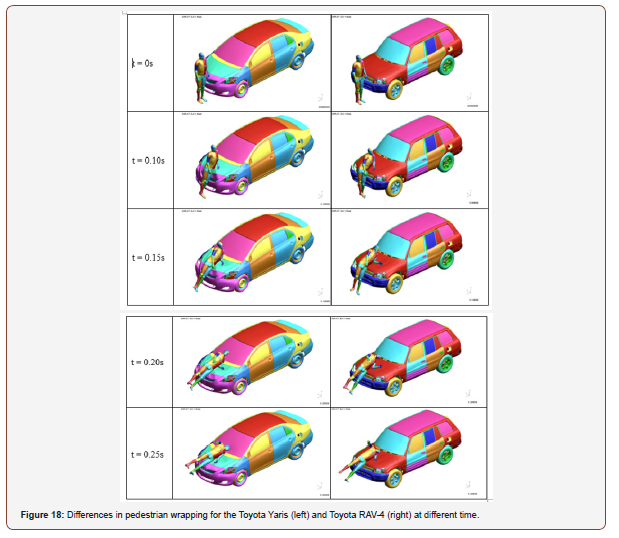
The PCSC was previously validated against three real world cases, where the vehicles had low leading bonnet edges and pedestrian approach angles of 0° [1]. The results of the simulations with the Toyota Yaris further validate the theory when α= 0-10°. However, when the same simulations are computed with a Toyota RAV-4 the results fall out of the 95th confidence interval bounds. In these scenarios, the standing gaits and walking gaits are overestimated, and the results of the running gait are underestimated. This would suggest a consistent factor is causing miscalculation. The obvious differentiator between the two vehicles is the difference in front end geometry, as the Toyota RAV-4 has a significantly flatter and higher front end than the Toyota Yaris. The increased height of the bonnet leading edge of the Toyota RAV-4 means that the pedestrian spends a greater amount of time attached to the front of the vehicle. This directly affects the two variables that produce the directional vector, W and H. A decrease in H causes the predicted velocity to rise. The increase in frontal wrap causes the pedestrian to fold over the bonnet leading edge, as opposed to being deflected over this edge with the Toyota Yaris. This is unavoidable and is due to the location of the pedestrian’s CoG relative to the height of the bonnet leading edge. This factor is then exaggerated by the reduced velocity of the H component caused by an increase in contact time on the front end of the vehicle. Combined, this causes a shorter H distance between the two dents, creating a more acute angle of the directional vector. This in turn returns a higher predicted pedestrian velocity. This is illustrated in (Figure 18), where stills of the simulation show the different pedestrian wraps.
For the Toyota RAV-4, the standing and walking gaits results are consistently above the true pedestrian velocity as per the reason above. However, this is reversed with the running gait results, where the pedestrian velocity is underestimated. This is hypothesized as being due to the position of the pedestrian’s leg relative to the CoG of their head. For the standing and running gaits, the struck leg is forward of the head, and the opposite is true for the running gaits. This causes the pedestrian to land on their front (leg forward of head CoG) or on their back (leg rearward of head CoG). The same wrapping phenomenon is observed with the pedestrian’s leg rearward of the CoG. For the standing/walking gaits, the wrap causes a shortening of H. For the running pedestrian, this also happens, but due to the algebra of the PCSC causes a decrease in predicted pedestrian velocity. Therefore, for all gaits there is potential for a correction factor to be utilized if the pedestrian collides with an SUV. Whether or not this ‘constant’ would be the same for all SUVs would require further simulations, with vehicles of different front-end geometries and bonnet leading edge heights. The THUM’s anthropometry would also need considering, as this will also affect the amount of ‘stick’ time on the front of the SUV. All these factors can then be combined to find the magnitude of the correction factor/s needed.
When the approach angle is ‘0’, the effect of the pedestrian gait on the dent width observed on the bonnet of the Toyota Yaris and further validates the PCSC base assumption that gait and dent are linked for crossing perpendicularly to the road. A smaller pedestrian gait produces a narrower dent, with dent size increasing with pedestrian gait angle. The increase between the walking and running dent width was small compared to the difference between the standing and walking gait. This could partly be attributed to the difference in gait angles between the three stances chosen, with a standing gait of 0°, a walking gait of 20° and a running gait of 30°. It is therefore unsurprising that the absolute difference between the walking and running gaits is small. When α = 0° with the Toyota RAV-4, the increase in dent width for a standing gait is likely due to increased rotation of the pedestrian during contact with the front end. The Toyota RAV-4 cannot validate the theory on increased gait width causing an increase in dent width. The increased dent widths at standing gait makes it difficult to distinguish the difference between standing and walking gaits.
In the Toyota RAV-4 case, when the approach angle increases, it becomes more difficult to distinguish an increase in dent width with an increase in pedestrian gait angle. For any approach angle above 0°, with a collision with the Toyota Yaris, the pedestrian gait angle cannot be determined from the dent width alone. For the Toyota RAV-4, it is further shown that the dent width cannot be estimated from any approach angle of the pedestrian. This can be again attributed to the extended time the pedestrian spends on the front of the vehicle. Yet, the difference in dent width for a pedestrian with a walking gait with an approach angle of 0-20° remains constant, only rising at 30°. The extended contact time does not seem to rotate the pedestrian with a walking gait until a more extreme approach angle is observed.
It must also be noted that the method of measuring these dent widths is not the most robust and can be greatly influenced by the computer user measuring these widths. Care was taken to make these measurements accurate and repeatable, however there is undoubtedly some variance in measurement. The position of the arm during the collision also seems to influence the pedestrian kinematics; it has been observed that the arm can change the vector of the pedestrian on impact, although it is unknown how much difference this makes to the impact location of the head. When measuring dent widths, the arm can be the body part that leads the human into the bonnet. This makes the dent relative to the arm and not the torso, which will make it difficult to measure reliably in a real collision incident if the gait width is being estimated from the dent width.
Conclusion
The range of application of the PCSC theory was evaluated and confirmed that the PCSC equations predicted accurately the pedestrian crossing velocity for low approach angles against a saloon vehicle. This PCSC validation was conducted using 24 computer simulations, which confirmed the crossing velocity within a 95% CI for approach angles less than 10°. At approach angles exceeding 10°, it is still possible to distinguish the approximate condition of the pedestrian before contact, i.e. whether they are walking or running, albeit the velocity magnitudes are less accurate.
The same process was also carried out on a Toyota RAV-4, however the pedestrian crossing speed predictions did not compare with the PCSC expectations. The results of the RAV-4 simulations suggest that an overestimation of predicted velocity occurs for standing and walking gait angles, with running gait angles being underestimated. Several reasons for this based on observations of the results and simulation animations have been suggested.
An investigation into the hypothesis that an increase in pedestrian gait angle leads to an increased dent width was carried out. It was found that for the Toyota Yaris, at α = 0° the dent, or dirt bonnet smearing, width could be used to estimate pedestrian gait angle, but beyond 0° this was not possible. For the Toyota RAV-4, at no approach angle can a dent width be used to conclusively validate the pedestrian gait angle at impact. If can be concluded that the range of application of the PCSC theory are now better understood and that in specific cases, this method could be a candidate as a forensic tool to compute the vehicle impact speed in hit-and-run cases.
Recommendations for Further Work
A larger study on how the PCSC reacts to vehicle with a high leading bonnet edge, such as SUVs should be carried out. If enough data is gathered, a correction factor can be suggested for SUVs which is hypothesized will allow the PCSC to return a predicted velocity closer to the true value, and within an acceptable bound.
Acknowledgement
The authors would like to thank the Road Safety Trust [17] for their support in this research. This work was completed as part of project Road Safety Trust (RST 65 _3_2017) “Reducing Road Traffic Casualties through Improved Forensic Techniques and Vehicle Design (RoaD)”. The authors would also like to thank the UK Coroner and the UK Police forces for their support and expertise on pedestrian accident reconstruction and traumatology.
Conflict of Interest
No conflict of interest.
References
- Bastien C, Wellings R, Burnett B (2018) An Evidence Based Method to Calculate Pedestrian Crossing Speeds in Vehicle Collisions (PCSC) Accident Analysis and Prevention.
- Kerrigan JR, Murphy DB, Drinkwater DC, Kam CY, Bose D, et al. (2007) Kinematic Corridors for PMHS Tested in Full-Scale Pedestrian Impact Tests. Proceedings of the 19th International Technical Conference on the Enhanced Safety of Vehicles Washington DC, USA.
- Masson C, Serre T, Cesari D (2007) Pedestrian Vehicle Accident: Analysis of 4 full scale tests with PMHS. Proceedings of the 20th International Technical Conference on the Enhanced Safety of Vehicles at Lyon, France.
- Simms C, Wood D (2009) Pedestrian and Cyclist Impact: A Biomechanical Perspective (Solid Mechanics and Its Applications, 166).
- Wood D (1995) Determination of speed from throw. In: Forensic Accident Investigation Bohan, Damask (Eds.), Lexis Law Virginia, USA.
- Otte D (1994) Influence of the Front hood Length for the Safety of Pedestrians in Car Accidents and Demands to the Safety of Small Vehicles.
- Maki T, Kajzer J, Mizuno K, Sekine Y (2003) Comparative Analysis of Vehicle-Bicyclist and Vehicle-Pedestrian Accidents in Japan. Accid Anal Prev 35: 927-940.
- Bastien C, Orlowski M, Bhagwani M (2017) Validation of a Finite Element Human Model Throw Distance in Pedestrian Accident Scenarios. Paper presented at 11th European LS DYNA Conference, Salzburg, Austria.
- Happer M, Arazewski A, Toor R Overgaard, R Johal (2000) Comprehensive analysis method for a vehicle/pedestrian collision.
- Searle J, Searle A (1983) The Trajectories of Pedestrians, Motorcycles, Motorcyclists etc., Following a Road Accident. 27th Stapp Car Crash Conference with IRCOBI and Child Injury and Restraint Conference with IRCOBI, San Diego, USA.
- XU X, Mc Gorry R, Chou L, Chang CC (2015) Accuracy of the Microsoft Kinect TM for measuring gait parameters during treadmill walking. Gait Posture 42(2): 145-151.
- Biewener A, Farley C, Roberts T, Temaner M (2004) Muscle mechanical advantage of human walking and running: implications for energy cost. J Appl Physiol 97(6): 2266-2274.
- GHBMC (Global Human Body Model Consortium). More information on GHBMC human models are available from www.ghbmc.com/.
- Watanabe R, Miyazaki H, Kitagawa Y, Yasuki Y (2011) Research of collision speed dependency of pedestrian head and chest injuries using human FE model (THUMS version 4), Washington DC, USA.
- Watanabe R, Miyazaki H, Kitagawa Y, Yasuki Y (2011) Research of collision speed dependency of pedestrian head and chest injuries using human FE model (THUMS version 4), Washington DC, USA.
- D3PLOT. LS-Dyna Advanced CAE Post Processor. Software available from www.oasys-software.com/dyna/software/d3plot/
- Engineering Statistics Handbook. 7.1.4. What are Conference Intervals? Available from: www.itl.nist.gov/div898/handbook/prc/section1/ prc14.htm.
- Kitagawa Y (2016) Development and Application of Virtual Human Body Model, THUMS.
- Road Safety Trust. Independent grant-giving Trust working hard to reduce the numbers of people killed or injured on our roads. Home page: www.roadsafetytrust.org.uk
-
C Bastien, B Rubrecht, H Davies, R Wellings, B Burnett. Numerical Validation of the Pedestrian Crossing Speed Calculator (PCSC) using Finite Element Simulations. Glob J of Forensic Sci & Med 1(5): 2019. GJFSM.MS.ID.000525.
-
Psychotherapy, Premature termination, Children, Adolescents, Anxiety, Depression, Ethical dilemma.
-

This work is licensed under a Creative Commons Attribution-NonCommercial 4.0 International License.


