 Research Article
Porosity Influenced on Prediction of Enterobacter Transport in Heterogeneous Sand Graved Depositions
Nwaoburu AO1 and Eluozo SN2*
1Department of Mathematics, Faculty of Science, Rivers State University, Nigeria
2Department of Civil, College of Engineering Gregory University, Nigeria
Eluozo SN, Department of Civil College of Engineering Gregory University Uturu Abia State, Nigeria.
Received Date: April 24, 2019; Published Date: May 13, 2019
Abstract
Porosity variation was observed to established high predominant heterogeneous concentration in this study, this condition was monitored on development of derived model to monitor the transport to phreatic depositions, such observed condition was found significant by applying nonhomogeneous system in monitoring the rates of Enterobacter transport in sand gravel formation. Linear trend were observed on the validation of the derived model simulation values, but monitoring the rate of porosity reflection on the transport process was when the concentration were plotted against variation of porosity, the lowest soil porosity developed highest concentration, while the highest soil porosity generated lowest concentration of the contaminant, the system from the expression shows the rate at which variation of soil porosity reflect it influence on the growth rate of Enterobacter in sand gravel deposition, the study has significant detailed various rate of porosity effect on the transport process to phreatic beds, the rate of migration also explained various rate of porosity variation based on porous rocks disintegration at various soil matrix, these are structured to develop variations of porous medium in sand grave formations. Such condition has made this paper imperative to monitor the growth rate of Enterobacter transport under the influences of porosity variation in sand grave depositions.
Keywords: Porosity; Prediction Enterobacter; Transport; Sand gravel
Introduction
Quality ground water the litho structure of the formation will definitely develop reflection, that is why the transport of this contaminant are observed to influence the rate of concentration from this present study, most ground water globally are polluted due the activity of human [1-5]. it is very imperative to note that several bacteria can be removed through media even when the percentage retained is very high. Animal faces contain massive numbers of bacteria including other several enter natural water systems.
Shallow aquifer sediments interstices o can easily accommodate bacteria and probably protozoa and fungi as well. Greater microbes can be excluded from most subsurface formations, except for those formation that deposit gravelly and cavernous aquifers [6-11] pollution that contain microbiological are derived mostly from human and animal activities such as unsewered settlements; onsite sanitation; cemeteries; waste disposal; waste disposal; feedlots; etc. However, with very limited exemptions the only waterborne microbial pathogens of man are vitally human bacteria, viruses and protozoa, consideration the safety on drinking water such be adhered from the point of view of infectious diseases, because if that is ignored pollution from such sources will definitely contaminant the ground waters [12-16].
Theoretical Backgrounds
Nomenclature:
C = Shigella Concentration
A(x) = void Ratio /Permeability of Soil
B(x) = Velocity of Flow
C-n-[α1x] = Porosity of soil
x = Depth

Transform the above Bernoulli’s Equation to a linear first order DE gives:
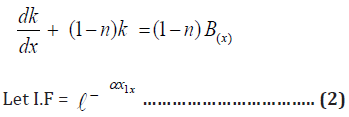
Use I.F to Solve (2) above
Hence, the general Solution becomes:

Materials and Method
Standard laboratory experiment where performed to monitor Enterobacter using the standard method for the experiment at different formation, the soil deposition of the strata were collected in sequences base on the structural deposition of the lithology at different locations, this samples collected at different location generated variations at different depths producing different Enterobacter concentration through column experiment, from the pressure flow at different strata, the experimental result were compared with the theoretical values for the validation of the model.
Results and Discussion
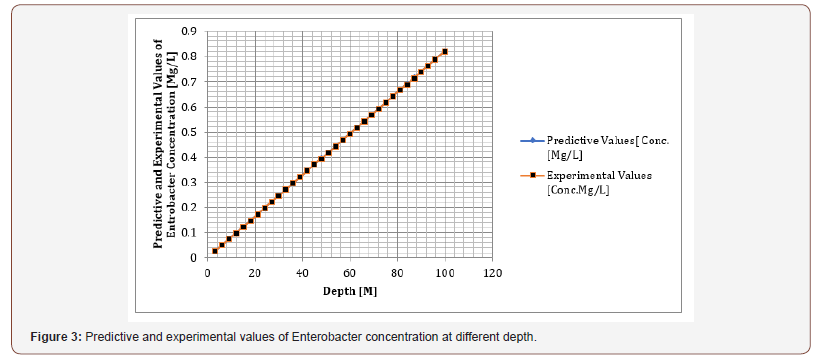
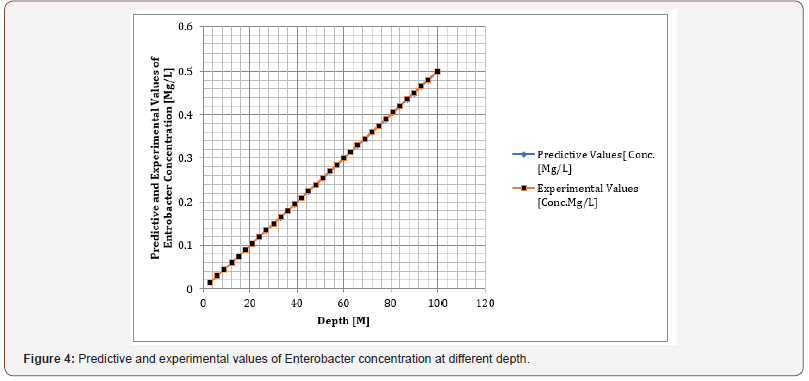
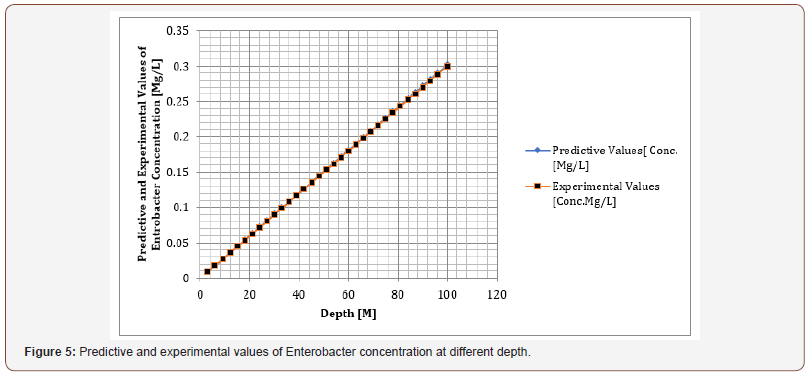
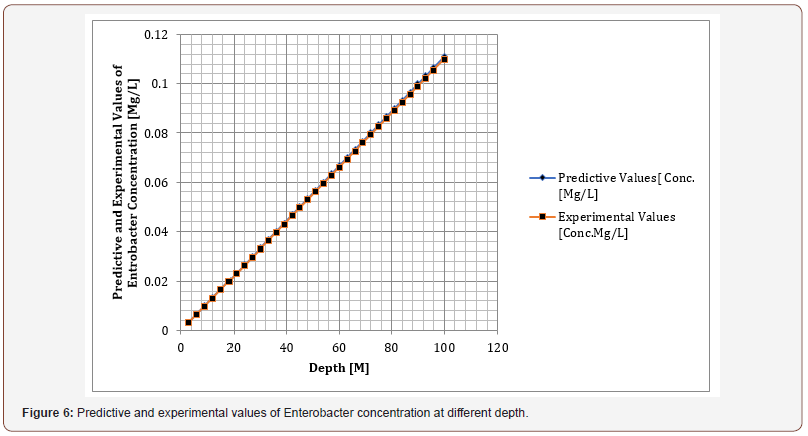
Results and discussion are presented in tables including graphical representation for Enterobacter concentration (Tables 1-8).
Table 1: Predictive and experimental values of Enterobacter concentration at different depth.
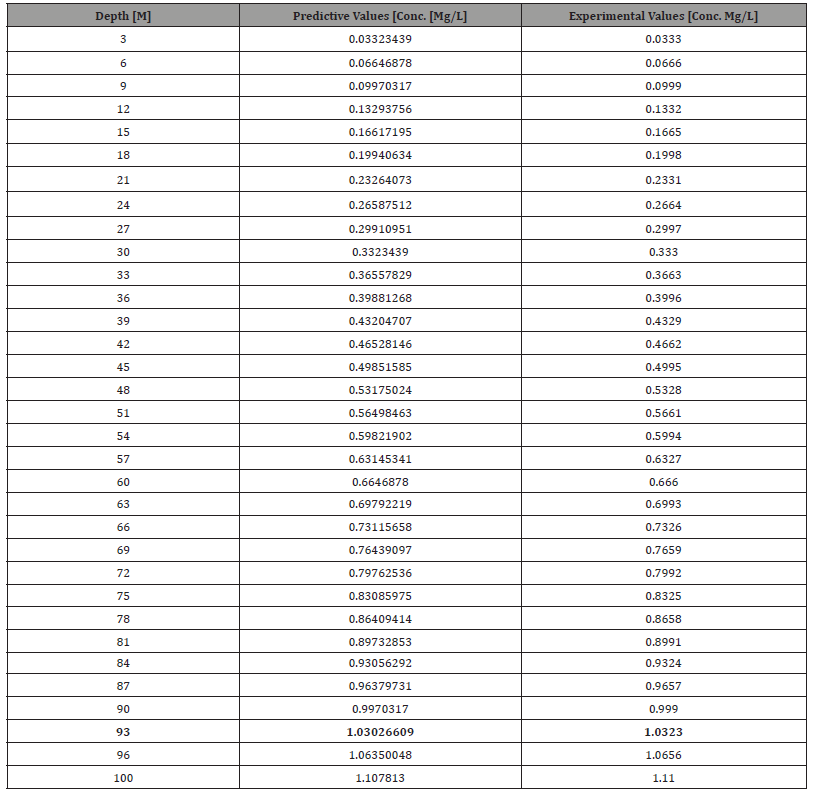
Table 2: Predictive and experimental values of Enterobacter concentration at different depth.

Table 3: Predictive and experimental values of Enterobacter concentration at different depth.
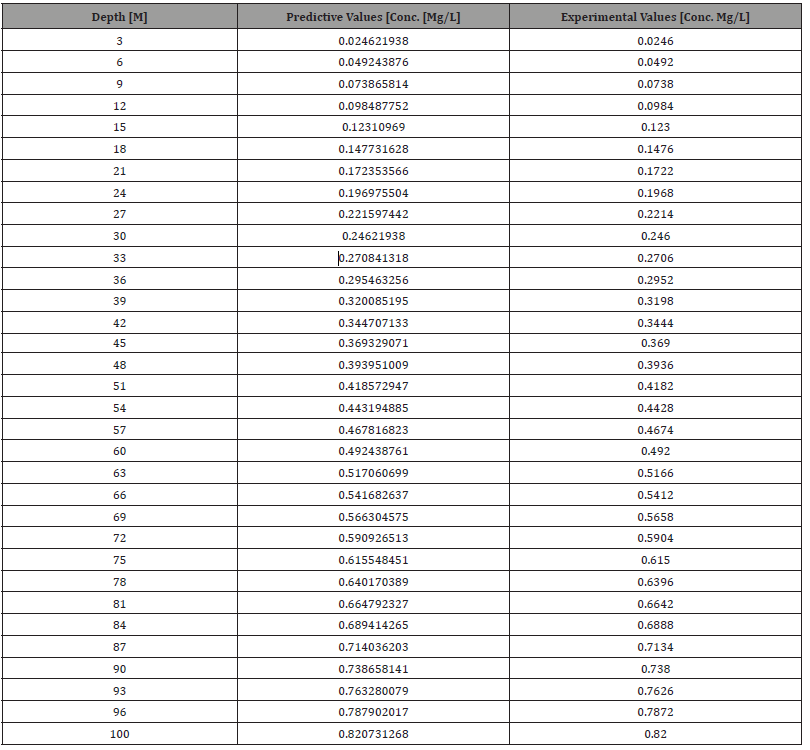
Table 4: Predictive and experimental values of Enterobacter concentration at different depth.
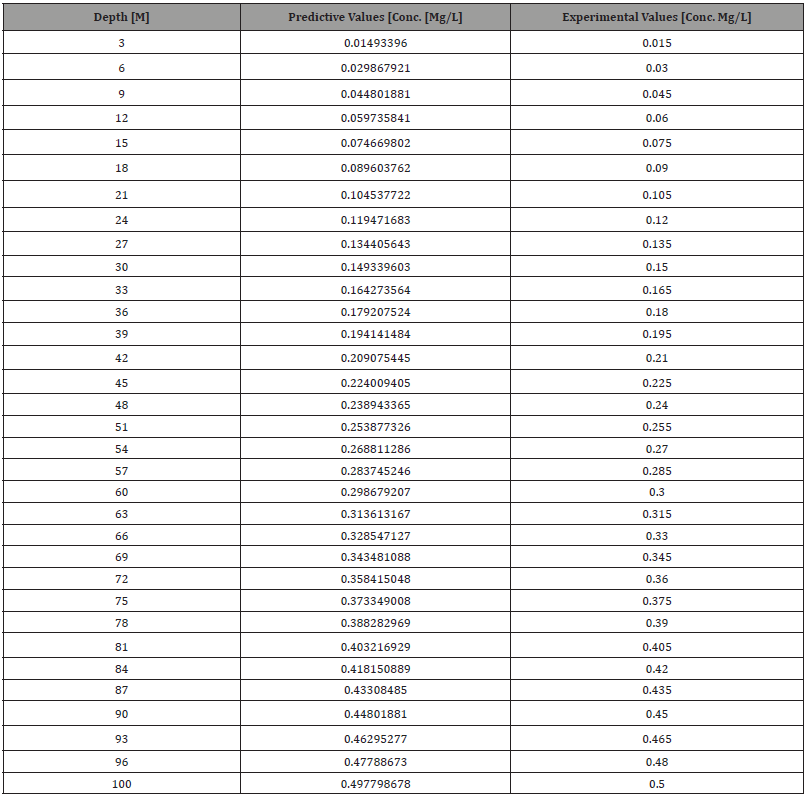
Table 5: Predictive and experimental values of Enterobacter concentration at different depth.
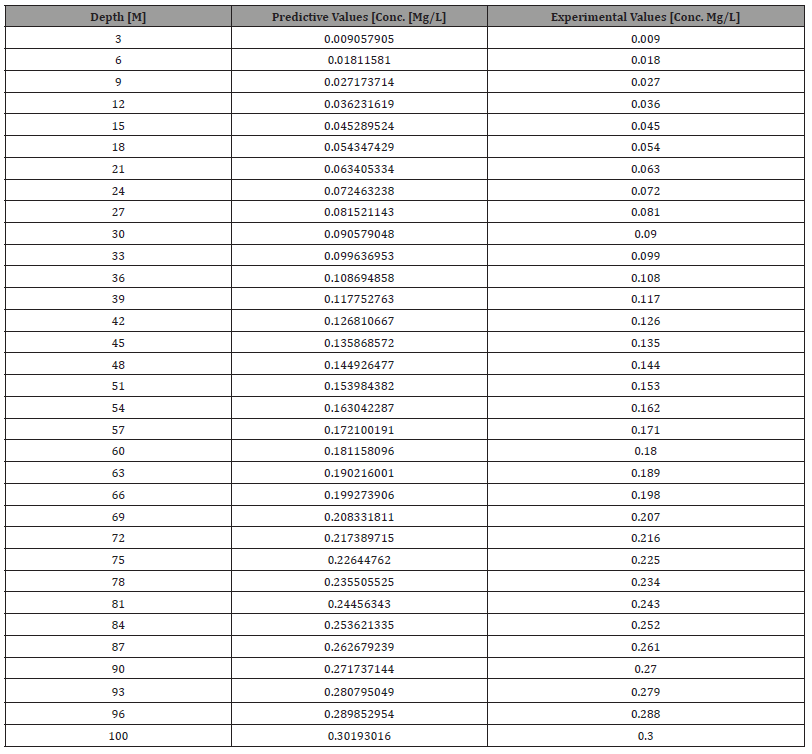
Table 6: Predictive and experimental values of Enterobacter concentration at different depth.
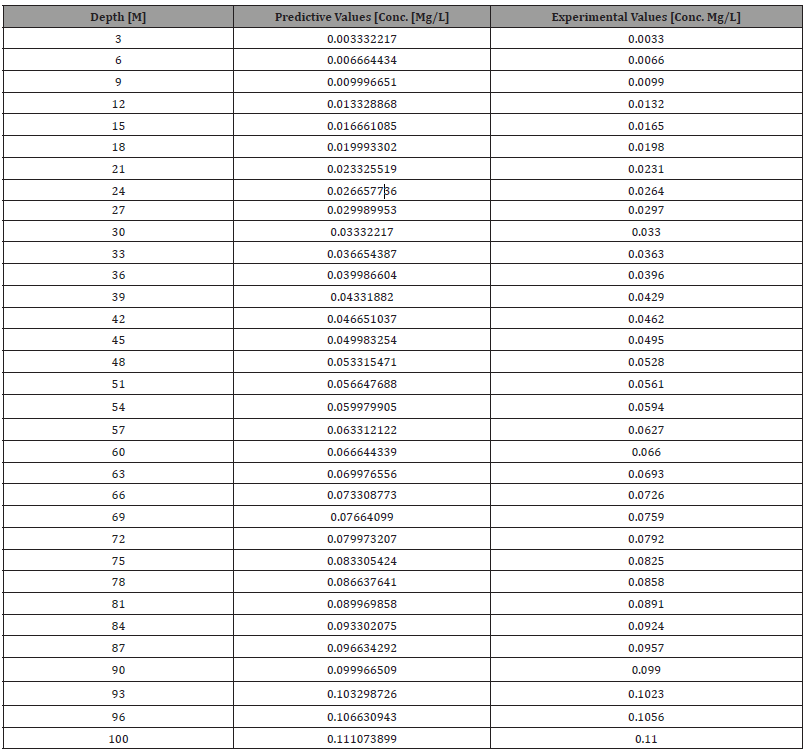
Table 7:Predictive and experimental values of Enterobacter concentration at different depth.

Table 8:Variation predictive values of Enterobacter concentration at different depth.
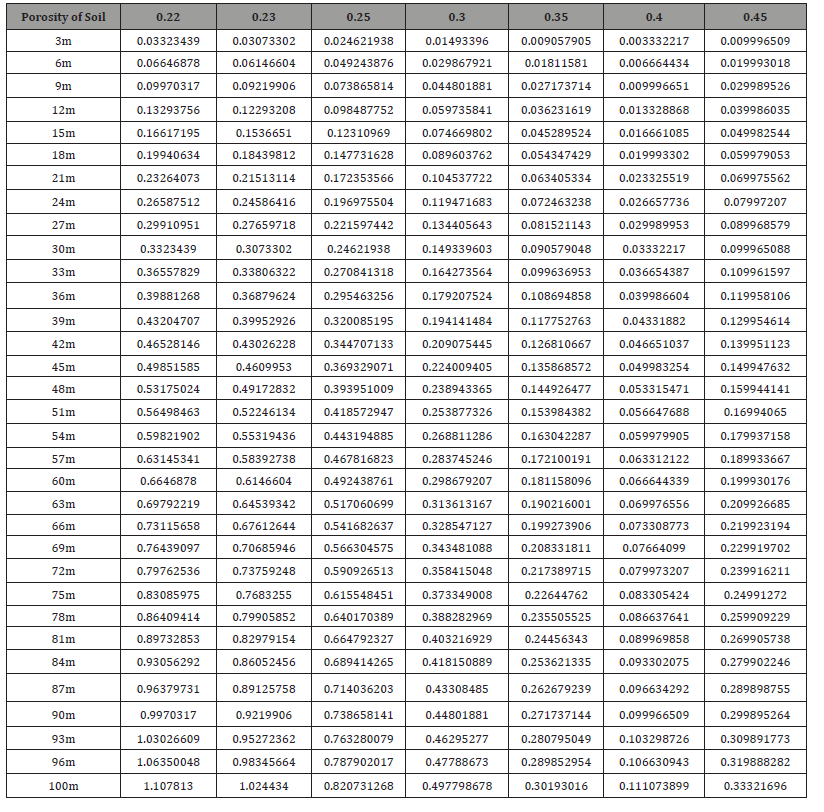
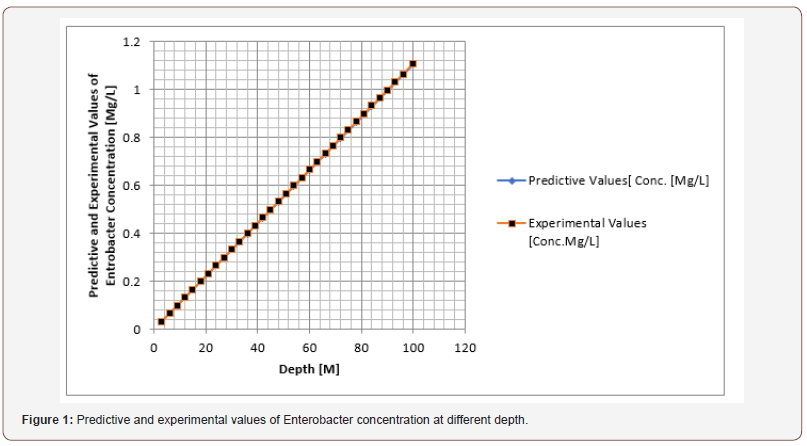
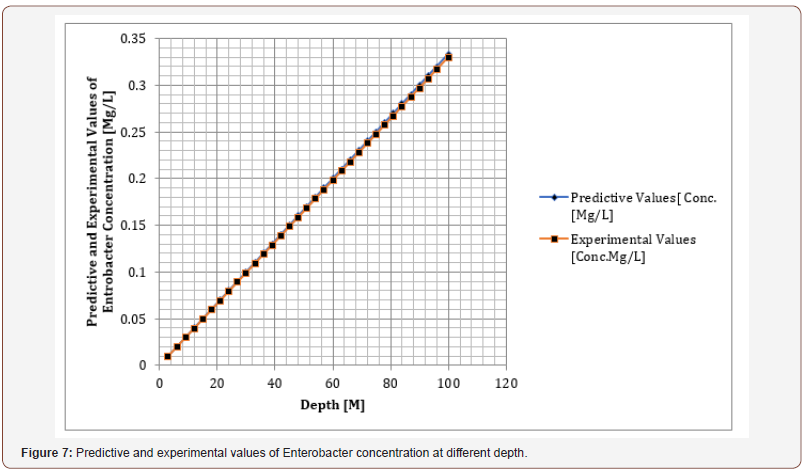
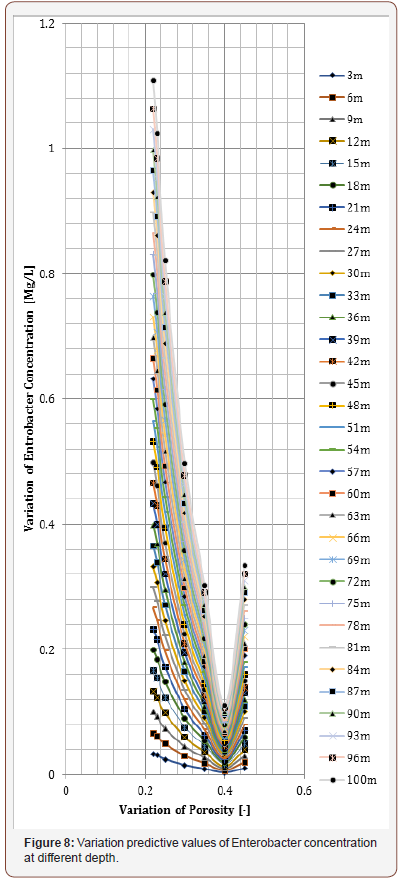
The Figure from 1-7 express linear trend of the Enterobacter migration in sand grave formation, the graphical representation express linear trend under exponential condition, this shows that the contaminant are under increase to the optimum depth recorded at 100m, such condition were observed in all the figures, validation were carried where all the predictive valued were compared with experiment data, and both parameters developed favorable fits, the study shows linear trend but the concentration deposition at different figure are not on linear condition, this experienced are observed in figure [8] where the variations of porosity were monitored at different depth, the deposited of porosity were plotted against concentration at different depth, the figure shows how porosity influence are reelected on the concentration applying nonhomogeneous system, the figure express the rate of concentration from [3-100m] of the formation, this condition explained the litho structure of the deposition in heterogeneous setting, these factors were monitored through the predominant formation characteristics monitored to influence the system in heterogeneous sand grave depositions, the concentration of the contaminant in sand gravel express several litho structure in study environment, it has display its rate of depositional variations of porosity in different depth, high to low concentration from the last figure explained extensively the detailed transport influence of the contaminant, the derived simulation values were compared with experimental values and both parameters express best fit correlation.

Conclusion
The study monitoring the reflection influence from porosity depositions in sand grave formation, the study observed linear trend in the figure compared with experimental values, these parameter developed best fits correlation, but the reflection of porosity on Enterobacter migration to phreatic deposition were observed through comparison between concentration at different depth and variation of soil porosity. The study experienced high to low concentration; different from exponential rate in other figures, this expression examined the rate of influence from soil porosity on Enterobacter transport in deltaic depositions, the rate of concentration has applied porosity depositions at different locations as a determine factor on migration rate of the contaminant. The derived solution generated this non-homogeneous system to monitor the concentration under such predominant reflection in the study area. The study has detailed the behavior of porosity heterogeneity in the transport system of Enterobacter in sand gravel depositions (Figure 8).
Acknowledgement
None.
Conflict of Interest
No conflict of interest.
References
- Eluozo SN (2012) Mathematical Model to Predict Klebsiella Pneumonae Transport influenced by Porosity and Void Ratio in Shallow Aquifers. ARPN Journal of Earth Science 1(2).
- Eluozo SN, Nwaoburu AO (2013) Mathematical Model to Monitor the deposition of Void ratio and Dispersion of Phosphorous Influenced in salmonella Growth Rate in Coarse and Gravel Formation in Borikiri, Rivers State of Nigeria. American Journal of Engineering Science and Technology Research 1(4): 59-67.
- Eluozo SN, Nwaoburu AO (2013) Mathematical Model to Predict Adsorption Rate of Potassium Influenced by Permeability in Lateritic and Silty Formation in Coastal Area of Eagle Island, Port Harcourt, Niger Delta of Nigeria. International Journal Sustainable Energy and Environment 1(5): 111-119.
- Eluozo SN, Nwaoburu AO (2013) Modeling the Deposition Adsorption Rate of Carbon Influenced by Porosity in Semi Confined Bed in Okirika, Rivers State of Nigeria. International Journal of sustainable Energy and Environment 1(5): 103-110.
- Engelbrecht JFP (1993) An assessment of health aspects of the impact of domestic and industrial waste disposal activities on groundwater resources, pp. 1-59.
- Eluozo SN, Nwaoburu AO (2013) Mathematical Model to Predict the Migration of Cryptosporidium in Homogeneous Formation in Obio- Akpor, Rivers State of Nigeria. International Journal Applied Chemical Science Research 1(6): 83-94.
- Eluozo SN, Nwaoburu AO (2013) Modeling the Transport of Arsenic on Pore Fluid and Solid Surface in Heterogeneous Soil Formation, Niger Delta of Nigeria. World Journal of Science and Technology Research 6: 124-134.
- Eluozo SN, Nwaoburu AO (2013) Mathematical Model to Predict Transient Flow Influenced by Compressible Fluid in Non-Homogeneous Anisotropic Aquifer in Deltaic Environment. Sjournals: Engineering Science and Technology, pp. 1-9.
- Eluozo SN, Nwaoburu AO (2013) Mathematical Modeling and Simulation to Predict the transport of Diplococcic in Homogeneous Unconfined Aquifer in Port Harcourt Metropolis, Niger delta of Nigeria International Journal of Materials, Methods and Technology 1(5): 103-115.
- Ghiores WC, Wilson JT (1988) Microbial ecology of the Terrestrial Subsurface. Advances in Applied Microbiology. Academic Press Inc 33: 107-172.
- Engelbrecht JFP, Tredoux (2000) G bacteria in “unpolluted” groundwater Presented at the WISA 2000 Biennial Conference, Sun City, South Africa, pp. 2.
- Eluozo SN, Ademiluyi JO (2013) Establishment of Porosity and Permeability Model Correlation to Validate E. coli Transport to Groundwater Aquifers; Rivers State of Nigeria. International Journal of Engineering and Technology, Science Publishing Corporation 2(1): 17- 24.
- Eluozo SN (2013) Effect of formation characteristics on hydraulic conductivity in unconfined bed in Etche Rivers State of Nigeria: Scientific Journal of Pure and Applied Science 2(1).
- Eluozo SN (2013) Dispersion influence from Void Ratio and Porosity on E. coli Transport in Homogeneous Formation in Coastal Area of Degema, Rivers State of Nigeria: Scientific Journal of Environmental Science 2(1): 10-18.
- Eluozo SN, Ademiluyi JO, Nwaoburu AO (2011) Model Development Approach to Predict the Behaviour of E. coli Transport on Stationary Phase in Khana, Deltaic Environment of Rivers State, Nigeria. International Journal of Current Research 3(7): 140-145.
- Eluozo SN, Nwaoburu AO (2013) Model Evaluation to Predict Nitrogen Depositions influenced by Porosity and Cadmium Inhibition in Coastal area of Port Harcourt. American Journal of Engineering Science and Technology Research 1(8): 128-140.
-
Nwaoburu AO, Eluozo SN. Porosity Influenced on Prediction of Enterobacter Transport in Heterogeneous Sand Graved Depositions. Glob J Eng Sci. 2(3): 2019. GJES.MS.ID.000536.
-
Porosity, Prediction Enterobacter, Transport and sand gravel, Void Ratio, Porosity of soil, Permeability of Soil, Velocity of Flow
-

This work is licensed under a Creative Commons Attribution-NonCommercial 4.0 International License.


