 Research Article
Investigation of the Evolution of Clay Microstructure under Different Loading Paths and Impact on Constitutive Modelling
Federica Cotecchia1, Simona Guglielmi1* and Antonio Gens2
1Department of Civil, Environmental, Land, Building Engineering and Chemistry, Polytechnic University of Bari, Italy
2Departamento de Ingeniería del Terreno, Universitat Politécnica de Catalunya, Spain
Simona Guglielmi, Department of Civil, Environmental, Land, Building Engineering and Chemistry, Polytechnic University of Bari, Italy.
Received Date: March 23, 2020; Published Date: April 03, 2020
Abstract
Part of a research programme concerning the investigation of the evolution of clay microstructure under different loading paths is presented. The material is a stiff over consolidated natural clay, strongly bonded by diagenetic processes. Its one-dimensional compression and consequential microstructural changes are compared with those of the same clay when reconstituted. The microstructural changes are evaluated using scanning electron microscopy. The results of oedometer tests are discussed, some carried out in a purpose-built constant-rate-of- strain oedometer which enables the behaviour of the natural clay to be studied well beyond yield. The variations in swelling index, stiffness and coefficients of consolidation and permeability are compared pre- and post-yield for the two clays. Both clays are found to have significantly different states and fabrics at all stages of compression. Post-yield the structural changes in the natural clay are initially a destruction of the original fabric, and then a rearrangement of the clay particles into a systematic packing of honeycomb and perfectly oriented fabrics. The same fabric architecture is recognized at medium magnification in the reconstituted clay compressed to high pressures. Despite the different states and structures of the two clays, the trends of compression and consolidation behaviour are found to be similar.
Keywords: Clays; Clay microstructure; Micro to macro; Microscopy; SEM
Introduction
The paper presents part of a research work in the field of the interpretation of the mechanical response of clays to support their constitutive modelling, according to an approach which combines the investigation of the soil element macro-behaviour, through laboratory experimental testing, with the observation of the soil features and processes at the micro-scale, through scanning electron microscopy, SEM.
The effect of compression on the mechanical behaviour of clays, once reconstituted in the laboratory, has been the subject of experimental studies for many years, and has been extended to the behaviour of natural clays, which develop, in their geological history, different structure from that forming in the reconstituted during normal consolidation in the laboratory [1-3]. To date, several studies in the literature have shown that processes other than simple compression can result in an increase in the strength of clays [1-6], one example being diagenesis, which is one of those geological processes that cause an increase in stiffness and strength of the natural clay above that provided solely by the reduction in volume with compression.
Diagenetic processes, which are responsible for important changes in natural clays at the microscale, typically occur at depth, under high effective stresses. They give rise to the aggradation of swelling minerals, the increase in bonding (non-frictional interparticle forces [7,8]) and changes in fabric (the arrangement of the soil particles [7,8]). As a result, natural clays can develop a structure stronger than that of the corresponding (same void ratio) reconstituted clay.
This paper examines the microstructure of a natural stiff, diagenetically modified clay, by comparison with the microstructure of the same clay when reconstituted in the laboratory. This comparison is then extended to explore the evolution of microstructure after 1D compression to states preand post- gross-yield, up to large pressures. The clay subjected to study is the mid-Pleistocene Pappadai clay from Southern Italy, whose geological history is known in some detail [9]. This study is one aspect of a wider research [2,3,10-12] aimed at identifying the main physical factors and internal features which control, at the micro-scale, the material response, causing given behavioural facets. The research final aim is at assessing the influence of the different aspects of behaviour on model parameter values, hence supporting constitutive modelling and finding a relation between classes of behaviour and corresponding models and classes of clays.
Materials and Methods
Pappadai clay is a Pleistocene marine clay which was deposited in a quiet sea in the Montemesola Basin, near Taranto. The engineering geology of the clay is discussed by Cotecchia & Chandler (1995), who present paleontological and microstructural data demonstrating both the stillness of the water and the reducing conditions of the depositional environment. The main properties of the clay and its mineralogical composition are shown in Table 1.
Table 1:Index Properties and mineralogy of Pappadai clay.

The clay is of high plasticity and possesses a high carbonate content. Cotecchia & Chandler (1995) have shown that the carbonate content is largely concentrated in the sand and the silt fractions of the soil, since the carbonates increase with reducing clay fraction and plasticity index [13]. Large part of the sand and silt fractions are formed of shells of foraminifera and nannofossils. However, as will be seen, at least part of the carbonates present contribute to bonding in the clay.
Block samples were taken from a depth of 25 m during construction of a reservoir draw-off shaft and were subjected to mechanical testing [2]. The clay forming the block samples is massive and regularly laminated.
At the sampling location the clay is overconsolidated due to the erosion of some 120 m of overlying sediments. Prior to erosion the clay had undergone diagenesis resulting in a decrease in the portion of smectites, an increase in the portion of the nonswelling minerals (intergrades, Table 1), and a decrease in activity, all with respect to depth [9]. Thus, it is likely that there will have been changes in microstructure of the clay under the stress levels required to generate the mineralogical changes, that is towards the end of normal consolidation.
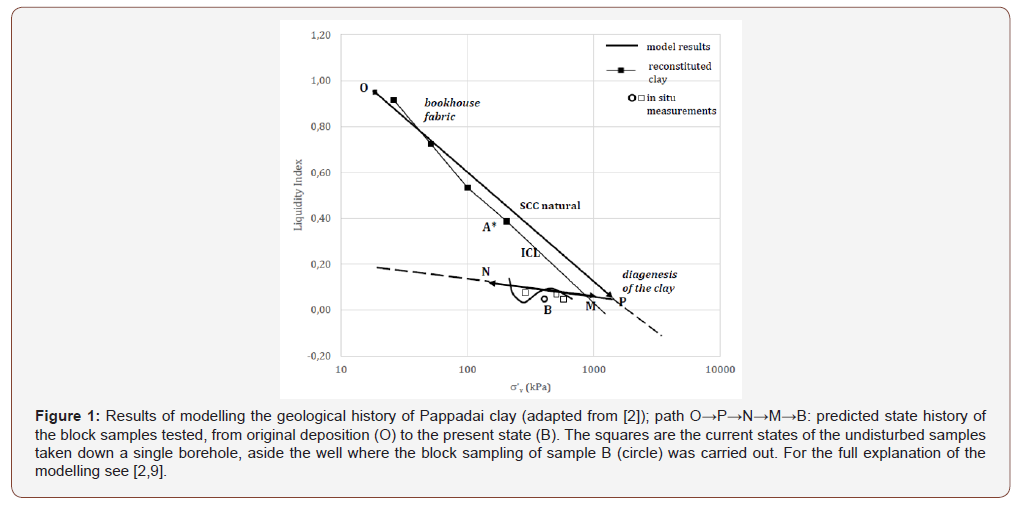
After unloading due to erosion, the clay in the top strata of the deposit underwent deep drying and subsequently swelled. Cotecchia e Chandler (1995) confirmed this reconstruction through the modelling of the state history of the deposit [9], the results of which are shown in Figure 1. The current profile of liquidity index against vertical effective stress at Pappadai and the modelled one are compared in Figure 1. The history of normal consolidation (stage (i)-O→P), erosion (stage (ii)-P→N), drying of the sole top strata due to lowering of the water table (stage (iii)-N→M) and water table rise (stage (iv)-M→B) was modelled and resulted in the state paths represented in the figure as continuous lines.
The last profile is “S” shaped and, as such, it is consistent with the profile of liquidity index on the undisturbed samples taken at different depth along a borehole and a shaft nearby; this latter one is the block sample B in the figure. Such undisturbed block sample is that which the experimental data presented in the following refer to. Its preconsolidation state corresponds to point P in Figure 1, as for an overconsolidation ratio (OCR) of 3.1. Such OCR resulted solely from the erosion cycle (ii) cited before, since the sample was not affected by the deep drying, which instead affected the clay layers above. For the full explanation of the reconstruction of the geological history of the clay and of the state history modelling, whose results are sketched in Figure 1, refer to [2,9].
The natural clay was reconstituted in the laboratory at a water content 1,6x liquid limit, and was one- dimensionally consolidated in a consolidometer to a vertical effective stress of 200 kPa, point A* in Figure 1, at which point it was removed from the consolidometer and placed in an oedometer where the one dimensional loading was continued. As seen in Figure 1, natural Pappadai clay followed a sedimentation compression curve (SCC; see [14] for the definition, or [1,2]) to the right of the normal consolidation line of the reconstituted clay (ICL; [1]). Thus, after a normal consolidation to point P, the natural clay already had a structure different from that of the reconstituted clay, and later underwent further changes through diagenesis.
The qualitative analysis of the clay fabric is carried out on both the natural and the reconstituted clay by means of scanning electron microscopy (SEM), using freeze-dried gold-coated clay specimens trimmed from the undisturbed block sample and from the specimens subjected to 1D compression after completion of the test and rapid undrained unloading. The microstructure of the natural clay is examined at different stages of 1D loading, i.e. at undisturbed state, soon after gross yield and to large pressures, and compared to the microstructure of the reconstituted clay after consolidation in the consolidometer and compressed to large pressures.
SEM micrographs taken on vertical fractures are shown, and sketches are reported in which fabric features are identified and local fabric arrangements are recognized. The orientation of the fabric is then quantified by means of digital image processing [15] on micrographs of size corresponding to the micro-scale representative element volume (micro-REV, [12]), recognised for the clay under study as the clay portion of size about 10-3 mm3, investigated at the medium magnification [12]. The microstructural data are related to the observed macro- response of the clay and to the constitutive hydro-mechanical parameters, highlighting what the constitutive laws deviced to represent the material macroresponse in the frame of porous media hydro-mechanics are reflecting at the micro-scale.
Results and Discussion
Clay microstructure
The natural Pappadai clay has a densely packed fabric, which is well oriented at the medium scale. The state of the clay examined is represented by point B in Figure 1, and its fabric is shown at medium-high magnification in Figure 2, as it appears on a subvertical fracture.
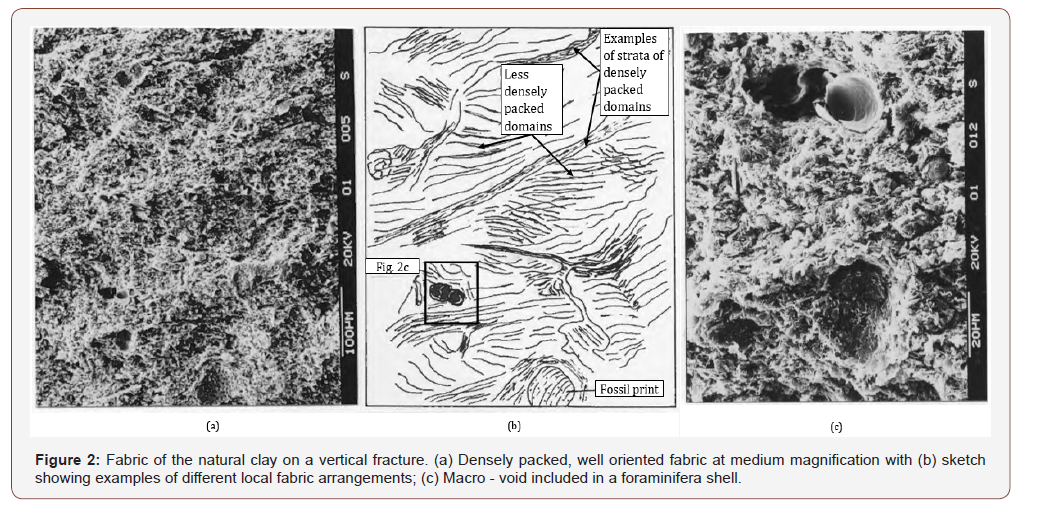
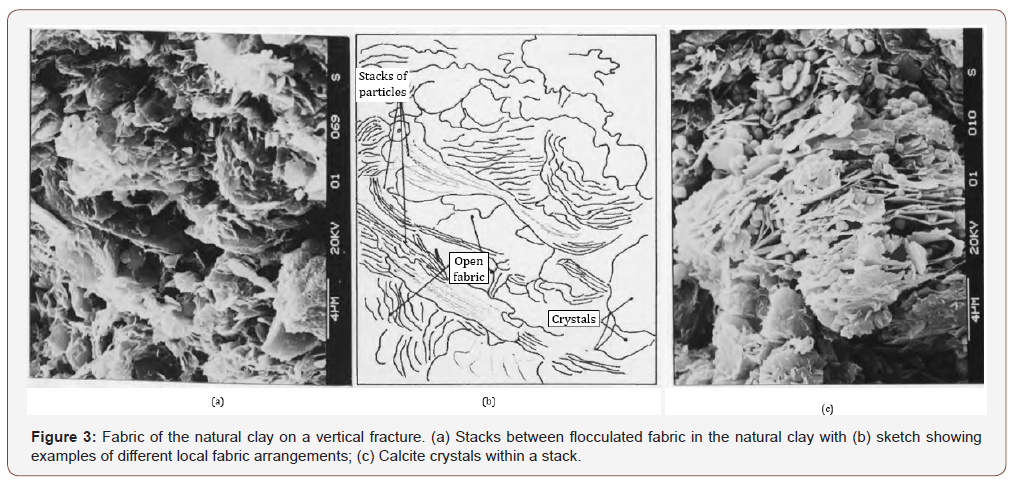
It appears that natural Pappadai clay is formed of both very dense stacks, where domains are in face to face contact [8,16,17], and areas where both domains (aggregates of particles in face to-face contact) and single particles are in edge-to-face contact (examples of local fabric arrangements are sketched in Figure 2b). Thus, the clay fabric may be considered as a highly compressed ‘bookhouse’ type [16] and overall has a medium orientation. It has a complete preferred orientation (‘c.p.o fabric’, [16]) in the stacks, and random orientation between the stacks, despite the high vertical stresses (about 1300 kPa) reached in normal consolidation. Higher magnification micrographs as that in Figure 3a show stacks between flocculated fabric, as sketched in Figure 3b.
The image processing technique proposed by Martinez-Nistal et al. (1999) has been used to quantify the orientation of the fabric of natural Pappadai clay at medium magnification [12]. The “index of fabric orientation”, L (see [15] for the methodology used in the image processing), varies between 0.21 and 1 for “medium to very oriented fabric”, and is in the range 0,24-0,37 for Pappadai clay [12]. This value confirms the above qualitative interpretation of the SEM micrographs.
Figure 1 shows that at the end of normal consolidation (point P in Figure 1), the natural Pappadai clay had a liquidity index somewhat higher than that of the reconstituted clay at the same stress, and so had more open fabric than the reconstituted clay. The SEM analysis suggests that the openness of the natural clay fabric is not the result of calcite crystals bonding the particles during normal consolidation, and, in fact, calcite crystals are only rarely seen (Figure 3c).
However, using chemical microanalysis, Cotecchia & Chandler (1997) have demonstrated the presence of a film of amorphous calcite coating both the clay particles and their contacts. Being amorphous, this calcite is likely to be authigenic, as instead appears to be in Figure 3c; therefore, the amorphous calcite film binding the particles results from diagenesis, which has advanced to reach about a very early stage of cementation. However, the soil is not cemented yet, since it can easily be de-aggregated by remoulding with the addition of water. It follows that in clays, a high carbonate content does not necessarily imply carbonate cementing, since much of the carbonates may be forming fossil shells and the eventual carbonate bonding can relate only to a very early stage of cementation.
The bonding of Pappadai clay is such that a small undisturbed sample softens only a little after being submerged in water for several months. Drying at 120°C caused the clay to open up along the contact of the clay with silt bedding planes, and the softening of the clay on submergence was then more significant. Hence, the diagenetic bonding of Pappadai clay is significantly reduced by drying.
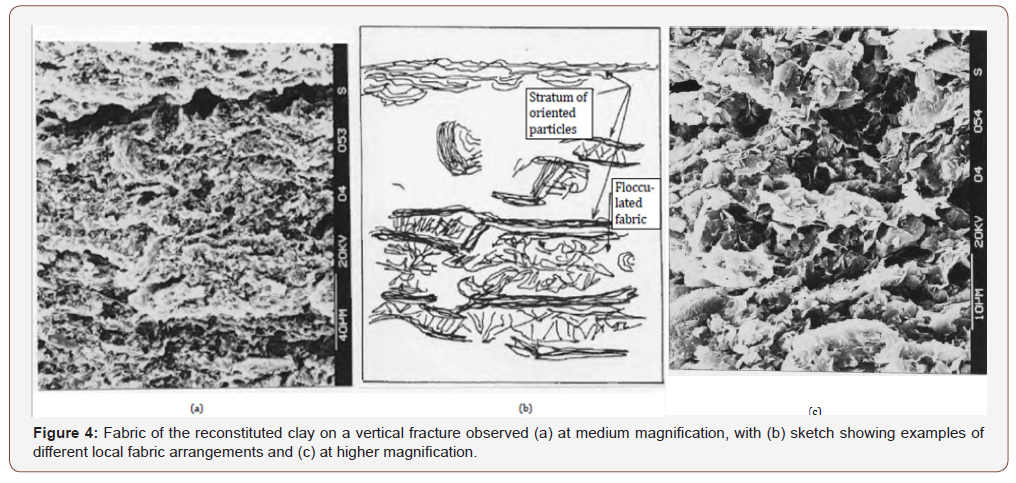
The fabric on a vertical fracture of reconstituted Pappadai clay, A* in Figure 1, is shown at medium-high magnification in Figure 4. As with the natural clay, a non-uniform orientation of the clay particles took place during one-dimensional normal consolidation. Both stacks and randomly oriented flocculated fabric areas can be recognized (Figure 4b). The image processing of several medium magnification micrographs allows to identify values of L in the range 0.23-0.27, indicative of a well oriented fabric.
So, although the reconstituted fabric (see for example Figure 4c) is found to be more open than that of the natural clay, as expected given the difference in void ratio between points A* and B in Figure 1, the natural fabric is not more oriented. Rather, the natural fabric appears to have less regular alternations of oriented and flocculated fabrics than the reconstituted, despite the much higher preconsolidation pressure, hence appearing far more complex, probably the consequence of diagenesis.
Influence of structure on gross yield
Figure 5 shows the results of both incremental loading (OED) and constant-rate-of-strain (CRS) oedometer tests on both the natural and the reconstituted Pappadai clay [2]. The CRS tests were carried out in a purpose-built high- pressure oedometer, with drainage to the upper boundary of the sample and pore pressures measured at the base [18]. The constant-rate-of-strain tests were interpreted using a modified version of the theory developed by [19]. The CRS test data presented in Figure 5 and in the following figures refer to about the same strain rates. In the following figures the * is used to distinguish tests on the reconstituted clay.
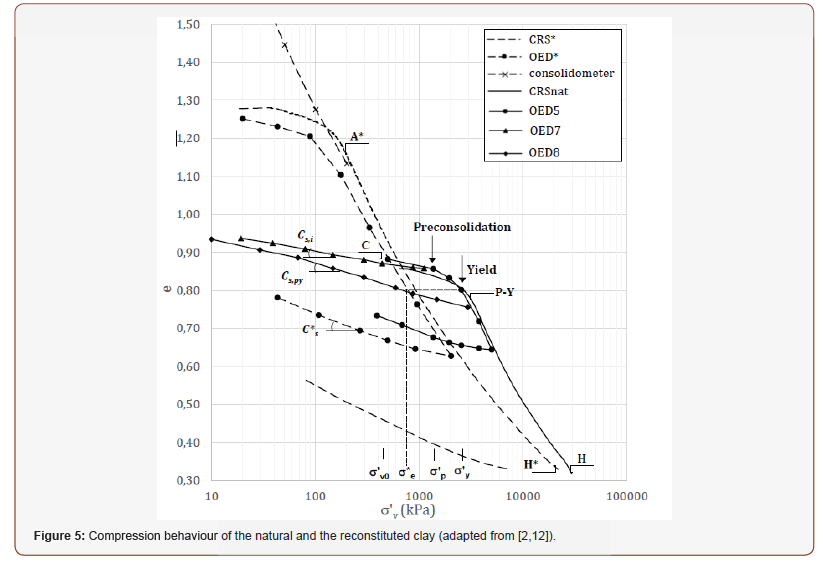
The average gross yield stress (i.e. the stress beyond which a transient major stiffness decay occurs, as reported by [3]) for the reconstituted clay is 200 kPa (Figure 5), i.e. the maximum stress attained in the initial consolidation in the consolidometer. Beyond gross yield, the CRS oedometer test on the reconstituted clay defines the intrinsic compression line (ICL; [1]) of Pappadai clay, for the stress range 0.2-22 MPa.
The current state of the natural clay in situ is indicated as C in the figure with a vertical stress at the sampling depth, σ’v0, of 415 kPa. Representative compression and swelling curves are shown, some compression stages prior to swelling being omitted for clarity.
The gross yield state for the natural clay lies far to the right of both the current clay state C and the ICL, confirming that the natural clay is both overconsolidated and also has a different structure from the reconstituted clay. If overconsolidated only by simple geological unloading, the clay gross yield should lie at about the preconsolidation state (Figure 5), which also lies to the right of the ICL since the structure of the natural clay was already stronger than the reconstituted clay after normal consolidation (Figure 1). However, the natural clay does not gross yield until well beyond the preconsolidation stress, since the gross yield stress is σ’y≈2600 kPa (Yield, Figure 5). This observation suggests that a strengthening of the clay structure occurred as a result of additional bonding acquired during diagenesis, increasing the gross yield stress of the clay. Consequently, the current yield stress ratio YSR= σ’y/ σ’v of the natural clay, that is the ratio of the yield stress σ’y to the current vertical stress is σ’v (YSR=σ’y/ σ’v), is twice the value of the clay’s geological OCR.
It follows that Pappadai clay is an example of a stiff clay which owes its high strength not only to its considerable compression during normal consolidation, but also to a strengthening of the clay structure due to diagenetic bonding. The effects of such diagenetic bonding are evident in the mechanical response of the clay to loading.
In test OED 7 (Figure 5), a natural clay sample was unloaded from its in situ state, then reloaded (reloading is not shown in Figure 5). In the laboratory the undisturbed state corresponds to a suction of about 700 kPa, measured by the filter paper method [20]. In the initial swelling stage of test OED 7 the response of the undisturbed clay to unloading is quite stiff, much stiffer than after compression to gross yield.
In Figure 6 the whole test OED 7 is shown, together with another similar test, OED 5, in which the sample was loaded from the undisturbed state. It can be seen that sample OED 7 gross yields at a lower stress (1800 kPa) than the that exhibited by the clay in test OED5, as a consequence of the unloading before reloading. Not only does the swelling process reduce the gross yield stress (hence reducing the YSR), but it also results in the post-yield compression line differing from that of the undisturbed clay. This illustrates the level of weakening induced on the structure of Pappadai clay by a large unloading path and subsequent reloading. This weakening, although limited, appears to be due to the slow cyclic (rather than monotonic) unloading-reloading path, which is causing the degradation of the amorphous calcite film binding the particles.
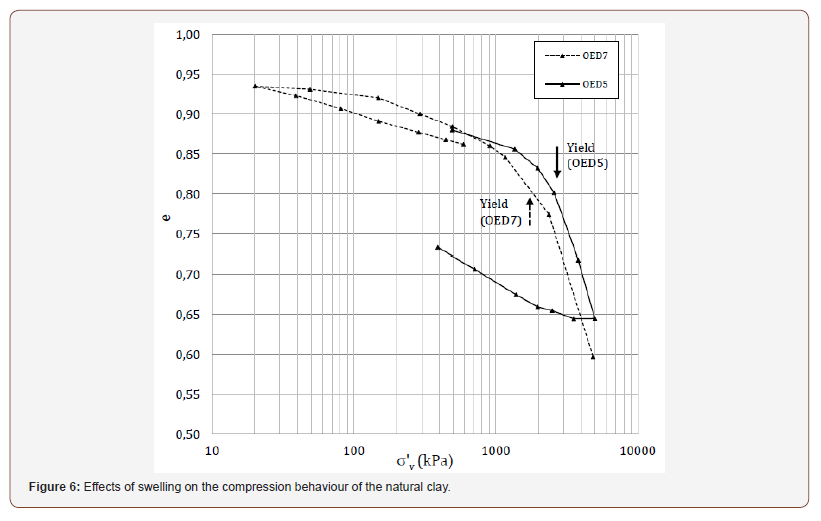
Despite being limited, this nonetheless results in permanent changes of the mechanical properties of the clay, which necessarily include changes in the position of the state boundary surface (SBS) of the clay and changes of the constitutive law parameters describing it.
Several constitutive models have been developed to improve the simulation of the soil behaviour before yield, i.e. below the SBS, where instead the Cam Clay model [21-23] assumes isotropic elastic behaviour, in particular to improve the prediction of the cyclic soil response (e.g., for reconstituted clays [24]). When extended for natural ‘structured’ clays, kinematic hardening models [e.g. 25- 27] incorporate a ‘structure surface’ to embody the effects of the natural clay structure on the macro-response (Figure 7). Thus, the effects of the difference between the strength of the structure of the natural clay and that of the reconstituted clay are reflected in the different size of their SBS. The evolution with loading of the size of the structure surface is controlled not only by the Cam clay isotropic hardening rule (variation in size generated by plastic volumetric strain increment; [21-23]), but also by a negative isotropic hardening contribution describing the effect of structure degradation, which reduces the sizeof the structure surface as plastic volumetric and deviatoric strains occur, by means of parameters such as the rate of destructuration [25,26] or structure degradation parameters [27].
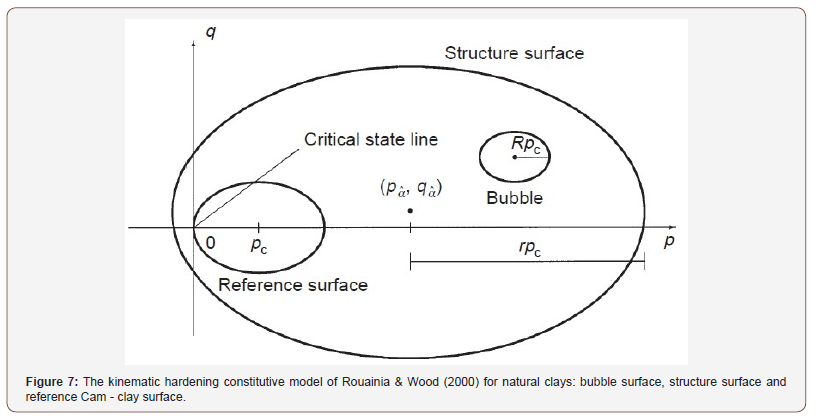
Hence, the weakening of bonding observed for Pappadai clay (Figure 6) which affects the position of the gross- yield stress and subsequently the clay SBS, is simulated by those constitutive models [25-27] by means of a structure degradation mechanism, reflected in the negative component of isotropic hardening, which reduces the size of the structure surface as plastic strains increase.
Structural changes in the clay with compression
In Figure 5 tests are shown in which both natural and reconstituted Pappadai clay have been compressed to stresses well beyond gross yield, resulting in about 30% and 40% vertical strain respectively. In order to investigate the changes in fabric taking place in these tests, oedometer samples were rapidly unloaded in undrained conditions after the end of the test, then freeze-dried, gold-coated and examined in the scanning electron microscope. The reconstituted sample examined was compressed up to σ’v =22 MPa (point H* in Figure 5), while one of the two natural clay samples was compressed just beyond gross yield, to σ’v =to 3 MPa (point P-Y in Figure 5), and the other compressed well beyond gross yield, to σ’v =25 MPa (point H in Figure 5).
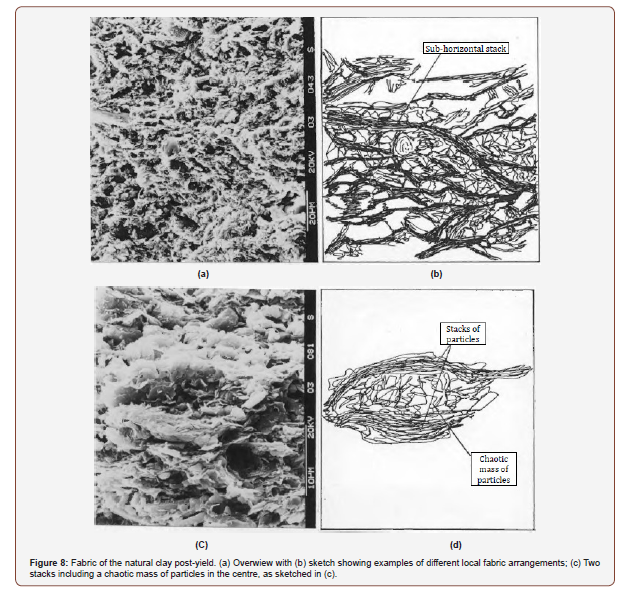
The changes in fabric of the natural clay immediately postgross yield are shown in Figures 8a and 8c, which are micrographs showing the fabric on vertical fractures. Gross yield seems to result in extensive rearrangement of the original fabric. In the undisturbed clay (Figures 2 and 3), the alternation of oriented and flocculated fabrics can be distinguished, whereas post-yield the different particle arrangements seem to merge into each other so that their boundaries are ill defined (Figure 8b). At some points rings of domains surround areas of randomly oriented particles, which seem to be the result of a movement of small particles to fill original larger pores. This is seen in Figure 8c, where a chaotic mass of particles is surrounded by a band of stacks in the center of the picture (Figure 8d). It appears that the decrease in void space in the clay post-gross yield is not accompanied by an equivalent increase in particle orientation, as confirmed by the values of the index of fabric orientation, L [15], which do not change significantly.
The fabric of the natural clay compressed to 25 MPa is shown in Figure 9, again investigated through SEM on vertical fractures. Comparison with the fabric just post-gross yield shows that a complex change in structure had taken place with the significant one-dimensional compression. With compression to high σ’v, horizontal bands are observed to form, including well oriented domains, as for a thickening and coalescence of stacks. The considerable compression is likely to complete the weakening of the clay bonding, through the weakening of the calcite binding of the particles, so that at high pressures the bonding is not much stronger than that of the reconstituted clay. It is weakest in the bands of oriented particles, where the particles are in face-to-face contact. On undrained unloading, these bands become location of extension fractures or fissility planes, accordingly, which may be the consequence of likely minor drainage processes occurring at the micro-level. Such an extension fracture is shown in Figure 9a, which is bordered by stacks of particles (as sketched in Figure 9b).
The stacks of well oriented domains are interbedded with
fabric portions of medium oriented to honeycomb fabric, which
can be quite open, sometimes as open as the random fabric in the
undisturbed clay before compression (e.g. Figure 3a). This can be
seen above and below the central stack in Figure 9, which also
includes the extension fracture, and, at higher magnification, in
Figure 9c. Thus, the compression of the natural clay does increase
the orientation of the fabric, but only to a limited extent, since areas
of flocculated fabric are either preserved since the in situ state,
or are created during compression. This is confirmed by image
processing on medium magnification micrographs [12], since
values of L [15] in the range 0.24 The fabric change determined by the one-dimensional
compression of the clay is highly non-uniform. Where the gross
yielding results in some fabric rearrangement, post-gross yield the
one-dimensional compression gives rise to a regular alternation
of stacks and flocculated-honeycomb fabric. This type of fabric
has been frequently observed in one-dimensionally compressed
natural and reconstituted clays [28], supporting the idea that, in
general, one-dimensional compression does not simply induce
orientation of the clay particles, that brings about the increase in
thickness of the stacks, or the generation of new ones, but also gives
rise to a complex arrangement of perfectly oriented fabric portions
and non-oriented fabric portions which, on the whole, at medium
magnification represent a medium scale oriented fabric (micro-
REV of size about 10-3 mmM3; [12]). The honeycomb fabric (Figure 9c) is likely to form a quite stiff
material portion, which resists to compression despite its openness,
presumably as result of the magnitude of the electrostatic and
electromagnetic forces acting at the edge-to-face contacts between
the particle domains. Such an arrangement provides structural
equilibrium with minimum deformation. The development of this
fabric in the natural clay post-gross yield, when the clay is still at
a void ratio higher than that of the reconstituted clay, but with a
bonding weaker than that pre-gross yield, is probably the reason
why the natural clay can retain a higher void ratio and strength than
the reconstituted clay, also at high pressures, and it does not ever
reach the same state e-σ’v as that of the reconstituted clay. The changes in bond strength of the natural clay can be
investigated through the measurement of the clay swell sensitivity
[29], i.e. the ratio of the swelling index of the reconstituted clay,
Cs*, to that of the natural clay, Cs (Figure 5). This equals 2.5 for
the undisturbed natural clay, but reduces significantly with gross
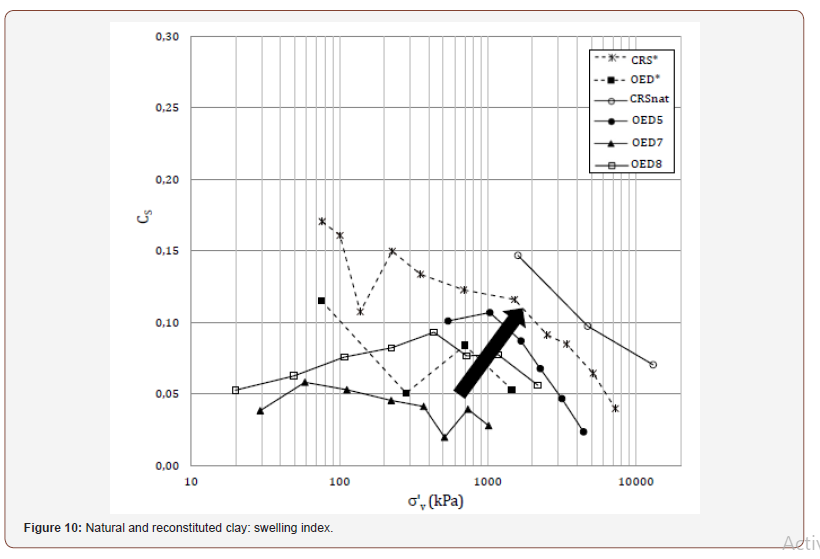
yielding. In Figure 10, the values of both Cs and Cs* measured at
each unloading stage of the oedometer tests shown in Figure 5 are
plotted. For the natural clay Cs is close to constant on the single
swelling line both pre-gross yield (OED7) and immediately postgross
yield (OED8). It becomes not constant, but increases as the
stresses are reduced, after larger post-gross yield compression,
that is with the loss of the unstable part of the clay bonding (OED5
and CRSnat). Similarly, also Cs* is seen to be not constant during
swelling in both tests OED* and CRS*. With increasing consolidation
pressure (indicated by the arrow in Figure 10), the average values
of both Cs and Cs* for each swelling line are also seen to increase.
However, for the natural clay, the maximum rate of increase of Cs
occurs at about gross yield, so that a further increase of 400 kPa
beyond gross yield (unloading OED8) is enough to reduce the swell
sensitivity of the clay from 2.5 to unity. It thus appears that pre-gross yield the swelling properties
of the natural clay differ from those of the reconstituted, being
affected by elements of the clay bonding which are unstable and are
lost over gross yielding. Thereafter, the swelling properties of the
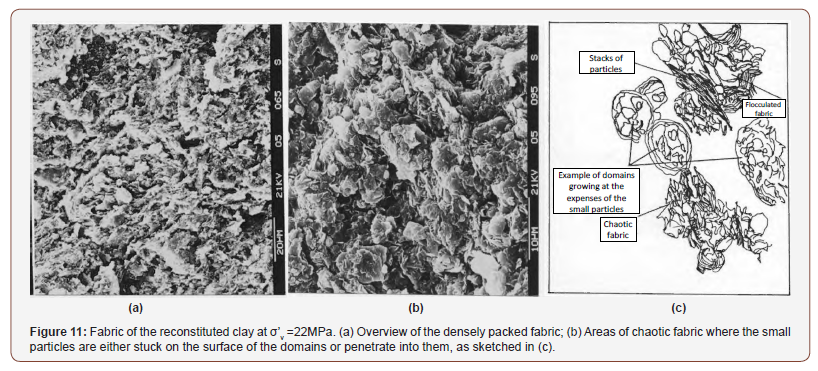
natural clay become similar to those of the reconstituted. The reconstituted clay fabric after compression to high stresses
(point H*, Figure 5) is shown in Figure 11, again for a vertical
fracture through the clay. The size of the stacks has increased
with compression, but they are considerably distorted, and merge
with areas of random aggregation (Figure 11a). The smaller clay
particles either form random fabric, or are stuck onto the large
domains (Figures 11b and c). Nonetheless, the average degree of orientation at point H*
(Figure 5) is about that at A*, since L values about 0.24 are recorded
at medium magnification (medium scale; [12]). One-dimensional compression of the reconstituted clay
increases the level of fabric orientation to a limited extent. More
oriented fabrics have been observed with normal consolidation to
medium pressures of reconstituted monomineralic clays, such as
kaolin [30]. As discussed above, both the natural and the reconstituted
clay undergo major structural changes with one- dimensional
compression to high pressures, but they retain different structures
at all stages of loading. Furthermore, it has been shown that the
natural clay microstructure suffers from more complex and
intense changes in fabric arrangement with compression, than
the corresponding reconstituted clay, since the additional bonding
initially present in the natural clay is lost over compression postgross
yield. It has been shown how such bonding degradation
impacts significantly the swelling parameter, Cs, of the clay, which
controls the reversible part of the clay volumetric straining upon
unloading. In the following, the effects of the major microstructural
changes taking place with compression in the natural clay, on
other clay parameters, of reference in the prediction of either
the mechanical, or the hydraulic response of the natural clay, are
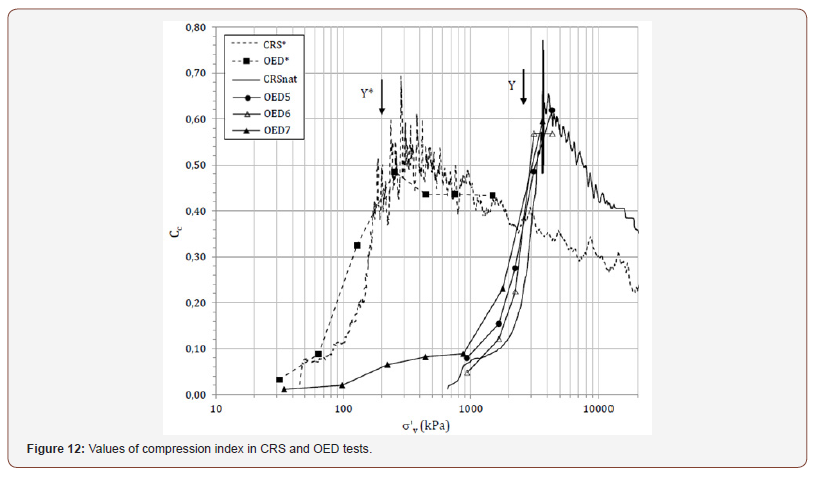
presented. The values of the compression index Cc (=-δe/δlogσ’v) for the
natural clay, or Cc* for the reconstituted, recorded during both the
CRS and the OED tests in Figure 5 are plotted against σ’v in Figure
12. Although the values of the compression index of the two clays
differ at the same value of σ’v, the patterns of variation of Cc and
Cc* with σ’v are similar, especially with respect to gross yielding
(Y, Y*). The compression index initially increases over the stress
range which includes σ’y, and, thereafter, it is initially constant and
starts decreasing thereafter. Yield seems to correspond to the point
of contraflexure in the portion of the curve where either Cc or Cc*
increase. Post-gross yield, Cc is constant up to pressures about 2.2σ’y
for the reconstituted and 3σ’y for the natural clay. These constant
values of Cc are the consequence of the approximately straight state
path post-gross yield in the e-logσ’v plane. However, the maximum value of Cc reached by the reconstituted
clay, about 0.5, is lower than that of the natural clay, which is about
0.6. The undisturbed clay has a stiffer microstructure than the
reconstituted clay, which is responsible for its gross-yielding at
higher pressure and for higher void ratios (at the same σ’v), but the
bonding degradation occurring post-gross-yield causes the higher
compression index of the natural clay. Although this difference
in the macro-response of the natural clay with respect to the
reconstituted had been already documented at the macro-scale in
the literature [1,6], micro-scale investigation of both the natural
and the reconstituted clay and comparison of their microstructures,
here discussed after compression up to very large pressures, has
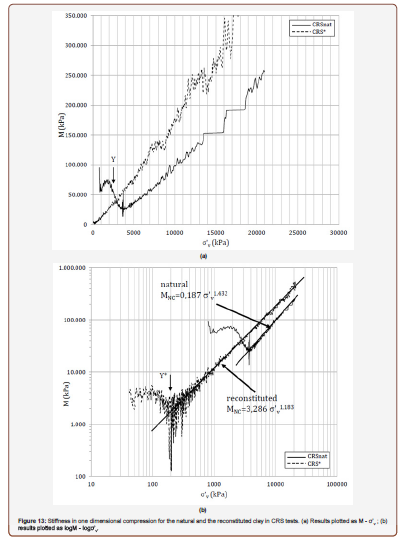
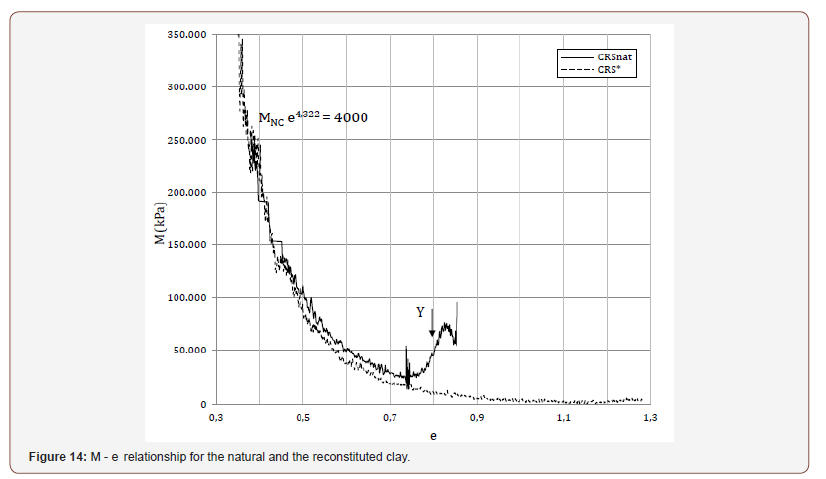
been seldom carried out in the literature [31-33]. The values of the one-dimensional stiffness M (=dσ’v/dεv)
resulting from CRS tests on both the natural and the reconstituted
clay are plotted against σ’v in Figure 13a, and as logM - logσ’v in
Figure 13b. The main difference between the plots is in the initial
stiffnesses, which for the natural clay is at a maximum value at the
start of the test, and decreases thereafter, reaching a constant value
of about 80 MPa. With the reconstituted clay (and generally with
soft natural clays), M increases during the early stages of loading
to reach a maximum value just pre-gross yield. The initial high
stiffness of the natural clay reflects the intact bonding at this stage
of loading, which reduces as compression commences, resulting in
an immediate fall in stiffness. Except for the initial part of the M-σ’v plot, the variation of
stiffness with σ’v follows a qualitatively similar trend for both the
natural and the reconstituted clay, since gross yield occurs midway
between the early, constant value and the minimum value of M,
as observed by Janbu & Senneset (1979) [34]. This is best seen in
Figure 13b, where the same data are plotted in log-log form. With
post-gross yield compression, M increases again, and the stiffness
of the reconstituted clay increases above that of the natural clay.
The post-gross yield values of M vary exponentially with σ’v with
both clays, as shown by the MNC – σ’v relationships in Figure 13b. The values of the coefficient and exponent differ in these
relationships as result of the horizontal transposition of the
compression curve of the natural clay compared to the reconstituted.
This is shown by the M - e plot in Figure 14, where the post-gross
yield stiffness (MNC) is the same for both the natural and the
reconstituted clay at the same void ratio e, given by the expression: MNC e4.322=4000 The coefficient of consolidation (cv) of both the natural and
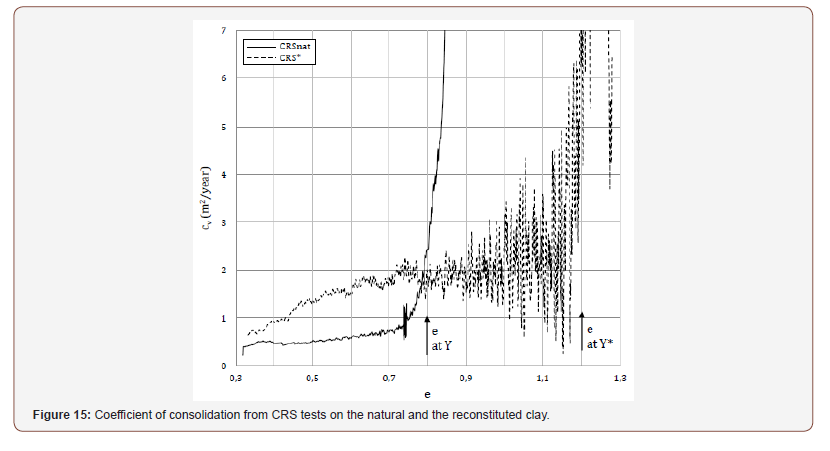
the reconstituted clay is plotted against void ratio in Figure 15. As
with the values of M, the values of cv of the natural clay at the start
of compression are quite high, about 10 m2/year, but quickly fall,
with a contraflexure at about the gross yield state (Figure 15). In
contrast, the values of cv for the reconstituted clay first increase to
a maximum, then reduce with a contraflexure at gross yield. Both
clays reach their minimum values of cv post-gross yield. Thereafter,
while the natural clay shows an almost constant value of cv, the
reconstituted clay exhibits an increase in cv later reducing and
reaching a minimum at high pressures. Thus, post-gross yield, the
two clays possess similar stiffnesses at the same void ratio, but have
slightly different coefficients of consolidation and different e – σ’v
states. Gross yield results in a significant drop in the coefficient of
consolidation of the natural clay, which reaches the low value of
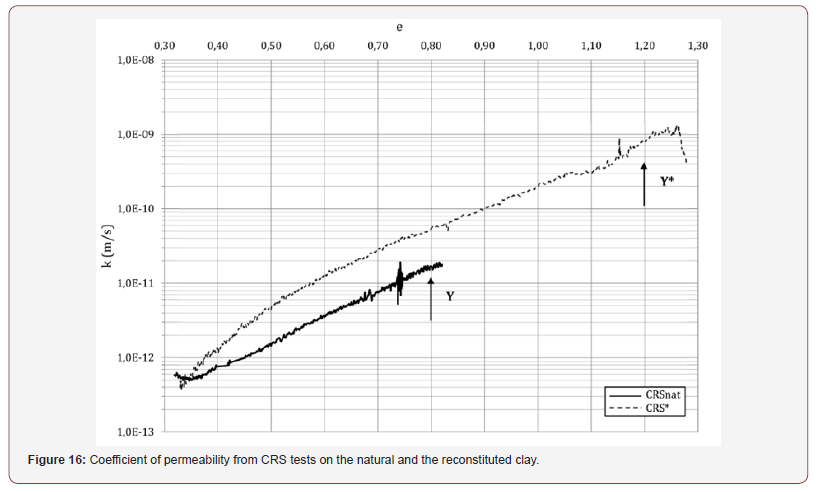
about 0.7 m2/year. Figure 16 shows the values of the coefficient of permeability
k corresponding to the previously discussed values of M and cv. It
can be seen that the permeability of the undisturbed natural clay is
about 2•10-11 m/s, slightly lower than the value (6•10-11 m/s) for
the normally consolidated reconstituted clay at the same void ratio.
The similarly low permeability of both natural and reconstituted
clay suggest that the presence of the amorphous calcite coating
the particles and filling part of the pores in the undisturbed clay is
not an important cause of the low value of k, recorded also for the
reconstituted clay and likely to be the consequence of the significant
smectite content (Table 1). The post-gross yield logk – e curve for the natural clay is linear,
and its equation is: k = 10(-10.9+0.3e) whereas the reconstituted clay exhibits a smoothly convex
downward curve, converging with the logk - e curve of the natural
clay at a void ratio of about 0.35. Thus, at low void ratios the two
clays have different states in the e – σ’v plane, different fabrics, but
almost the same permeability of 5•10-13 m/s (which is close to the
permeability of concrete). Noticeably, an approximately constant value of the coefficient
of permeability of both the natural and the reconstituted clay
is observed pre-gross yield (Figure 16). Hence, gross yield
corresponds to the portion of the logk – e curve where k changes
from a constant to a reducing value. With post-gross yield compression the value of k of the natural
clay drops exponentially by almost two orders of magnitude
as e reduces from 0.80 to 0.35, while the clay stiffness increases
hyperbolically. Similar changes in properties apply to the
reconstituted clay. For both the clays these mechanical changes
reflect the microstructural changes occurring during post-gross
yield compression, which have been discussed previously. The combination of the SEM and microprobe analyses of both
natural and reconstituted Pappadai clay shows the differences in
microstructure developed by the two clays as result of their different
geological and stress histories. With both the clays one-dimensional
consolidation gives rise to well oriented medium magnification
fabrics, though both are non-uniform, composed of stacks and
flocculated aggregates, the consequence of the compaction of
original book house fabrics. However, the structure of the natural
clay is far more complex than that of the reconstituted, the major
differences being related to the diagenesis of the natural clay. This
resulted in both carbonate bonding of the clay particles and also a
locally chaotic clay fabric. The differences in microstructure are shown to result in
different locations for the gross yield states of the two materials
in one-dimensional compression. The diagenetic features of the
natural clay result in an increase of the gross yield stress, and so
give rise to an important additional component of the mechanical
properties of the soil, which cause an amplification of the size of
the natural SBS with respect to the reconstituted clay. Hence, the
natural clay is a material intermediate between an uncemented clay and a mudstone. Though only a small proportion of the high
carbonate content of the soil contributes to bond the clay particles. Compression at gross yield significantly weakens the clay
bonding, which is partly metastable, since even limited swelling
prior to reloading results in a decrease in the yield pressure and
strength of the natural clay. Despite the weakening of the microstructure of the natural clay
at gross yield, it remains stronger than the reconstituted clay even
at high stresses. Compression post-gross yield gradually destroys the original
clay fabric architecture, resulting in a locally chaotic packing of the
clay particles. With further compression post-gross yield, a more
organized though still non-uniform fabric develops in the natural
clay, and the fabric orientation is seen to increase only to a limited
extent. Similarly, the reconstituted clay fabric does not undergo a
significant increase in fabric orientation even after compression to
very large pressures. Despite their different microstructures, the two clays exhibit
similar patterns of mechanical response to one- dimensional
compression. Similar equations define the variation of clay stiffness
M and the coefficient of permeability k with void ratio and σ’v,
though the magnitude of the response of the two materials differs. The trends of behavior of the natural and the reconstituted
clay here discussed suggest that similar basic mechanisms of
deformation apply to clays of different microstructure, which are
reflected in similarities in their behavioral frameworks. Further research is on-going, including further mechanical
testing and micro-analyses on both the natural and the
reconstituted clay to explore the evolution of their microstructures
both in isotropic compression and under shearing loading paths, at
different states of stress. It is believed that results of the type gathered in the present
work may help to connect further the modelling strategy to the real
material features at the micro-scale, as for example connecting the
model algorithms and their predictions to the effects of changes in
the structural features of the material. The Authors thank the Italian Ministry for Research and
University (PRIN 2015 grant, Prot. 201572YTLA) for supporting
the research. The research activity has been carried out with the contribution
of Fondazione Puglia. No conflict of interest.
Effects of the micro-structural changes on fundamental
parameters of the clay constitutive law
Compression index and stiffness
Coefficients of consolidation and permeability
Conclusion
Acknowledgement
Conflict of Interest
References
- Burland JB (1990) On the compressibility and shear strength of natural soils. Géotechnique 40(3): 329-378.
- Cotecchia F, Chandler RJ (1997) The influence of structure on the pre-failure behaviour of a natural clay. Géotechnique 47(3): 523-544.
- Cotecchia F, Chandler, R J (2000) A general framework for the mechanical behaviour of clays. Géotechnique 50(4): 431-447.
- Skempton AW (1970) The consolidation of clays by gravitational compaction. QJ Geological Soc 125: 373-411.
- Skempton AW, Northey RD (1952) The sensitivity of clays, Géotechnique 3(1): pp 30-53
- Leroueil S, Vaughan, PR (1990) The general and congruent effects of structure in natural soils and weak rocks. Géotechnique 40: 467-488
- Lambe, TW, Whitman RV (1969) Soil Mechanics Wiley, New York.
- Mitchell JK, Soga K (2005) Fundamentals of Soil Behavior (3rd edn), John Wiley & Sons Inc, Hoboken, NJ.
- Cotecchia F, Chandler R J (1995) The geotechnical properties of the Pleistocene clays of the Pappadai valley Quarterly. Journal of Engineering Geology 28: 5-22.
- Cotecchia F, Cafaro F, Guglielmi S (2016) Microstructural changes in clays generated by compression explored by means of SEM and image processing Proc Engng 158: 57-62.
- Guglielmi S, Cotecchia F, Cafaro F, Gens A (2018) Microstructural changes underlying the macro-response of a stiff clay Micro to MACRO mathematical modelling in soil mechanics, trends in mathematics (eds P Giovine, PM Marianoand G Mortara), pp. 89-97.
- Cotecchia F, Guglielmi S, Cafaro F, Gens A (2019) Characterisation of the multi-scale fabric features of high plasticity clays Géotechnique Letters 9: 361-368.
- Hawkins AB, Mc Donald C, (1992) Decalcification and residual shear strength reduction in Fuller's Earth Clay Géotechnique 42(3): 453-464.
- Terzaghi K (1941) Undisturbed clay samples and undisturbed clays J Boston Soc Civ Engng 28: 211-231.
- Martinez Nistal A, Vinale F, Setti, M, Cotecchia F (1999) A scanning electron microscopy image processing method for quantifying fabric orientation of clay geomaterials Appl Clay Sci 14(4): 235-243.
- Sides G, Barden L (1971) The microstructure of dispersed and flocculated samples of kaolinite, illite and montmorillonite. Can Geotech J 8(3): 391-399.
- Cotecchia V, Federico A, Trizzino R (1982) Microtessiture di sedimenti argillosi Analisi delle tipologie e terminologie, applicazioni nel campo della Geotecnica Geologia Applicata e Idrogeologia 17: 1-34.
- Cotecchia F (1996) The effects of structure on the properties of an Italian Pleistocene clay PhD Thesis, University of London
- Wissa AEZ, Christian, JT Davis EH, Heiberg S (1971) Consolidation at constant rate of strain Proc AS/CE, 97 SM10, 1393-1413.
- Chandler RJ, Gutierrez Cf (1986) The filter-paper method of suction measurement Gootechnique 36: 265-268.
- Roscoe KH, Schofield AN and Wroth CP (1958), On the yielding of soils, Géotechnique 8: 22-53.
- Roscoe KH, Burland JB (1968) On the generalized stress-strain behaviour of wet clay, In Engineering Plasticity (J Heymann and FA Leckie, eds), Cambridge University Press, Cambridge, pp. 535-609.
- Al Tabbaa A and Muir Wood D (1989) An experimentally based `bubble' model for clay, in: Numerical models in geomechanics, S Pietruszczak and G N Pande (Eds), Proc 3rd Int Conf on Numerical Methods in Geomechanics, pp. 91-99.
- Rouainia M, Muir Wood D (2000) A kinematic hardening constitutive model for natural clays with loss of structure. Géotechnique 50 (2), pp. 315-321.
- Baudet BA, Stallebrass SE (2004) A constitutive model for structured clays Géotechnique 54(4): 269-278.
- Kavvadas M, Amorosi A (2000) A constitutive model for structured soils. Géotechnique 50(3): 263-273.
- Sfondrini G (1975) Caratteristiche microtessiturali e microstrutturali di alcuni sedimenti argillosi connesse con la natura ed il tipo delle sollecitazioni subite Geologia Applicata e Idrogeologia 10: 300-320
- Schmertmann JH (1969) Swell sensitivity Géotechnique 19(4): 530-533
- Cotecchia V, Federico A, Trizzino R (1982) Microtessiture di sedimenti argillosi Esperimenti su Kaolinite a Bentonite, ed esempi di sedimenti argillosi dell'Italia Meridionale Geologia Applicata e Idrogeologia 17: 53-78.
- Delage P, Lefebvre G (1984) Study of the structure of a sensitive Champlain clay and of its evolution during consolidation. Can GeotechJ 21(1): 21-35
- Delage P (2010), Microstructure approach to the sensitivity and compressibility of some Eastern Canada sensitive clays. Géotechnique 60(5): pp 53-368.
- Hattab M, Hammad T, Fleureau JM, Hicher PY (2013), Behaviour of a sensitive marine sediment: microstructural investigation. Géotechnique 63(1): 71-84.
- Janbu N, Senneset K (1979) Consolidation tests with continuous loading Proc 10th ICSMFE, Stokholm Clay Géotechnique 42: 453-46
-
Federica Cotecchia, Simona Guglielmi, Antonio Gens. Investigation of the Evolution of Clay Microstructure under Different Loading Paths and Impact on Constitutive Modelling. Glob J Eng Sci. 5(1): 2020. GJES.MS.ID.000603.
-
Clays, Clay microstructure, Micro to macro, Microscopy, SEM
-

This work is licensed under a Creative Commons Attribution-NonCommercial 4.0 International License.


