 Research Article
Health and Environmental Impacts of Nox: An Ultra- Low Level of Nox (Oxides of Nitrogen) Achievable with A New Technology
Massimo Onofri1*, Raimondo Alberto Bernabeo2 and Kirk Webster3
1EN8 s.r.l., MEC SYSTEM s.r.l. and Tongji & Bologna University, Ph.D. candidate, Forli, Italy
2University of Abu Dhabi, UAE
3University of Abu Dhabi, UAE
Massimo Onofri, EN8 s.r.l., MEC SYSTEM s.r.l. and Tongji & Bologna University, Ph.D. candidate, Forli, Italy.
Received Date: May 21, 2019; Published Date: May 28, 2019
Abstract
The damages to human health and environment result because of various compounds and derivatives in the family of nitrogen oxides, including nitrogen dioxide, nitric acid, nitrous oxide, nitrates, and nitric oxide. Nitrogen oxides in the atmosphere contribute to photochemical smog, to the formation of acid rain precursors, to the destruction of ozone in the stratosphere and to global warming. On the contrary, an increase in Ozone (O3) concentration related to NOx emissions has been observed analyzing chemical and transport processes in the troposphere. Ozone can be transported by wind currents and can cause health impacts far from original sources. Ground-level Ozone (Smog) is formed when NOx and volatile organic compounds (VOCs) react in the presence of heat and sunlight. Children, people with lung diseases such as asthma, and people who work or exercise outside, are susceptible to adverse effects such as damage to lung tissue and reduction in lung function. Other impacts from ozone include damaged vegetation and reduced crop yields. These O3 concentration changes, combined with geographically specific demographic data have been used to estimate the increase in mortality and respiratory illness that results from that increase in O3. Over the past 150 years, global emissions of nitrogen oxides into the atmosphere have been increasing steadily. A significant amount of the nitrogen oxide emissions is attributed to combustion of biomass and fossil fuels. This paper reviews existing and some emerging technologies for reduction of NOx emissions from combustion sources and examines the prospects of these technologies for meeting stricter emissions regulations. Both combustion modification and post- combustion methods for NOx reduction are considered. The important role of research on the chemistry of nitrogen oxides in combustion gases in development and optimization of emissions control techniques is described.
Keywords:NOx, NOx emissions; Health impacts; Mortality; Point sources; Cap-and-trade
Background
Nitrogen oxides, herein referred to as NOx include nitric oxide and nitrogen dioxide. These oxides result primarily from the combustion of fossil fuels by vehicles and various stationary sources, though they are by products of all combustion-based systems and of all high temperature industrial processes. NO is produced by the combination of elemental nitrogen and oxygen in air within the burner/chamber in which combustion is carried out as a result of the high temperature from the highly exothermic combustion reaction. NO2 is partly produced and emitted with NO, but its origin is mostly due to peroxyl radicals and therefore to the complex oxidation chain fueled in the atmosphere after emission.
NOx is a deleterious air pollutant which can be poisonous at high concentration levels. Nitrogen oxides (NOx) emissions, and in particular NO2 are a known precursor to the formation of ozone and of secondary aerosol largely contributing to PM10 and to PM2.5. NOx therefore is not only criteria pollutant on their own, but they contribute sensibly to other pollutants of major health and environmental concern. In addition, NOx can react with volatile organic compounds to form photo-chemical smog, a phenomenology mainly connected with high temperatures and insolation concerning areas and seasons characterized by mild to hot conditions such as for example the Mediterranean region, at least in the summer season.
power generating stations (Spokoyny, 24 Aug. 1993).
Most recent proposals to achieve further emissions reductions continue to suggest the use of cap-and-trade. Legislative initiatives to tighten the caps have failed primarily because of debate about whether to include controls on emissions of carbon dioxide (CO2). In USA, the Bush administration promulgated the Clean Air Interstate Rule (CAIR) in 2005, intending to use capand- trade to achieve substantial further reductions for only SO2 and NOx (and an accompanying rule aimed at mercury). It also introduced an annual NOx cap while preserving as a separate market the five-month seasonal NOx program, but with the latter expanded to a larger region. CAIR aimed to limit emissions in 25 states for SO2 and annual NOx emissions, with the justification of controlling particulates, and a slightly different 25-state region for controlling summer- season NOx emissions with the intent of controlling ozone. In total, 28 states are affected by CAIR. Implementation of the CAIR rule was tangled up in the courts, but is again proceeding, even as the rule has been remanded to the Environmental Protection Agency (EPA) for revision.
Where Does the NOx Come From?
NOx is produced from the reaction of nitrogen and oxygen gases in the air during combustion, especially at high temperatures. In areas of high motor vehicle traffic, such as in large cities, the amount of nitrogen oxides emitted into the atmosphere as air pollution can be significant. NOx gases are formed whenever combustion occurs in the presence of nitrogen – e.g. in car engines; they are also produced naturally by lightning.
The majority of NOx emissions come from two major areas of human activity [1] (Figure 1):
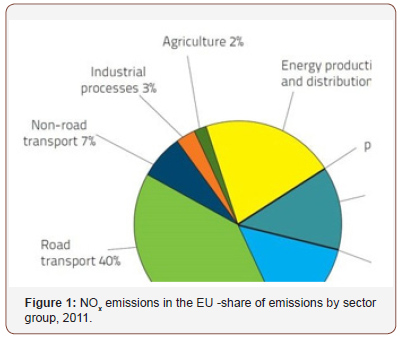
{[1] http://www.icopal-noxite.co.uk/nox-problem/noxpollution. aspx
Source - European Union emission inventory report 1990– 2011 under the UNECE Convention on Long-range Trans-boundary Air Pollution (LRTAP)}
• Traffic: 40%
• Industrial Energy Use and Energy Production/ Distribution: 34%
The move from traditional combustion-based energy generation to wind and solar exerts a positive effect on the total emissions from the Energy Generation Sector, but this still remains a minor generation capacity; therefore, combustion of fuels will remain with us for some time to come.
Traffic remains and will remain the largest single source of NOx pollution until the combustion engine is phased out and electric cars become the norm. The recent scandal concerning emission level cheating by leading car companies has highlighted this issue but the real challenge is the total volume of traffic on the roads and the fact that although the latest emission standards for automobiles might be improving, the NOx situation, it is far from being eliminated, unless using pure oxygen as the oxidizer.
Formation of (thermal) NO proceeds mainly by combination of atmospheric N2 with dioxygen at high Temperature:
N2 + O2 2 NO, though the main mechanisms are the following:

A small fraction of nitrogen occurring in fuel may yield a correspondingly negligible amount of “fuel” NO
Sources are mainly:
• motor vehicles
• fossil fuel, power plants
Control of NOx must focus on lowering combustion Temperatures through
• exhaust gas recirculation,
• increase fuel/air mix (increase hydrocarbons)
Or it may be achieved through catalytic heterogeneous processes promoting reduction of NOx to N2.
Effect is restricting the growth of industry within their own regions in an attempt to minimize their local NOx problems.
Comparison What Does < 1ppm NOx Mean?
A content of 1ppm of NOx does not really mean anything until it is put into a context. This begins to be understandable when we look at how much the amount of NOx is avoided when the Ener-Core technology is employed rather than traditional combustion technology.
What is the real effect of this capability? How does this translate into impact in the real world?
Let’s begin by looking at the amounts of NOx that are typically emitted by traditional combustion-based technology (assuming it is running 95% of the time at 100% load) [2] (Table 1):
{[2] Assumption: Gas Turbine Exhaust: 53600 Nm3/h, Gas Engine Exhaust 13750 Nm3/h, both corrected to dry exhaust at 15% O2}
Table 1:

*Limits set by EU for 2017 onwards
** <1ppm NOx is not a limit but achievable NOx level.
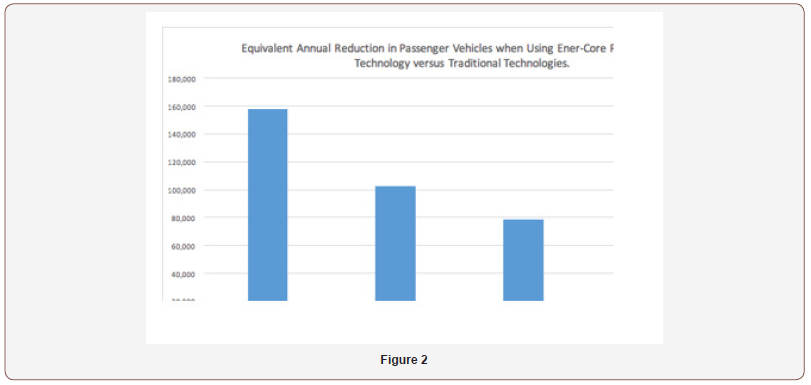
Comparing the annual amounts of NOx produced by such systems to the number of Passenger Vehicles producing the same total amounts of NOx in the UK makes these numbers a little more understandable (Figure 2):
Assuming that the new EURO 6 limits are in effect on all cars (diesel and gas (petrol) based) then the average passenger vehicle emits 0.344 kg/year of NOx, then the equivalent number of passenger vehicles are (Table 2):
Table 2:
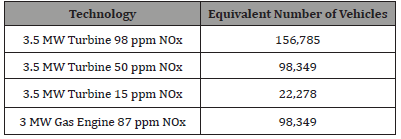
To put this into even greater perspective these numbers of vehicles can be compared to the estimated number of vehicles in several major cities within Europe [3].
{[3] Estimations based on populations of the individual cities and the average number of vehicles per person for the country in question.
Statistics 2011 except France: 2012 http://ec.europa. eu/eurostat/statistics- explained/index.php/File: New_ passenger_cars_by_type_of_engine_fuel, _2013.png http://www. dutchdailynews.com/8-million-cars/
Population Data: Google. http://appsso.eurostat.ec.europa.eu/ nui/show.do}
This shows that the decision to replace an existing system at the 3-3.5 MW size, results in the equivalent reduction of total NOx emissions of over 150,000 passenger vehicles, which is more that the total number of vehicles owned within the cities of Oxford or York in the UK, and is approximately 50% of the passenger vehicles owned by the inhabitants of Bonn in Germany.
Human Harm and the Costs Associated with Nox Pollution
Considering the amount of exhaust gas that a 3.5 MW generation system makes (approximately 50,000 Nm3/h for a gas turbine or 15,000 NM3/h for a gas engine working at the limit of the proposed legislation, the gas engine would appear to be the better choice in terms of the total amount of NOx produced per day (assuming that they were emitting the proposed limits) [4-9] (Table 3).
Table 3: Total mass of NOx emitted per day

This does not seem to be a large amount, but we need to consider how this translates to a concentration of NOx in the local atmosphere. According to the EPA in the US, there are several important concentrations levels that need to be considered:
• Warning Level = 0.6 ppm NOx (1.22 mg/m3)
• Emergency Level = 1.2 ppm NOx (2.43 mg/m3)
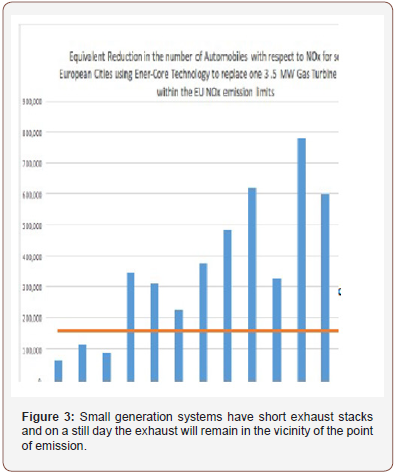
Table 4: Volume of the NOx cloud on a wind-still day.
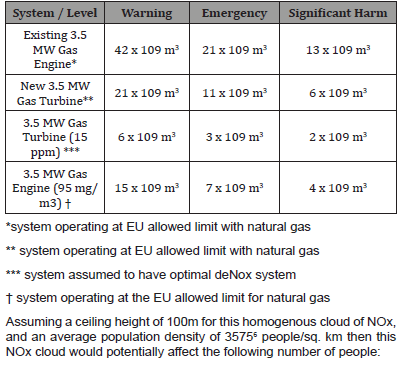
*system operating at EU allowed limit with natural gas
** system operating at EU allowed limit with natural gas
*** system assumed to have optimal deNox system
† system operating at the EU allowed limit for natural gas
Assuming a ceiling height of 100m for this homogenous cloud of NOx, and an average population density of 35756 people/sq. km then this NOx cloud would potentially affect the following number of people:
• Significant Human Harm = 2ppm NOx (4.05 mg/m3) Assuming a day of zero wind (wind-still), so that there is minimal air mixing, that the NOx is diluted to a homogeneous level 4, and that there is zero NOx in the atmosphere to begin with, then the amounts of NOx in the table above are sufficient to generate the following volumes of NOx/air mixture (Table 4)(Figure 3):
• Assuming a ceiling height of 100m for this homogenous cloud of NOx, and an average population density of 3575 [6] people/sq. km then this NOx cloud would potentially affect the following number of people (Table 5) (Figure 4):
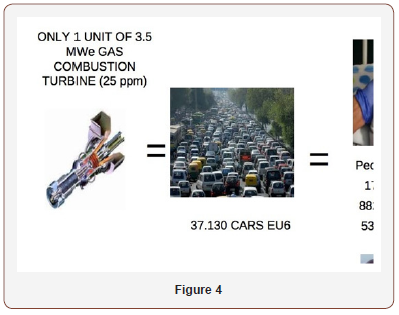
Table 5: Total mass of NOx emitted per day.
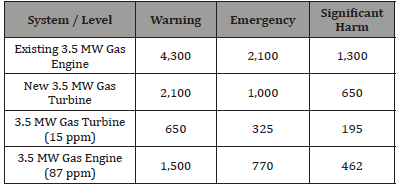
Potential Number of People Affected [7]
Given that in London in 2010, short term exposure to the effects of NOx was associated with 420 hospital admissions for respiratory disorders the potential cumulative effect of these pollutants - regardless of their source, are clearly having an impact on local populations, and the potential detrimental health effects of individual small and medium scale power [10- 13].
4. Population and city surface areas taken for Los Angeles, New York City, Dallas, Paris, Moscow, Rome, London, Berlin, Washington DC, Buenos Aires, Milan.
5. Population and city surface areas taken for Los Angeles, New York City, Dallas, Paris, Moscow, Rome, London, Berlin, Washington DC, Buenos Aires, Milan.
6. Ref.: World Health Organization (2013). Review of evidence on health aspects of air pollution generation systems placed within or near major conurbations could be significant. This is very concerning if these power generation systems are close to hospitals or schools where the effect of the pollution is magnified.
It is therefore hardly surprising that many cities within Europe are limiting the installation of new generation capacity, even though these new systems would conform to the requirements of the EU with regard to NOx emission levels [14- 18]. In California (USA), the local state regulations have gone further and taken the step of limiting not only the concentration of NOx in the exhaust plumes of industrial facilities, but also placing an annual cap for the total mass of NOx emitted.
However, the approach to limiting NOx in this way is a two-edged sword. Its intention is to reduce or limit pollution effects, but at the same time it makes the growth of businesses more difficult, potentially preventing a company expanding or investing in newer more efficient production processes. As a result, potential jobs are not created, or are created elsewhere, and existing jobs may even be put at danger.
Is there a solution to this challenge for the local governments and the businesses that are located within their communities? Can the requirements of commerce and industry to generate power and heat be fulfilled without generating NOx? Thanks to Ener-Core it is now possible.
Application of the Ener-Core Power Oxidizer Methodology
The Ener-Core Power Oxidizer replaces traditional combustion chambers within gas turbines and represents a significant new component within the integrated KG2 gas turbine [19,20]. The Dresser-Rand business and Ener-Core engineering teams have worked collaboratively on this effort for 18 months and are nearing completion of an extensive testing regime that covers component-specific testing as well as a full integration test.
The Power Oxidizer and all other system components from the KG2 gas turbine have surpassed some of the most challenging integration hurdles. The test system has performed very close to the required system specifications; the engineering teams from both companies have identified a few additional integration tasks that are expected to further improve the overall system performance [21-30]. These remaining integration tasks are typical within the final testing phase of this sort of technology integration project and the teams expect to implement these remaining improvements before the end of the calendar year.
Conclusion
NOx has been identified as one of the key pollutants that has been liked to serious health issues and is strongly believed to be a contributing factor in a significant number of premature deaths. As such it has become a major focus of the EU and the USA environmental agencies to reduce these emissions from a perspective of cost reduction in the health sector, as well as (and more importantly) to combat the negative health effects on the population at large. As NOx emissions are largely a by- product of combustion, which until recently has been the only way that industry could generate local heat and power, governments are faced with the dilemma that capping the total levels of NOx emissions on a tons/year basis means that they are also in danger of limiting the growth potential and competitiveness of that very industry within their region [31-34]. Thankfully that is no longer the case. The Gordian Knot of NOx emissions has found its Damocles Sword. The technology from Ener-Core allows distributed power and heat production, often with fuels that other systems could not even use, with near zero NOx emissions.
Acknowledgement
None.
Conflict of Interest
No conflict of interest.
References
- Abt Associates (2004) User’s Manual for the National Co-Benefits Risk Assessment Model, Beta Version 2.0., Bethesda, MD: US EPA State and Local Capacity Building Branch.
- Alm S, Jantunen MJ, Vartiainen M (1999) Urban commuter exposure to particle matter and carbon monoxide inside an automobile. J Expo Anal Environ Epidemiol 9: 237-244.
- Cocker DRI, Shah SD, Johnson KC, Zhu X, Miller JW, et al. (2004) Development and application of a mobile laboratory for measuring emissions from diesel engines. 2. Sampling for toxics and particulate matter. Environ Sci Technol 38: 6809-6816.
- (2010) Committee on Health Environmental and Other External Costs and Benefits of Energy Production and Consumption: Hidden Costs of Energy: Unpriced Consequences of Energy Production and Use. Washington, DC: National Academies Press.
- Fann N, Fulcher CM, Hubbell BJ (2009) The influence of location, source, and emission type in estimates of the human health benefits of reducing a ton of air pollution. Air Qual Atmos Health 2: 169-176.
- Frey C, Rouphail N, Unal A, Colyar J (2001) Emissions reduction through better traffic management: An empirical evaluation based upon onroad measurements. US Department of Transportation and the North Carolina Department of Transportation.
- Graham DJ, Glaister S (2004) Road traffic demand elasticisty estimates: A review. Transport Rev 24: 261-274.
- Greco SL, Wilson AM, Spengler JD, Levy JI (2007) Spatial patterns of mobile source particulate matter emissions-to-exposure relationships across the United States. Atmos Environ 41: 1011-1025.
- (2009) HEI Panel on the Health Effects of Traffic-Related Air Pollution: Traffic-Related Air Pollution: A Critical Review of the Literature on Emissions, Exposure, and Health Effects. Boston, MA: Health Effects Institute.
- Homburger W, Kell J, Perkins D (1992) Fundamentals of Traffic Engineering. University of California, Berkeley, 13.
- Industrial Economics (2006) Expanded expert judgment assessment of the concentration-response relationship between PM2.5 exposure and mortality. Cambridge, MA: Prepared for Office of Air Quality Planning and Standards, US Environmental Protection Agency
- Krewski D, Jerrett M, Burnett RT, Ma R, Hughes E, Shi Y, Turner MC, Pope CA, Thurston G, Calle EE, Thun MJ, Beckerman B, DeLuca P, Finkelstein N, Ito K, Moore DK, Newbold KB, Ramsay T, Ross Z, Shin H, Tempalski B:
- Laden F, Schwartz J, Speizer FE, Dockery DW (2006) Reduction in fine particulate air pollution and mortality: Extended follow-up of the Harvard Six Cities study. Am J Respir Crit Care Med 173: 667-672
- Lee S, Liu W, Wang YH, Russell AG, Edgerton ES, et al. (2008) Source apportionment of PM2.5: Comparing PMF and CMB results for four ambient monitoring sites in the southeastern United States. Atmos Environ 42: 4126-4137.
- Levy JI, Wolff SK, Evans JS (2002) A regression-based approach for estimating primary and secondary particulate matter intake fractions. Risk Anal 22: 895-904.
- Levy JI, Greco SL, Melly SJ, Mukhi N (2009) Evaluating efficiency-equality tradeoffs for mobile source control strategies in an urban area. Risk Anal 29: 34-47.
- Muller NZ, Mendelsohn R (2007) Measuring the damages of air pollution in the United States. J Environ Econ Manage 54: 1-14.
- Noland RB, Lem LL (2002) A review of the evidence for induced travel and changes in transportation and environmental policy in the US and the UK. Transport Res Part D 7: 1-26.
- Noland RB, Cowart WA (2000) Analysis of metropolitan highway capacity and the growth in vehicle miles of travel. Transport 27: 363- 390.
- Noland RB (2001) Relationships between highway capacity and induced vehicle travel. Transport Res Part A 35: 47-72.
- Noland RB, Quddus MA (2006) Flow improvements and vehicle emissions: Effects of trip generation and emission control technology. Transport Res Part D 11: 1-14.
- Polzin S, Chu X, Mc Guckin N (2007) Long-range personal VMT forecasting scenario tool. Center for Urban Transportation Research (CUTR).
- Pope CA, Burnett RT, Thun MJ, Calle EE, Krewski D, et al. (2002) Lung cancer, cardiopulmonary mortality, and long-term exposure to fine particulate air pollution. JAMA 287: 1132-1141.
- Riediker M, Williams R, Devlin R, Griggs T, Bromberg P, et al. (2003) Exposure to particulate matter, volatile organic compounds, and other air pollutants inside patrol cars. Environ Sci Technol 37: 2084-2093.
- Schrank D, Lomax T (2007) The 2007 Urban Mobility Report. Texas Transportation Institute.
- Schwartz J, Coull B, Laden F, Ryan L (2008) The effect of dose and timing of dose on the association between airborne particles and survival. Environmental Health Perspect 116: 64-69.
- Shah SD, Johnson KC, Miller JW, Cocker DRI (2006) Emission rates of regulated pollutants from on-road heavy-duty diesel vehicles. Atmos Environ 40: 147-153.
- Shah SD, Cocker DRI, Miller JW, Norbeck JM (2004) Emission rates of particulate matter and elemental and organic carbon from in-use diesel engines. Environ Sci Technol 38: 2544-2550.
- US Environmental Protection Agency: MOBILE6 Vehicle Emissions Modeling Software.
- US Environmental Protection Agency: 2006 National Ambient Air Quality Standards for Particle Pollution. 2006, Washington, DC: US Environmental Protection Agency.
- (1999) US Environmental Protection Agency: Regulatory Impact Analysis - Control of Air Pollution from New Motor Vehicles: Tier 2 Motor Vehicle Emissions Standards and Gasoline Sulfur Control Requirements. Washington, DC: Office of Air and Radiation.
- (2005) US Environmental Protection Agency: Regulatory Impact Analysis for the Final Clean Air Interstate Rule. Washington, DC: Office of Air and Radiation.
- US Environmental Protection Agency: MOVES: Motor Vehicle Emission Simulator.
- (2009) Victoria Transport Policy Institute: Transportation Cost and Benefit Analysis: Techniques, Estimates and Implications. Victoria, BC, Canada.
-
Massimo Onofri, Raimondo Alberto Bernabeo, Kirk Webster. Health and Environmental Impacts of Nox: An Ultra-Low Level of Nox (Oxides of Nitrogen) Achievable with A New Technology. Glob J Eng Sci. 2(3): 2019. GJES.MS.ID.000540.
-
NOx, NOx emissions, Health impacts, Mortality, Point sources, Cap-and-trade
-

This work is licensed under a Creative Commons Attribution-NonCommercial 4.0 International License.


