 Mini Review
Disturbances of Ozone Layer and Radio Wave Absorption in D-Region of Ionosphere of the Earth During Solar Proton Event: Simulations with СHARM-I Model
Alexei Krivolutsky* and Anna Kukoleva
Laboratory for Atmospheric Chemistry and Dynamics, Central Aerological Observatory, Pervomayskata Dolgoprudny Moscow Region, Russia.
Alexei Krivolutsky, Laboratory for Atmospheric Chemistry and Dynamics, Central Aerological Observatory, Pervomayskata Dolgoprudny, Moscow Region, Russia.
Received Date: July 16, 2021; Published Date: July 27, 2021
Introduction
As it is well known [1], the high-energy solar particles (mainly solar protons), with an energy of several to 500 MeV, enter into the Earth’s stratosphere and mesosphere only in polar regions. For the first time the sharp decrease of the ozone and ion content in e stratosphere was detected on board the American Nimbus-4 satellite in course of one of the strongest flares on the Sun (August 4, 1972) [2]. As the theoretical analysis has shown, the highenergy particles intrusion in polar atmosphere produced oxides of nitrogen (NOx), hydrogen (HOx), and some ions, which destroy ozone in catalytic chemical cycles and increases electron density in polar region. Important steps were made with satellite missions NASA UARS (with HALOE instrument) and European ENVISAT (with MIPAS instrument). Basing on the ENVISAT measurements of ozone and other small gas components, the international project HEPPA (High Energy Particle Precipitation in the Atmosphere) was arranged [3]. This project involved 10 research groups including Russian teams from the Central Aerological Observatory (CAO, Moscow). As a result, the model computations were fulfilled which have demonstrated the well correspondence with data of satellite measurements during the solar flare in October 2003.
In this work we used global 3D numerical photochemical model CHARM-I (Chemical Atmospheric Research Model with Ions) [4] and satellite observations of solar proton fluxes to investigate the response of neutral and ion composition to strong SPEs of July14 2000 and October28 2003.We should mention that changes in D-region of ionosphere induced by solar particles should leads to the changes in radio wave absorption in polar region.
CHARM-I Model Short Description
Neutral chemical compounds
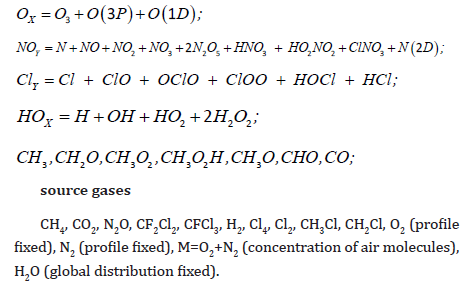
To describe the global photochemical processes taking place in the Earth’s atmosphere, the numerical Chemical Atmospheric Research Model with Ions (CHARM-I) was elaborated in the Laboratory of Atmospheric Chemistry and Dynamics of CAO. The CHARM-I model used the “splitting method” that makes it possible to describe independently processes of advective transport and photochemical processes. Ions are calculated under suppose that the sum of ions is zero. One of the most accurate methods, the Prater’s method, is applied to describe the transfer processes. The corresponding velocity components were calculated using the general circulation model [5]. The method of” chemical families”, proposed in the work [6], was used while integrating this system with equations of chemical kinetics, which belongs to the so-called “rigid systems”. The “rigidity” of systems of the chemical kinetics equations is manifested in this case in a large range of values of the characteristic “lifetimes” of chemical components (from fractions of a second to hundreds of years), which would require very small time steps of integration. The method of “families” makes it possible to significantly remove the “rigidity” of the system and considerably increase the time step. The photochemical block of the model describes the interaction between the 41st chemical components involved in 127 photochemical reactions. The following chemical components were calculated in the model: included in the chemical “families”

source gases

The vertical profile of molecular oxygen in the calculations was fixed. Also, the global (two-dimensional) distribution of water vapor, based on observations from the UARS satellite (HALOE instrument), was not changed. The time step of integrating the model varied from 100 to 500 s. The dissociation rates were recalculated after 1 h of the model time, which allowed us to correctly describe the daily course of solar radiation over a fixed point. The lower boundary of the model is at ground level, the upper boundary is at an altitude of 88 km, the height step in the model is 2 km, the resolution in latitude is 5°, and in longitude is 10°. The initial distributions of all Minor Gas Species (MGS) were taken from a one-dimensional photochemical model [5]. When describing the chemistry of the troposphere, the processes of “leaching” in clouds for some components (H2O2, HNO3, HCl, HNO4) were considered in parametric form. Heterogeneous reactions on the surface of aerosol particles were not considered. The model demonstrated computational stability when integrated over several model years and an ozone distribution consistent with observations and those obtained from other models.
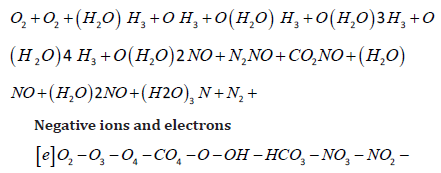
Ion composition
Corresponding list of ionized compounds looks like as follow:

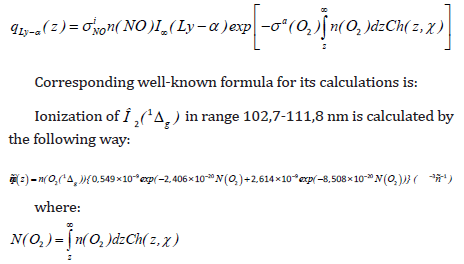
Joint number of photochemical reactions including the reaction of ionization in the model equals 242. Ionization of NO is initiated by short UV (L-α).

Ionization by galactic cosmic rays is also took into account (parameterization is used).
Dissociation rates by UV are recalculated after each hour of integration in the model. The greed looks like as follow: vertical – 2 km; latitude - 50; longitude - 100. Time-step of integration is in range: 100-500 sec. To describe the global transport of chemical species Prather’s scheme was used [7]. Global 3D of wind components and temperature fields has been calculated with Middle Atmosphere GCM ARM [5].
We present the results below, which illustrate global distribution of ozone (as the example of neutral species) and electron density. Then the response of ozone and of lower ionosphere to SPEs will be shown.
Solar proton events
Figure 1 shows daily mean variability of solar proton fluxes (GOES data), which were used for ionization rates calculations [8].
Each pair of ions produced by particles gives additional NOX, HOX species and ions.
Figure 2 shows the efficiency of such production.
Response of ionosphere and ozonosphere
Let us consider the effects of the solar proton intrusion on ozone in the polar atmosphere region on example of one of the most powerful proton flares on July 14, 2000 (Bastille Day Event). It should be noted that the SPE considered on July 14, 2000 occurred when the Southern and Northern polar regions were in different conditions of illumination by the Sun (polar night over the south pole and polar day over the north pole). Therefore, the difference in their chemical response is of especial interest. To calculate the particle ionization rates, the data from the GOES-10 satellite in various (integral) energy channels (>5, >10, >30, >50, >100, >370, >480, >640 MeV) were used. Then the corresponding differential spectra were calculated. The field of the calculated ionization velocity at each time was localized between the geomagnetic pole and latitude 660 for each hemisphere. This field was thought to be isotropic inside the polar cap. Each pair of ions formed during the deceleration of solar protons in the atmosphere leads to the formation of 1.25 nitrogen atoms and 2.0 OH radical molecules, as well as 1.15 oxygen atoms.
Figure 3 shows the model ionization rate in the northern polar region caused by this event. One can see that the maximum values of the ionization rate lie in the mesosphere.
As mentioned above, each pair of ions formed during the flash gives rise to NO and OH molecules that destroy ozone. Figure 4 (upper panel) shows the ozone destruction over the northern daylight (left) and the southern night (right) polar regions, according to model calculations [9]. As the figure shows, reaction of ozone in the daylight and night regions is basically different. Over the daytime area, the destruction is strong (ozone in the mesosphere is completely destroyed), but ozone quickly recovers after SPE end in presence of solar radiation (during polar day). Over the unlit area the ozone demonstrates only small depletion, without recovery.


Availability of the satellite measurements covering the SPE period in July 2000 made it possible to compare the model results with experimental data [10]. Figure 4 (lower panel) shows the results of data processing of the HALOE instrument installed on board the American UARS (Upper Atmosphere Research Satellite) satellite, which measured ozone in the high latitudes of the northern hemisphere during the solar flare. The difference in the ozone content at 680 N between July 15, 2000 (the time of the outbreak) and July 12 (there is no outbreak yet) is shown [11]. The experimental data and model calculations demonstrate the strong (90%) destruction of ozone in the summer mesosphere, the divergence in scales of graphs on the upper and lower panels should be considered. (Unfortunately, comparison of experimental and model results for night polar region occurred to be impossible by the reason of lacking the experimental data) [12]. Therefore, the strong solar proton events can significantly influence ozonosphere in the sunlit polar region.
Figure 5 shows response of electron density to SPE.
Radio wave absorption response
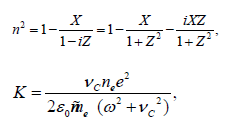
Changes in electron density disturb radio wave propagation and its absorption. (Figure 6-7) Figures below illustrate it.


Concluding Remarks
We can conclude that modern 3D model CHARM-I with support of cosmic information, may be used for forecast of lower ionosphere parameters and radio wave absorption in presence of solar proton event forcing.
Acknowledgement
None.
Conflict of Interest
No Conflict of Interest.
References
- I Mironova, K Aplin, F Arnold, G Bazilevskaya, R Harrison, et. Al (2015) Energetic Particle Influence on Atmospheric Processes. Space Sci Rev 194: 1-96.
- Fabian P, Pyle JA, Wells RJ (1979) The August 1972 solar proton event and the atmospheric ozone layer. Nature 277: 458-460.
- B Funke, A Baumgaertner, M Calisto, T Egorova, CH Jackman Al(2011) Composition changes after the “Halloween” solar proton event: the High Energy Particle Precipitation in the Atmosphere (HEPPA) model versus MIPAS data intercomparison study. Atmos Chem Phys (11): 9089-9139.
- Krivolutsky AA, Cherepanova LA, V’yushkova TY, Repnev AI (2015) The Three-Dimensional Global Numerical Model CHARM-I: The incorporation of processes in the D-region. Geomagnetism and Aeronomy 55(4): 483-503.
- Krivolutsky AA, Cherepanova LA, Dement’eva AV, Repnev AI, Klyuchnikova AV (2015) Global circulation of the Eearth’s atmosphere at altitudes from 0 to 135 km simulated with the ARM model. Consideration of the solar activity contribution, Geomagnetism and Aeronomy 55(6): 808-826.
- Vitt FM, CH Jackman (1996) A comparison of sources of odd nitrogen production from 1974 through 1993 in the Earth’s middle atmosphere as calculated using a two-dimensional model. J Geophys Res 101(3): 6729-6739.
- Prather M (1986) Numerical advection by conservation of second order moments. J Geophys Res 91(6): 6671-6681.
- Krivolutsky A, Kuminov A, Vyushkova T Yu (2005) Ionization of the atmosphere caused by solar protons and its influence on ozonosphere of the Earth during 1994-2003. J Atmos Solar-Terr Phys 67(1-2): 105-117.
- Krivolutsky AA, V’yushkova TY, Cherepanova LA, Kukoleva AA, Repnev AI et. Al (2015)
The three-dimensional photochemical model CHARM. Incorporation of solar activity. Geomagnetism and Aeronomy 55(1): 59-88. - Jackman C, McPeters RD, Labaw GJ, Fleming EL (2001) Northern Hemisphere atmospheric effects due to the July 2000 solar proton event. Geophys Res Lett 28(15): 2883-2886.
- Krivolutsky AA, Kuminov AA, Kukoleva AA, Repnev AI, Perejaslova NK Al (2008) The solar proton’s activity in the 23-d solar cycle and changes in ozonosphere: Simulations and observation data analysis. Geomagn. Aeronomy 48(4): 450-454.
- Ondraskova A, Krivolutsky A (2007) Response of the lower ionosphere to the July 14, 2000 SPE. Model simulation over both poles. Meeting/IAGA/2005, XXIV IUGG Assembly Perugia, Italy.
-
Alexei Krivolutsky, Anna Kukoleva. Disturbances of Ozone Layer and Radio Wave Absorption in D-Region of Ionosphere of the Earth During Solar Proton Event: Simulations with СHARM-I Model. Glob J Eng Sci. 8(1): 2021. GJES.MS.ID.000680.
-
Neutral chemical compounds, Source gases, Ion composition, Positive ions, Negative ions and electrons
-

This work is licensed under a Creative Commons Attribution-NonCommercial 4.0 International License.


