 Research Article
Coastal Flooding on Gravel-Dominated Beaches Under Global Warming
Rafael J Bergillos1,2*, Cristobal Rodriguez-Delgado3 and Gregorio Iglesias4,3
1Hydraulic Engineering Area, Department of Agronomy, University of Córdoba, Rabanales Campus, Leonardo Da Vinci Building, 14071 Córdoba, Spain
2Andalusian Institute for Earth System Research, University of Granada, Avda. del Mediterráneo, s/n, 18006 Granada, Spain
3School of Engineering, University of Plymouth, Plymouth PL4 8AA, UK
4MaREI, Environmental Research Institute & School of Engineering, University College Cork, College Road, Cork, Ireland
Rafael J Bergillos, Hydraulic Engineering Area, Department of Agronomy, University of Córdoba, Rabanales Campus, Leonardo Da Vinci Building, 14071 Córdoba, Spain.
Received Date: December 23, 2018; Published Date: January 17, 2019
Abstract
This work analyses the effects of sea-level rise on flooding events for 3 different scenarios: present situation (S0), optimistic projection (RCP4.5) and pessimistic projection (RCP8.5). The study area is a gravel-dominated beach in southern Spain (Playa Granada), where the SWAN and XBeach-G models are applied to assess wave propagation patterns, total run-up and flooded dry beach area. The results indicate that sea-level rise modifies wave propagation patterns, with alongshore-averaged increases in breaking wave height equal to 1.2% (1.9%) un-der westerly (easterly) storms in the optimistic scenario and 2.6% (2.4%) in the pessimistic scenario. These increments lead to maximum increases in total run-up greater than 13% (14%) for westerly (easterly) storms in the optimistic scenario and 16% (20%) in the pessimistic scenario. Finally, the increases in flooded dry beach area induced by sea-level rise under westerly (easterly) storms are equal to 1.6% (5.9%) and 1.8% (7.7%) in scenarios RCP4.5 and RCP8.5, respectively, and the maximum increments in flooded cross-shore distances exceed 8% in all cases. The methodology proposed in the present work can be extended to other coasts worldwide for assessing the in fluence of sea-level rise on coastal flooding events.
Keywords:Global warming; Sea-level rise; Coastal flooding; Gravel beach
Introductions
Gravel-dominated beaches are common in previously paraglaciated coastal regions and coasts with steep hinterlands, and are widespread in New Zealand [1,2], Canada [3,4], Denmark [5,6], the UK [7,8] and Mediterranean countries [6]. They are also found when nourishment projects use gravels to protect eroded beaches [9,10].
Despite their societal importance, the research advances on gravel and mixed sand-gravel beaches are limited compared to those on sandy beaches [11-15]. This discrepancy is particularly evident for numerical models and contrasts with the increasing demand for reliable approaches to help assess the effects and consequences of sea-level rise [16,17]. To the best of the authors’ knowledge, the implications of sea-level rise on coastal flooding events on gravel beaches have not been addressed so far.
The overall goal of the present paper is to investigate the influence of sea-level rise on wave patterns at the nearshore region, total run-up values (including water level) and flooded area under three scenarios: the present situation (scenario 0), and the optimistic (RCP4.5) and pessimistic (RCP8.5) projections proposed by IPCC (2014). For this purpose, a wave model (SWAN) and a storm response model (XBeach-G) were jointly applied under storm conditions. The following sections detail the study site, the analyzed sea states and sea-level rise scenarios, the implementation of SWAN and XBeach-G, the results obtained, and the conclusions drawn.
Study site
Playa Granada is a 3-km-long gravel-dominated beach located on the southern coast of Spain that faces the Mediterranean Sea (Figure 1A). Limited to the west by the Guadalfeo river mouth and to the east by Punta del Santo (a shoreline horn located at the former location of the river mouth), this beach belongs to the Guadalfeo deltaic coast, extending between Salobrena Rock and the Port of Motril (Figure 1B).

The Guadalfeo River contributes most of the sediment to the beach [18,19]. Its basin covers an area of 1252 km2, including the highest peaks in the Iberian Peninsula (3; 400 m.a.s.l.), and the river is associated with one of the most high-energy drainage systems along the Spanish Mediterranean coast [20]. The river was dammed 19 km upstream from its mouth in 2004, regulating 85% of the basin run-off [21].
As a consequence of river damming, the delta currently experiences severe erosion problems and frequent coastal flooding events (Figure 2). The stretch of Playa Granada has been particularly affected, with more severe coastline retreat in recent years than both the western (between Salobrena Rock and Guadalfeo River Mouth) and eastern (between Punta del Santo and Motril Port) stretches [22,23].

Playa Granada is occupied by farming settlements, an exclusive hotel complex, residential properties that are primarily summer homes, golf fields and restaurants. Hence, this stretch of beach has high environmental and tourism value, and its exploitation requires a large area of dry beach [24]. For this reason, artificial nourishment projects have been frequenting since the river damming [25]. However, the success of these interventions has been very limited [26,27].
This micro-tidal coast is subjected to extra-tropical Atlantic cyclones and Mediterranean storms [28]. Thus, the wave climate is bidirectional, with waves coming from the west-southwest (extratropical cyclones), and east-southeast (Mediterranean storms). The deep water significant wave height with non-exceedance probabilities of 50%, 90% and 99.9% are 0.5m, 1.2m and 3.1m respectively Bergillos et al. [29]. The astronomical tidal range is 0.6 m and storm surges can exceed 0.5m [30].
Methods
Sea states and sea-level rise scenarios
The effects of western and eastern storms (prevailing wave directions at the study site) were simulated by means of the SWAN and XBeach-G models. The input wave conditions for SWAN were deep-water significant wave height equal to 3.1m, spectral peak period equal to 8.4s (the most common value at the study area for storm conditions) and deep-water wave directions equal to 238° (107°) for the westerly (easterly) storm. The latter are the most frequent wave directions at the study site under western and eastern storm conditions, respectively. These sea states were modelled under high tide conditions and for a storm surge of 0.5m (typical value at the study area under storm conditions). These storms were modelled for three scenarios: present situation (scenario 0) and sea-level rises associated to the representative concentration pathways (RCPs) 4.5 and 8.5 at the study area according to IPCC (2014), which represent optimistic and pessimistic projections, respectively.
SWAN model
The spectral wave model SWAN [12] was used to propagate the two storm sea states from deep water to the nearshore region for the three scenarios described in the previous section. The SWAN model was validated for the study area by means of comparison with hydrodynamic measurements collected by two ADCPs during a continuous 41-day field survey [26].
In this work, we used the computational grids shown in Figure 1C, which were also employed for the calibration of the model. The results of the SWAN model were used to quantify the variations in breaking wave height values induced by the sea-level rise. They were also employed to provide the input conditions for the XBeach-G model, as detailed in the following section.
XBeach-G model
The storm impact model XBeach-G, which was specifically developed for reproducing the storm hydrodynamics, hydrology and morpho dynamics of gravel dominated beaches [31,32], was applied to quantify the values of the total run-up (including water level) under the wave conditions and scenarios detailed in Section 3.1. The XBeach-G model was validated for the study area by means of comparison with morphological data measured before and after storm events [33,34].
The XBeach-G model was applied to 20 equally-spaced beach pro les (one per 100 m) along the studied stretch of beach (Figure 3). The o shore boundary conditions for XBeach-G were computed through the results of SWAN at a water depth equal to 10 m for all the beach pro les. This value of the o shore depth is in agreement with all the model requirements [3]. On the other hand, the landside boundaries were variables alongshore depending on the type of occupation located landward of the beach pro les (farming settlements, hotel complex, golf field or residential properties, see Figure 3).
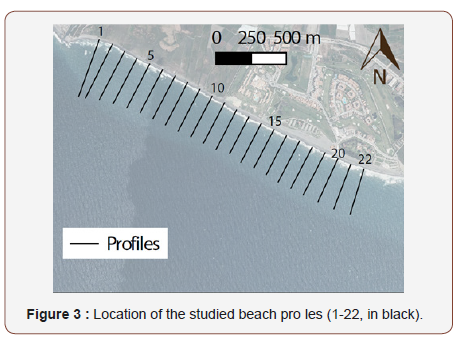
The results of the XBeach-G model were employed to compute the maximum values of total run-up and flooded cross-shore distance in every beach pro le. The values of total flooded area along the coastline section of Playa Granada for the analyzed scenarios were also obtained.
Results
Wave propagation: significant wave height at breaking
The sea-level rise and the resulting variations in wave propagation patterns generate changes in the significant wave height at breaking, as it is depicted in Figure 4. Under westerly storms, the sea-level rise leads to an increase in the breaking significant wave height along the whole studied stretch of beach. The increases are generally greater for the RCP8.5 scenario, except in the western part of Playa Granada, where the significant wave height at breaking are higher for the RCP4.5 scenario. The increase peak values are equal to 4.3% (RCP4.5) and 5.8% (RCP8.5), whereas the alongshore-averaged increments in Playa Granada are 1.9% and 2.4%, respectively.
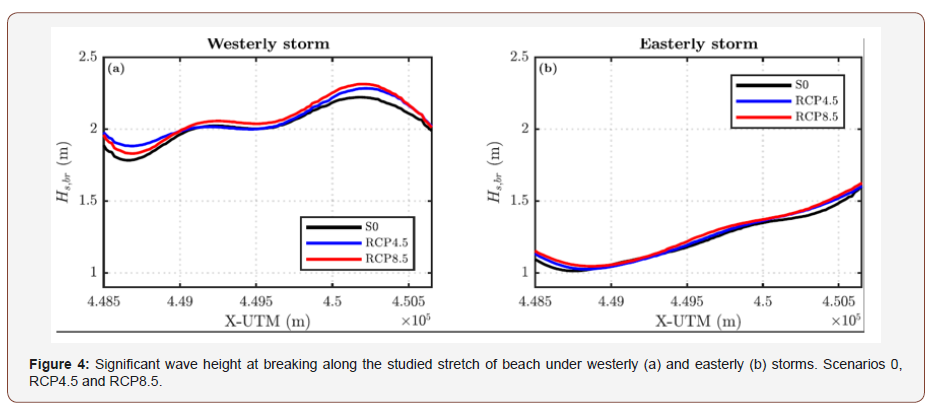
Under eastern storm conditions, the increases in breaking significant wave height is primarily relevant in the western and eastern boundaries of the studied coastline section, and the maximum increases with respect to scenario 0 are up to 3.7% and 5.8% for RCP4.5 and RCP8.5, respectively. Under these wave conditions, the alongshore-averaged increases induced by sea-level rise in scenarios RCP4.5 and RCP8.5 are equal to 1.2% and 2.6%, respectively.
For both wave directions, it is observed that generally the greater the sea level rise, the greater the breaking wave height values. Thus, global warming will not only induce sea-level rise, but these variations in sea level will also lead to greater values of wave height and energy at the breaking zone. Both sea-level rise and increase in wave height will affect negatively to coastal flooding issues, as will be detailed in the following sections.
Total run-up
As indicated in Section 3.3, the total run-up values (including water level) were computed with the XBeach-G model in the 22 beach pro les shown in Figure 3. The results for the wave directions and scenarios modelled are shown in Figures 5 & 6.
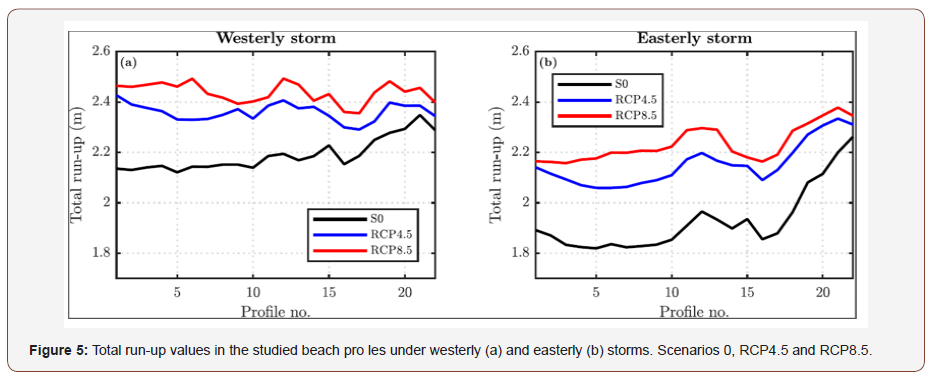
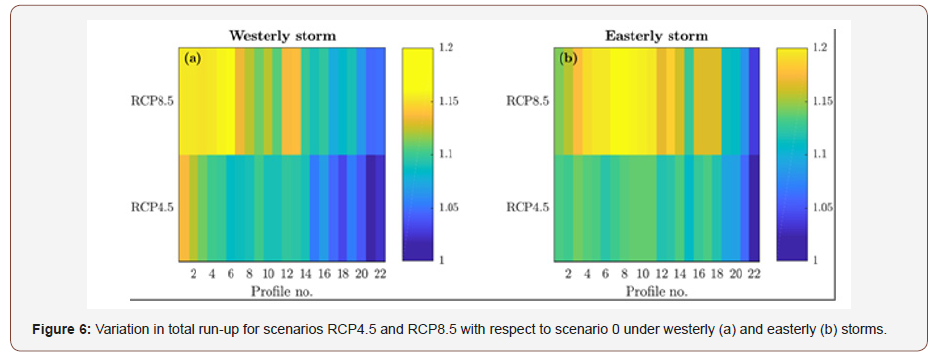
Under western storms, the sea-level rise increases the total runup along the study site, with maximum percent increments respect to scenario 0 equal to 13.6% and 16.3% in RCP4.5 and RCP8.5, respectively. The alongshore-averaged increases in total run-up along the studied stretch of beach for scenarios RCP4.5 and RCP8.5 are equal to 7.9% and 11.4%, respectively. Thus, as expected, the increments are more significant in scenario RCP8.5 than those in scenario RCP4.5 (Figures 5 & 6).
On the other hand, under eastern storm conditions, the sea-level rise leads to maximum (alongshore-averaged) increases in total run-up equal to 14.2% (11.8%) and 20.7% (16.1%) for RCP4.5 and RCP8.5, respectively. Under these wave conditions, the total run-up values are generally lower than those under western storms. This is due to the orientation of the coastline in Playa Granada, which is almost normal to the prevailing western direction under high energy conditions.
Flooded cross-shore distances
This section reports the flooded cross-shore distances for the two wave conditions and three scenarios analyzed. These flooded distances, which are influenced by both the total run-up values shown in Figure 5 and the morphologies of the emerged beach pro les, are shown in Figure 7. For westerly storms, increases in flooded distances occur between pro les 17 and 21 in both RCP scenarios (Figure 8). This is due to the overs wash of the whole beach in pro les 1-17 in scenario 0 under westerly storm conditions. The maximum (alongshore- averaged) increments in flooded crossshore distances induced by the sea-level rise under these conditions for scenarios RCP4.5 and RCP8.5 are equal to 8.5% (1.2%) and 9.6% (1.4%), respectively.
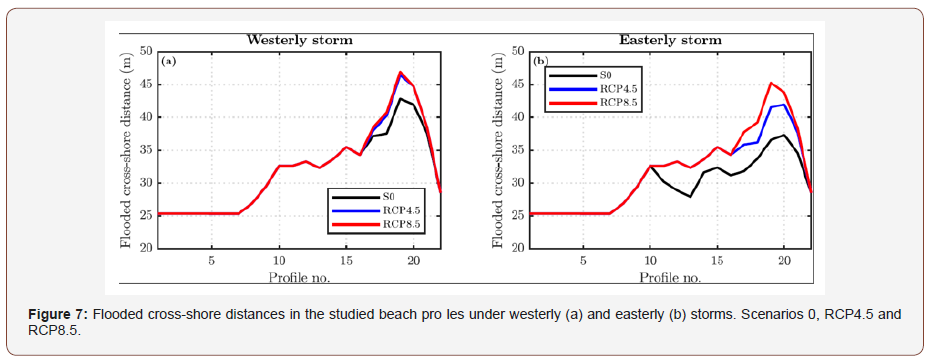
Under easterly storms, the flooded distances are increased due to sea-level rise in pro les 11 to 21 (Figure 6 & 7). In pro les 1 to 10, the beach is over washed in all scenarios in the same way as for westerly storms. This is due to the lower dry beach area in this stretch, which is closer to the river mouth and has experienced greater values of shoreline retreat in recent years due to river regulation [19]. For eastern storm conditions, the maximum (alongshore-averaged) increments in flooded cross-shore distances induced by sea-level rise in scenarios RCP4.5 and RCP8.5 are equal to 15.8% (5.5%) and 23.9% (6.9%), respectively [35,36].
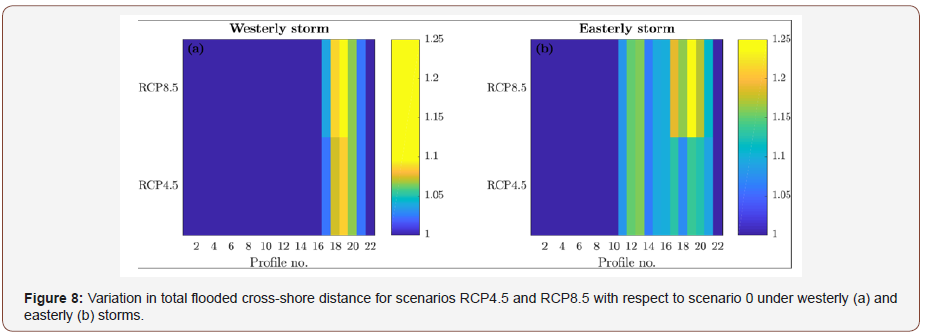
The increases in flooded cross-shore distances for easterly storm conditions are extended along the whole urbanized stretch of beach, with maximum values of 5 m (8.7 m) for scenarios RCP4.5 (RCP8.5); whereas under westerly storms the increments are concentrated in the occupations located in the eastern part of Playa Granada, reaching values up to 3.6 m and 4.1 m for scenarios RCP4.5 and RCP8.5, respectively (Figures 8 & 9).

Flooded area
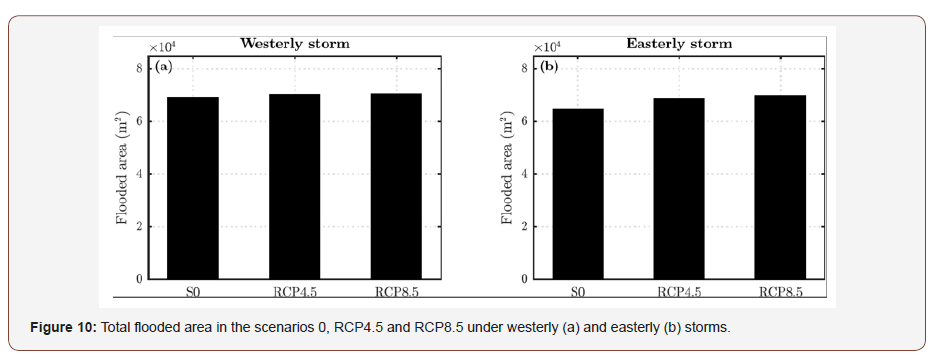
Figure 10 represents the total flooded dry beach areas for the three scenarios under both western and eastern storm conditions. Under westerly storms, the increases in coastal flooding induced by the sea-level rise are equal to 1,086.8 m2 (1.57%) and 1,238.7m2 (1.79%) for scenarios RCP4.5 and RCP8.5, respectively.
For eastern storm conditions, the increments in flooded dry beach area with respect to scenario 0 are equal to 3,869.5m2 (5.9%) and 4,987.1m2 (7.7%) for scenarios RCP4.5 and RCP8.5, respectively. Under both wave directions, the coastal flooding increases with increasing values of sea-level rise, but the increments are significantly greater under easterly storms, so that the effects of global warming will be particularly severe for these wave conditions.
Conclusion
This paper analyses the effects of sea-level rise in storminduced coastal flooding events on a gravel-dominated beach (Playa Granada, southern Iberian Peninsula) under three scenarios: present situation (scenario 0), optimistic projection (RCP4.5) and pessimistic projection (RCP8.5). With this purpose, the SWAN and XBeach-G models, previously validated for the study site, were coupled and applied to 22 beach pro les in order to assess wave propagation patterns, total run-up values (including water level), flooded cross-shore distances and total flooded area for the prevailing storm directions (SW and SE) and the three aforementioned scenarios.
In terms of wave propagation patterns, under westerly storms, the sea-level rise leads to an increase in significant wave height at breaking, with alongshore- averaged increments with respect to scenario 0 equal to 1.9% and 2.4% for scenarios RCP4.5 and RCP8.5, respectively. Conversely, the alongshore-averaged increases in breaking wave height under easterly storms are equal to 1.2% and 2.6% for scenarios RCP4.5 and RCP8.5, respectively.
On the other hand, the total run-up is increased under western storms along the studied coastline section, with maximum (alongshore-averaged) increments in scenarios RCP4.5 and RCP8.5 equal to 13.6% (7.9%) and 16.3% (11.4%), respectively; whereas under eastern storm conditions the total run-up increases up to 14.2% and 20.7% for RCP4.5 and RCP8.5, respectively. Under easterly storm conditions, the alongshore-averaged increments are equal to 11.8% and 16.1%, with total run-up values generally lower than those under western storms. This is induced by the shoreline orientation in Playa Granada, which is almost normal to the incoming westerly waves.
Regarding flooded cross-shore distances, they are increased due to sea-level rise under westerly storm up to 8.5% and 9.6% for scenarios RCP4.5 and RCP8.5, respectively; whereas the alongshoreaveraged increments are equal to 1.2% and 1.4%, respectively. Under eastern storms, the maximum (alongshore- averaged) increments for scenarios RCP4.5 and RCP8.5 respect to scenario 0 are equal to 15.8% (5.5%) and 23.9% (6.9%), respectively. Finally, the increases in flooded dry beach area induced by sea-level rise under westerly (easterly) storms are equal to 1.57% (5.9%) and 1.79% (7.7%) in scenarios RCP4.5 and RCP8.5, respectively.
Thus, the increments are significantly greater under easterly storms, so that the impact of global warming will be particularly severe for these wave conditions. The methodology followed in this paper to quantify the effects of sea-level rise on coastal flooding is feasibly extensible to other gravel-dominated coasts across the globe.
Acknowledgement
Wave, sea-level rise, bathymetric and DEM data were provided by Puertos del Estado (Spain), University at Hamburg (Germany), Ministerio de Agricultura, Pesca y Alimentacion (Spain) and Instituto Geogra co Nacional (Spain), respectively. This paper was carried out in the framework of the research group Coastal, Ocean and Sediment Transport (COaST) Engineering Research Group (University of Plymouth, UK) and the research grants WAVEIMPACT (PCIG-13-GA-2013-618556, European Commission, Marie Curie fellowship, fellow GI) and ICE (Intelligent Community Energy, European Commision, Contract no. 5025). RB was partly funded by the University of Granada (Programa Contratos Puente 2017) and the Spanish Ministry of Science, Innovation and Universities (Programa Juan de la Cierva 2017, FJCI-2017-31781).
Conflict of Interests
No Conflict of Interest.
References
- Shulmeister J, Kirk RM (1993) Evolution of a mixed sand and gravel barrier system in North Canterbury, New Zealand, during Holocene sealevel rise and still-stand. Sedimentary Geology 87(3-4): 215-235.
- Soons JM, Shulmeister J, Holt S (1997) The Holocene evolution of a well-nourished gravelly barrier and lagoon complex, Kaitorete Spit, Canterbury, New Zealand. Marine Geology 138(1-2): 69-90.
- Deltares (2014) XBeach-G GUI 1.0. User Manual. Delft, The Netherlands. Engels, S., Roberts, M.C., 2005. The architecture of prograding sandygravel beach ridges formed during the last Holocene highstand: Southwestern British Columbia, Canada. Journal of Sedimentary Research 75: 1052-1064.
- Dashtgar SE, Gingras MK, Butler KE (2006) Sedimentology and stratigraphy of a transgressive, muddy gravel beach: Waterside Beach, Bay of Fundy, Canada. Sedimentology 53(2): 279-296.
- Clemmensen LB, Nielsen L (2010) Internal architecture of a raised beach ridge system (Anholt, Denmark) resolved by ground-penetrating radar investigations. Sedimentary Geology 223(3): 281-290.
- Clemmensen LB, Glad AC, Kroon A (2016) Storm flood impacts along the shores of micro-tidal inland seas: A morphological and sedimentological study of the Vesterlyng beach, the Belt Sea, Denmark. Geomorphology 253: 251-261.
- Carter RWG, Orford JD (1984) Coarse clastic barrier beaches: a discussion of the distinctive dynamic and morphosedimentary characteristics. Developments in Sedimentology 60(1-4): 377-389.
- Poate TG, Mc Call RT, Masselink G (2016) A new parameterisation for runup on gravel beaches. Coastal Engineering 117: 176-190.
- Lopez de San Roman Blanco B (2004) Dynamics of gravel and mixed sand and gravel beaches. Ph.D. thesis. Imperial College, London, UK, pp.6-50.
- Moses CA, Williams RBG (2008) Artificial beach recharge: The South East England experience. Zeitschrift fur Geomorphologie, Supplementary Issues 52(3): 107-124.
- Buscombe D, Masselink G (2006) Concepts in gravel beach dynamics. Earth-Science Reviews 79: 33-52.
- Holthuijsen L, Booij N, Ris R (1993) A spectral wave model for the coastal zone, ASCE. Horn, D.P., Walton, S.M., 2007. Spatial and temporal variations of sediment size on a mixed sand and gravel beach. Sedimentary Geology 202: 509-528.
- Jennings R, Shulmeister J (2002) A field based classification scheme for gravel beaches. Marine Geology 186(3-4): 211-228.
- Mason T, Voulgaris G, Simmonds DJ, Collins MB (1997) Hydrodynamics and sediment transport on composite (Mixed Sand/Shingle) and sand beaches: a comparison, in: Proceedings of the 3rd Coastal Dynamics, ASCE, pp. 48-57.
- Pontee NI, Pye K, Blott SJ (2004) Morphodynamic behaviour and sedimentary variation of mixed sand and gravel beaches, Suffolk, UK. Journal of Coastal Research 20(1): 256-276.
- Payo A, Mukhopadhyay A, Hazra S, Ghosh T, Ghosh S, et al. (2016) Projected changes in area of the Sundarban mangrove forest in Bangladesh due to SLR by 2100. Climatic Change 139(2): 279-291.
- Spencer T, Schuerch M, Nicholls RJ, Hinkel J, Lincke D, et al (2016) Global coastal wetland changes under sea-level rise and related stresses: the DIVA Wetland Change Model. Global and Planetary Change 139: 15-30.
- IPCC (2014) Climate change 2014: synthesis report. Intergovernmental panel on climate change, Switzerland.
- Bergillos RJ, Rodr Guez Delgado C, Millares A, Ortega Sanchez M, Losada MA (2016) Impact of river regulation on a Mediterranean delta: Assessment of managed versus unmanaged scenarios. Water Resources Research 52(7): 5132-5148.
- Millares A, Polo MJ, Monino A, Herrero J, Losada MA (2014) Bedload dynamics and associated snowmelt influence in mountainous and semiarid alluvial rivers. Geomorphology 206: 330-342.
- Losada MA, Baquerizo A, Ortega Sanchez M, Avila A (2011) Coastal evolution, sea level, and assessment of intrinsic uncertainty. Journal of Coastal Research 59: 218-228.
- Bergillos RJ, Lopez Ruiz A, Medina Lopez E, Monino A, Ortega Sanchez M (2018) The role of wave energy converter farms on coastal protection in eroding deltas, Guadalfeo, southern Spain. Journal of Cleaner Production 171: 356-367.
- Bergillos RJ, Lopez Ruiz A, Ortega Sanchez M, Masselink G, Losada MA (2016) Implications of delta retreat on wave propagation and longshore sediment transport-Guadalfeo case study (southern Spain). Marine Geology 382: 1-16.
- Felix A, Baquerizo A, Santiago JM, Losada MA (2012). Coastal zone management with stochastic multi-criteria analysis. Journal of Environmental Management 112: 252-266.
- Bergillos RJ, Ortega Sanchez M, Losada MA (2015) Foreshore evolution of a mixed sand and gravel beach: The case of Playa Granada (Southern Spain), in: Proceedings of the 8th Coastal Sediments, World Scientific.
- Bergillos RJ, Rodr Guez Delgado C, Ortega Sanchez M (2017) Advances in management tools for modeling artificial nourishments in mixed beaches. Journal of Marine Systems 172: 1-13.
- Bergillos RJ, Lopez Ruiz A, Principal Gomez D, Ortega Sanchez M (2018) An integrated methodology to forecast the efficiency of nourishment strategies in eroding deltas. Science of The Total Environment 613-614: 1175-1184.
- Ortega Sanchez M, Bergillos RJ, Lopez Ruiz A, Losada MA (2017) Morphodynamics of Mediterranean Mixed Sand and Gravel Coasts. Springer.
- Bergillos RJ, Ortega Sanchez M, Masselink G, Losada MA (2016) Morphosedimentary dynamics of a micro-tidal mixed sand and gravel beach, Playa Granada, southern Spain. Marine Geology 379: 28-38.
- Bergillos RJ, Masselink G, Ortega Sanchez M (2017) Coupling crossshore and longshore sediment transport to model storm response along a mixed sand-gravel coast under varying wave directions. Coastal Engineering 129: 93-104.
- Mc Call RT, Masselink G, Poate TG, Roelvink JA, Almeida LP, David Son M, Russell PE (2014) Modelling storm hydrodynamics on gravel beaches with XBeach-G. Coastal Engineering 91: 231-250.
- Mc Call RT, Masselink G, Poate TG, Roelvink JA, Almeida LP (2015) Modelling the morphodynamics of gravel beaches during storms with XBeach-G. Coastal Engineering 103: 52-66.
- Bergillos RJ, Masselink G, Mc Call RT, Ortega Sanchez M (2016) Modelling overwash vulnerability along mixed sand-gravel coasts with XBeach-G: Case study of Playa Granada, southern Spain. Coastal Engineering Proceedings 35: 13.
- Bertoni D, Sarti G (2011). On the profile evolution of three artificial pebble beaches at marina di pisa, italy. Geomorphology 130: 244-254.
- Bergillos RJ, Rodr Guez Delgado C, Lopez Ruiz A, Millares A, Ortega Sanchez M, et al. (2015) Recent human-induced coastal changes in the Guadalfeo river deltaic system (southern Spain), in: Proceedings of the 36th IAHR-International Association for Hydro-Environment Engineering and Research World Congress.
- Spencer T, Schuerch M, Nicholls RJ, Hinkel J, Lincke D, et al (2016) Global coastal wetland changes under sea-level rise and related stresses: the DIVA Wetland Change Model. Global and Planetary Change 139: 15-30.
-
Rafael J Bergillos, Cristobal Rodriguez-Delgado, Gregorio Iglesias. Coastal Flooding on Gravel-Dominated Beaches Under Global Warming. Glob J Eng Sci. 1(3): 2019. GJES.MS.ID.000513.
-
Composite shear wall with steel tubes bundle, Axial pressure ratio, Normal section bearing capacity, Finite element analysis, Wall thickness, Yield strength of steel, Steel tube bundle, Concrete shaft, Finite element, Bearing capacity, Concrete compression zone, Axial-load ratio
-

This work is licensed under a Creative Commons Attribution-NonCommercial 4.0 International License.


