 Research Article
Study on the Mechanical Performance of Transmission Towers Based on Foundation Correction
Kongliang Chen*, Jiahao Ding and Guoqing Yuan
School of Civil Engineering and Architecture, Wuyi University, Jiangmen, Guangdong, 529000, China
Kongliang Chen, School of Civil Engineering and Architecture, Wuyi University, Jiangmen, Guangdong, 529000, China.
Received Date:February 06, 2025; Published Date:February 19, 2025
Abstract
As an important national infrastructure, transmission towers need to withstand a variety of complex loads during their long-term operation, and ensuring their safety and reliability is essential. For transmission tower with foundation correction, a refined finite element model of the transmission tower-line system is established in combination with Midas Civil based on the catenary theory, and the special working condition of 10°vertical offset of the middle tower is simulated, and the force of the conductor is discussed in depth. Additionally, eight typical working conditions of transmission towers under different offset angles and load cases are analyzed in this paper. The results show that the stress distribution of the transmission tower is relatively uniform under the windless conditions, and the stress and displacement characteristics are significantly changed by wind load, and the offset of the middle tower significantly aggravates the stress concentration at the foot of the tower and amplifies the vertical deformation of the wire. The modal analysis reveals that the low-order modes reflect the overall motion characteristics, while the higher-order modes show the vibration behavior of the local members. This research offers valuable insights into the wind and seismic resistance design and optimization of transmission towers.
Keywords:Transmission tower; Finite element; Suspension chain;0 Catenary shape
Introduction
As the core infrastructure for power transmission, transmission lines play an indispensable role as a bridge in the power supply system due to their large number and wide distribution [1]. The structural safety of these lines is not only a critical guarantee for the stable operation of the power grid but also directly affects the efficiency and smoothness of the power network [2]. The towerline system is an important carrier for power transmission. Its lightweight, high flexibility, and low damping characteristics make it susceptible to fatigue damage under extreme weather conditions, and it may even collapse or be destroyed [3]. The typical configuration of the conductor is formed by the combined effects of its self-weight and tension resulting in a catenary shape.
As an important infrastructure of the power grid, transmission towers may experience varying degrees of displacement during their long-term operation due to factors such as foundation settlement, wind loads, geological shifts, or construction errors [4]. Such offset not only alters the stress distribution and deformation characteristics of the tower-line system but may also lead to uneven conductor tension, increased sag, and local instability of the tower, posing significant safety hazards. Li Xing et al. [5] proposed a rapid repair technique for addressing severe tilting of 500kV transmission line towers, and the research focused on investigating the causes of tower tilting and designing targeted correction methods. Sun Kaihua [6] focused on the correction and reinforcement of transmission towers tilted in mining areas, proposing a comprehensive remediation strategy. Zou Xixing et al. [7] addressed the significant tilting of a 110kV transmission line tower caused by uneven foundation settlement. Lou Hongyu et al. [8] proposed a correction plan for the deformation of primary materials in a 220kV transmission tower caused by construction and assembly, the plan centered on the use of clamp jacking technology and cross-type reinforcement technology with fixture connections.
In summary, correction techniques for transmission towers have played a crucial role in addressing issues such as foundation settlement and tilting. These studies have not only validated the technical feasibility of multiple correction methods but also emphasized the importance of real-time monitoring and simultaneous reinforcement. By establishing a tower-line model, the overall mechanical performance of the system after tower correction was systematically investigated. These findings offer valuable experience and theoretical references for the design and construction of similar projects in the future.
Calculation of Transmission Tower Pylons Based on The Theory of Hanging Chain Lines
Transmission lines are typical cable structures, with their initial configuration determined by the initial sag and endpoint positions of the line. Based on this configuration, a spatial model of the transmission line can be further established. In the calculation of cable structures, catenary theory or parabolic theory is typically used for analysis and design. Among these, catenary theory provides an accurate method, whereas parabolic theory can be applied when the sag-to-span ratio of the cable structure is less than 1/8 [9].
By establishing the relationship between cable-end tension and nodal displacement, an iterative algorithm for solving the tension of cable segments can be constructed accordingly [10]. During the iterative calculation of cable-end tension, initial values for F1 and F2 need to be preset. For a catenary, the expression for the cable length L [11] is given as:
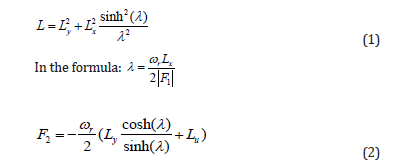
λ Approximated as 0.2 [12]. The initial values of F1 and F2 can be determined using equations (2) . Substituting equation (2) into (1), the expression for the cable length is obtained:

In the formula, TI and TJ respectively represent the cable forces at points I and J. Self-weight is also considered.

When performing finite element analysis on suspension cables, it is first necessary to determine the spatial co-ordinates of the nodes for each cable element, which requires solving for the initial shape of the cable. Since the shape of a cable is indeterminate when it is unstressed, the form-finding process must be carried out in two steps: the spatial configuration of the suspension cable under self-weight is calculated in first, and then it is corrected iteratively to obtain the initial state without external forces. For a suspension cable subjected only to gravity, its catenary equation [13] is given as:
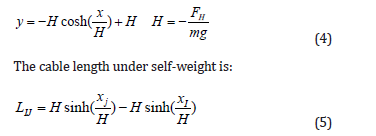
For the main span of the transmission tower-line system, the coordinates of the cable endpoints are known, leaving only the horizontal tension H in equation (4) as the unknown. By constructing the following iterative formula, H can be solved and substituted into equation (4) to determine the spatial coordinates of the cable under self-weight:

After determining the spatial coordinates of the cable under selfweight, the cable length Lu can be further calculated using equation (5). Substituting the cable length Lu and the cable-end tension into equation (4), thereby determining the initial configuration of the tower-line system in the absence of external forces. When there is a height difference between transmission towers, the heights of the anchoring points at both ends are respectively yA and yB. Assuming the horizontal projection distance between the two ends is Lx, the catenary equation can be adjusted by incorporating the height difference Δh of the anchoring points. The modified catenary equation is:

In the formula: Δh=yA-yB is the height difference between the two anchoring points; Δh/Lx is the slope of the conductor in the horizontal direction; yA is the height of the left anchoring point (reference point). And the actual length of the conductor under selfweight is modified as:

Where


The solution for H can then be substituted into the catenary equation.
Establishment of the Finite Element Model
Overview of the transmission tower line
A straight transmission tower from a specific transmission line is used as the research object. The total length of the line at both ends is approximately 100 m. The total height of the transmission tower is 40 m, and the tower body is modeled using Q235 steel with 140×10 equal-angle sections. The specifications of the tower materials, conductors, and ground wires, along with the loading conditions are shown in Figure 1, of which Angle steel components are established using an ideal elastoplastic bilinear constitutive model. The transmission tower is simulated using beam elements, while the conductors and ground wires are modeled as truss elements based on catenary theory for shape-finding. During the calculation of the bare tower, the mass effects of the conductors and ground wires are considered by simplifying them into equivalent masses applied to the conductor and ground wire attachment points at the tower head. It is assumed that the wind direction along the line is 0°, while the wind direction perpendicular to the line is 90°.
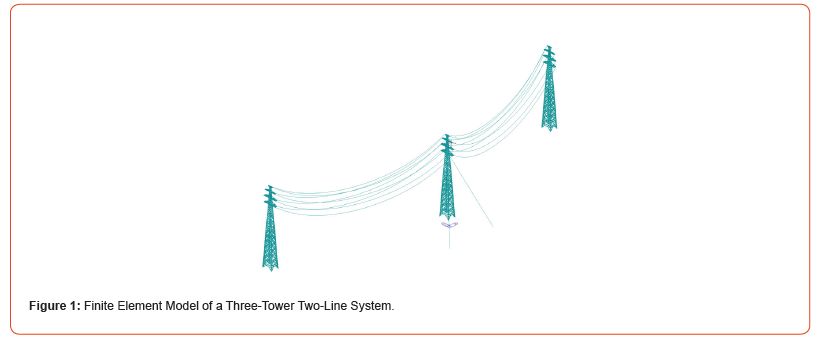
Finite element model of the tower-line system
A finite element model of a three-tower two-line system was established using the finite element software Midas Civil, with the X-axis aligned along the direction of the tower-line system. The three towers, arranged from left to right, are the boundary tower, the middle tower, and another boundary tower, respectively designated as Tower1, Tower2, and Tower3. To comprehensively investigate the wind-induced vibration response characteristics of the transmission tower-line system under tower vertical offset and varying inter-tower offset conditions, this study conducted a systematic analysis from two perspectives, vertical offset of a single tower and inter-tower offset angles. In the analysis of tower vertical offset as shown in Figure 2, the scenario of a 10° vertical offset of the middle tower was examined. Furthermore, to explore the impact of relative positional changes between towers on the overall performance of the transmission tower-line system, this study also considered four typical scenarios with inter-tower offsets shown in Table 1). Based on these scenarios, comprehensive calculations and evaluations were performed, including stress analysis, displacement response, modal analysis, and time-history analysis under no wind and 90° wind load conditions [14].
Table 1:Combination of calculation conditions.


Calculation of wind load on transmission towers
Taking Tower2 as the research object, the standard value of the tower wind load is calculated using equation (10):

In equation (10): WS represents the standard value of the wind load on the tower; W0 is the standard value of the reference wind pressure, and B2 is the icing wind load amplification coefficient for the tower components, which is taken as 1.0 in this study. According to the ‘Load Code for the Design of Building Structures’ GB 50009 and data provided by the Guangdong Provincial Academy of Building Research, the tower body is divided into four sections from top to bottom. The calculation of wind load-related coefficients is shown in Table 2.
Table 2:Coefficients related to wind load calculation.

Calculation Results and Analysis
Stress Analysis of the Middle Tower with a 10° Vertical Offset
During the long-term operation of transmission lines, factors such as terrain changes, foundation settlement, and construction errors may cause varying degrees of vertical offset in transmission towers, resulting in changes in the mechanical and deformation characteristics of the tower-line system. To study the impact of vertical offset of the middle tower on the tower-line system, this paper first simulates the scenario of a 10° vertical offset of the middle tower as shown in Figure 3, which is consistent with the tilt of the transmission tower in Figure 2, focusing on analyzing the changes in conductor displacement and the stress distribution characteristics of the tower caused by the offset. Finite element calculations are used to explore the displacement response and critical stress locations of the tower-line system under offset conditions.

Taking the lowest point of Line1 as the reference, the variation in vertical displacement under offset and non-offset conditions is illustrated in Figure 4. Under non-offset conditions, the vertical displacement is 4.7 cm for the self-weight case and 1.7 cm under wind load. When the middle tower experiences a 10° vertical offset, the vertical displacement under the self-weight condition significantly increases to 19.7 cm, while the displacement under wind load increases to 3.2 cm. The self-weight displacement after offset increases by 4.19 times, and the wind load displacement increases by approximately 88.2%. The displacement variation at the lowest point of the conductor reflects the significant impact of the middle tower offset on the overall deformation characteristics of the tower-line system. Compared to the non-offset condition, the displacement increase under the self-weight condition is more pronounced, indicating that the conductor is more sensitive to tower offset under its own weight, which may lead to larger vertical deformations. Under wind load, the displacement increase is relatively smaller, but it still exhibits a certain offset effect. Taking Tower2 as the research object, simulations of two conditions, with and without offset 10°, are conducted. The stress distribution characteristics under self-weight and wind load are calculated and analyzed, with the results shown in Figure 5. Under the non-offset condition, the stress at the tower base due to self-weight is 40.7 MPa, while the stress significantly increases to 157.4 MPa un-der wind load. When the middle tower experiences a 10° vertical offset, the stress at the tower base increases to 66.8 MPa underweight, and the stress reaches 160 MPa of maximum value under wind load in this analysis.
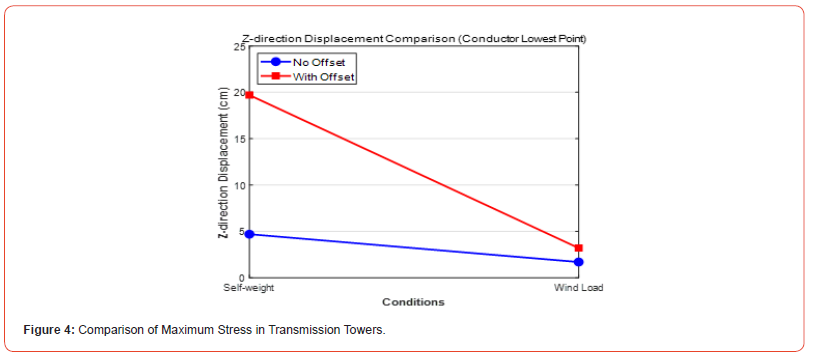
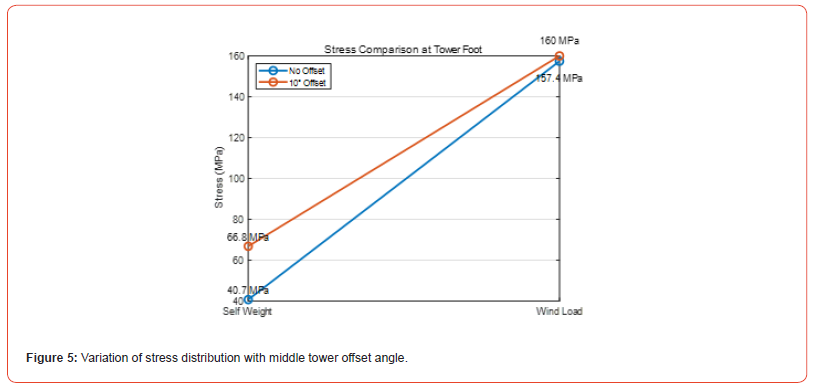
Analysis indicates that the vertical offset of the middle tower significantly affects the stress at the tower base. Under the selfweight condition, the stress at the tower base in the offset condition increases by 64% compared to the non-offset condition; under wind load, the stress in the offset condition is 1.65% higher than in the non-offset condition. Even small angles of the offset can have a significant impact on stress distribution at critical structural points. Therefore, in the design and construction of transmission towers, special attention should be given to the precise installation and maintenance of the tower-line system to reduce the structural risks caused by offset.
Analysis of tower top displacement and stress analysis
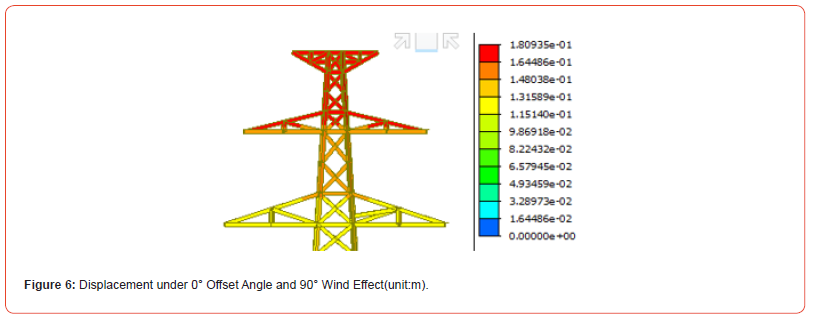
The maximum displacement of the tower-line system occurs at the top of the tower. Under the no wind load condition, the maximum displacement of the transmission tower is approximately 6.3 cm, mainly concentrated in the top tower. The overall distribution is smooth, gradually increasing from the base to the top, reflecting the normal deformation characteristics under gravity. Under the 90° wind load condition as shown in Figure 6, the maximum displacement is approximately 18 cm. The displacement distribution exhibits a significant directional change, with the displacement at the top being more pronounced. The overall displacement amplitude increases significantly, indicating that the wind load primarily acts on the upper region of the tower, causing the displacement direction to shift towards the windward side. The displacement distributions in both conditions reflect the deformation characteristics of the transmission tower under different load conditions, providing a basis for optimizing the tower’s wind resistance design. Through finite element calculations, the stress contour maps of the tower-line system under no wind and 90° wind load conditions are obtained.
Under the no wind load condition, the stress distribution of the transmission tower is relatively uniform, with the maximum stress approximately 65.6 MPa, primarily concentrated at the load-bearing members at the bottom of the tower. In this case, the stress is mainly caused by the self-weight of the conductor and the tower, and the overall structure experiences relatively stable loading, indicating that the tower is not subjected to other external loads. In contrast, the 90° wind load condition has a significant impact on the tower. The lateral effect of the wind load causes the tower to experience greater tensile and compressive stress at the tower base. The stress distribution exhibits a distinct asymmetry, with the windward side members experiencing higher tensile stress, while the leeward side members experience higher compressive stress. Compared to the no wind condition, the wind load significantly increases the stress at the tower base, indicating that the stress state of the tower base members is more complex under wind load [15].
Model analysis
To analyze the impact of the transmission line on the dynamic characteristics of Tower1, the multi-Ritz vector method is used to solve for the dynamic characteristic parameters and mode shapes of Tower1 in the tower-line system.
Based on the modal analysis of the transmission tower structure, the characteristic frequencies and periods of the first 60 modes were extracted. The results show that the modal frequency increases gradually with the mode order, while the corresponding vibration period decreases. The frequency of the first mode is 0.854 Hz, with a corresponding period of 1.171 s, reflecting that the low-order modes primarily represent rigid body motion of the entire structure, with a lower frequency and longer period. As the mode order increases, higher-order modes reflect the vibration characteristics of local members. For example, the frequency of the 30th mode is 6.419 Hz with a period of 0.156 s, and the frequency of the 60th mode reaches 72.301 Hz with a period of only 0.014 s, indicating that the high-order modes are mainly concentrated in local vibration patterns. The relationship between frequency and mode is shown in Figure 7.
Time-History Analysis
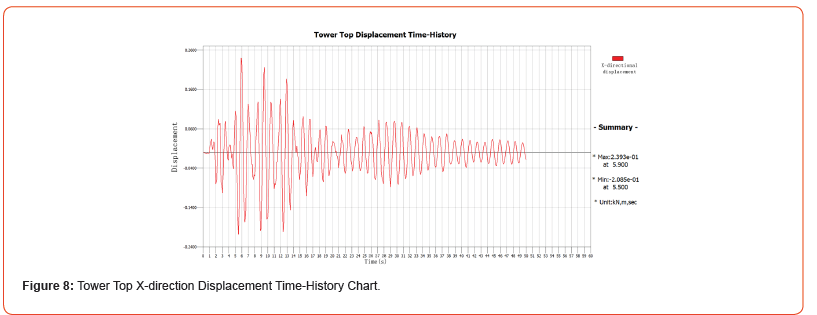
In the analysis, the earthquake wave was selected as the input seismic wave with a peak acceleration of 0.3569g and a duration of approximately 50 seconds, which is widely used in seismic engineering research and serves as an important reference seismic record for structural dynamic response analysis due to its spectral characteristics.
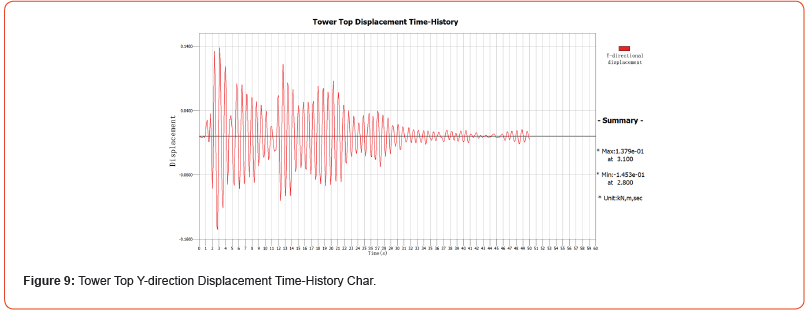
Based on the input of this seismic wave, the displacement timehistory curve in the X direction is shown in Figure 8. The results indicate that the maximum displacement is 0.2393 m, occurring at 5.9 seconds during the earthquake, while the minimum displacement is 0.2058 m, occurring at 5.5 seconds. The displacement response in the X direction reaches its peak value early in the seismic event and then gradually decays over time, displaying clear dynamic characteristics. This suggests that the earthquake’s lateral impact on the structure is significant. Furthermore, the displacement timehistory curve in the Y direction, shown in Figure 9, indicates that the maxi-mum displacement is 0.1379 m at 3.1 seconds, while the minimum displacement is 0.1453 m at 2.8 seconds. Compared to the X direction, the displacement response in the Y direction is smaller, reflecting that the seismic effect in the longitudinal direction is relatively weaker, though a strong vibrational characteristic is still observed initially. Overall, the analysis shows that the response in the X direction is significantly higher than in the Y di-rection, providing important reference for optimizing seismic performance in structural design.
Comprehensive Analysis of Eight Different Conditions
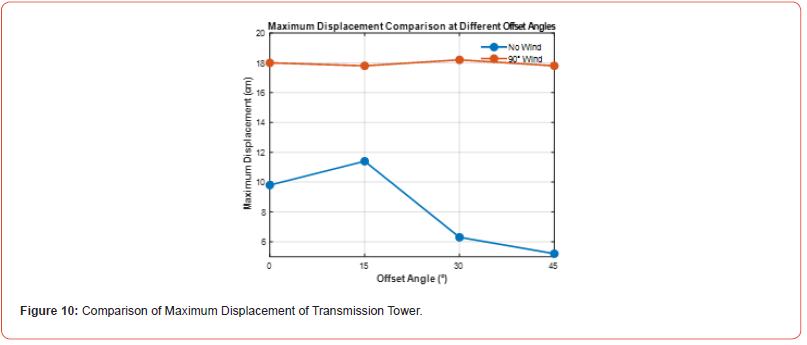
The finite element results for the eight conditions mentioned above are compiled, and the results of the finite element calculations are shown in Figure 10 & Figure 11. A comparative analysis of the maximum displacement of the transmission tower was conducted under different offset angles (0°, 15°, 30°, 45°) and load conditions (no wind and 90° wind load). The results show that under no wind conditions, the maximum displacement is generally small and exhibits a slight decreasing trend as the offset angle increases, with the maximum value occurring at an offset angle of 15°, where the Y-direction displacement at the tower top is 11.4 cm. The minimum value occurs at an offset angle of 45°, where the X-direction displacement at the top is 5.2 cm. Under the 90° wind load condition, the maximum displacement increases significantly, with the maximum displacement for each offset angle occurring in the Y-direction at the tower top, all values being higher than those under the no wind condition. The maximum displacement is18.2 cm, which occurs at an offset angle of 30°.
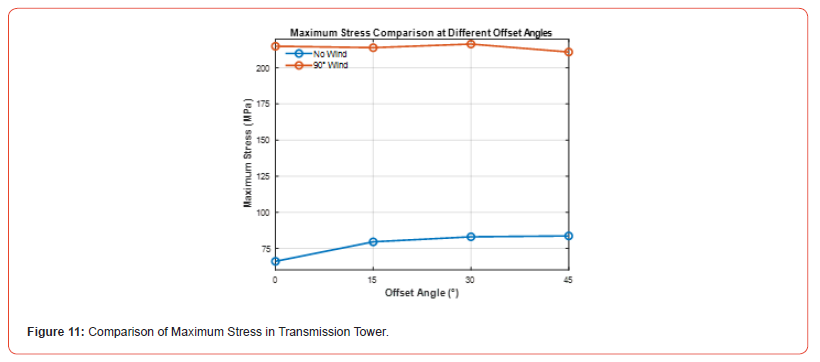
Under different offset angles (0°, 15°, 30°, 45°) and load conditions (no wind and 90° wind load), a detailed analysis of the maximum stress distribution in the transmission tower was conducted. The results show that under no wind conditions, the maximum stress is concentrated at the tower base, with a slight increase in stress value as the offset angle increases. The maximum stress occurs at an offset angle of 45°, reaching 83.6 MPa. Under the 90° wind load condition, the maximum stress in the transmission tower increases significantly, still concentrated at the tower base, with the maximum value of 216.5 MPa occurring at an offset angle of 30°. Compared to the no wind condition, the increase in maximum stress caused by the 90° wind load is significant. The analysis indicates that wind load is a key factor influencing the stress distribution of the transmission tower. The 90° wind load significantly amplifies the stress concentration effect at the tower base, especially when the offset angle is larger, with the stress value far exceeding that under no wind conditions. This result emphasizes the need to pay special attention to the effect of wind load on the tower base in the wind resistance design to ensure the overall safety and stability of the structure.
Conclusion
This study systematically investigates the response
characteristics of the transmission tower under different offset
angles and load conditions from two perspectives based on
foundation correction of transmission towers. The following main
conclusions are drawn:
1) Analysis of the 10° vertical offset condition of the middle
tower shows that changes in the offset angle significantly
alter the stress distribution and deformation of the towerline
system, particularly making the vertical displacement
of the conductor and the stress concentration at the tower
base more pronounced. The analysis results indicate that the
vertical deformation characteristics of the tower-line system
are highly sensitive to changes in the offset angle. The offset
leads to excessive sag of the conductor and uneven local stress
on the tower body, posing a threat to the overall safety of the
transmission line.
2) Under the no wind condition, the stress distribution of the
transmission tower is relatively uniform, with the maximum
stress concentrated at the tower base. The maximum
displacement at the tower top and the conductor is relatively
small. However, under the 90° wind load condition, the stress
distribution and displacement response changes significantly,
especially when the offset angle is 30°, where the peak values
are observed.
3) Model analysis reveals that the low-order modes of the
transmission tower primarily exhibit rigid body motion
characteristics, while the high-order modes reflect the local
vibration behavior of the members. Under the earthquake
wave, the displacement amplitude of the transmission tower
in the X direction is significantly higher than in the Y direction,
and the local vibrations of the structure under high-order
modal frequencies may amplify the seismic response, which
imposes higher requirements on the seismic design of the
structure.
Comprehensive analysis shows that wind load and seismic load are key factors affecting the structural performance of transmission towers. Properly optimizing the structural design of the tower-line system, especially enhancing the wind resistance at the tower base and the seismic performance at the tower top, is crucial for ensuring the overall safety and stability of the transmission line.
Acknowledgement
The paper is supported by Guangdong Science and Technology Department Project (2016A040403125).
Conflicts of Interest
No conflict of interest.
References
- Peng LY, Tian L (2024) Key Technologies for Disaster Prevention, Control, Reinforcement, and Enhancement of Transmission Lines and Their Engineering Applications. Installation (S1): 50-51.
- Zhang LJ, Tian XK, Liu JC, Luo JY, Tian L (2024) Research on the Simulation Analysis and Calculation Method of Bearing Capacity for Transmission Tower Steel Pipe and Angle Steel Combination Joints. Advancements in Building Steel Structures 26(11): 56-65.
- Wang H, Dai G, Zhang X (2024) Study on the Impact of Different Types of Wind and Rain Drop Impact Loads on the Dynamic Response of Transmission and Transformation Tower-Line Systems. Journal of Applied Mechanics 41(02): 404-410.
- Guo WB, Zhao GB, Ma ZB, Yang WQ, Li XC (2023) Current Status and Prospects of Research on Mining-Induced Damage and Protection Technologies for Tall Structures. Coal Science and Technology 51(01).
- Li X, Zhao HZ, Li WX (2008) Rapid Repair of Severe Inclination in 500kV Transmission Line Steel Towers. Southern Power Grid Technology 2(05): 84-85.
- Sun KH (2017) Analysis of the Impact of Mining Activities on the Safety of Transmission Line Towers and Design of Re-inforcement and Renovation. Coal Mining 22(05): 64-67.
- Zhou XX, Zhang SN, Zhu WJ, Zhou H (2008) Case Analysis of Transmission Line Steel Tower Correction. Zhejiang Electric Power 27(06): 30-32.
- Lou YH, Zhang J (2023) Research on Key Technologies for In-situ Correction of Deformation in Transmission Line Steel Towers' Primary Materials. Journal of Electric Power 38(01): 46-53.
- Zhang G, Dai JQ, Xie Q, Li S, Zhao L, et al. (2024) Analysis of Wind-Induced Response and Lifetime Prediction of Service Transmission Lines. High-voltage electrical equipment 60(02): 200-209.
- Xu JG, Shi HJ , Guo Y , Ye Y, Xing YL (2011) Finite Element Modeling of Large-span Transmission Tower-Line System. Power Construction 32(03): 15-19.
- Terence WO, Arthur J Francis (1964) Cable Movements Under Two-Dimensional Loads [J]. Journal of the Structural Division 90(3): 89-123.
- Alain H Peyrot, Alain M Goulois (1978) G Analysis of Flexible Transmission Lines [J]. Journal of the Structural Division 104(5): 769-779.
- Irvine HM (1981) Cable structures [M]. Cambridge: The MIT Press 1981: 11-47.
- Yu JB, Zhuo Y, Zhang JY, Zheng C, Cao MG (2024) Wind-Induced Vibration Response and Dynamic Instability Analysis of Large-span Transmission Tower-Line System on Islands. Shandong Electric Power Technology 51(01): 1-10+23.
- Hu YZ (2024) Study on the Impact of Bolt Loosening on the Dynamic Characteristics and Wind Resistance of Transmission Towers. North China University of Technology.
-
Kongliang Chen*, Jiahao Ding and Guoqing Yuan. Study on the Mechanical Performance of Transmission Towers Based on Foundation Correction. Glob J Eng Sci. 11(5): 2025. GJES.MS.ID.000775.
-
Transmission tower, Finite element, Suspension chain, Catenary shape
-

This work is licensed under a Creative Commons Attribution-NonCommercial 4.0 International License.


