 Research Article
Response Modal Nonlinear Time-History Dynamic Analyses of the Northridge Earthquake of a Two- Storied Steel Structure with Rubber Isolator and Fixed-base Systems
Nader Zad1 and Dr. Hani Melhem2
1Department of Civil Engineering, Kansas State University, United States of America
2Department of Civil Engineering, Kansas State University, United States of America
Nader Zad, Department of Civil Engineering, Kansas State University, Manhattan, Kansas, United States of America.
Received Date:September 30, 2021; Published Date: November 24, 2021
Abstract
This paper analyzes and compares the responses of a two-storied steel structure to the 1994 Northridge earthquake in California. Response modal nonlinear time-history dynamic analysis was especially used on the structure with fixed-base and base-isolated systems to show the realistic behavior of the structure. Intuitively, the best choice for the seismic isolation technique is the use of the flexible element, or an isolator, at the structure’s base, which ensures damping. The current research analyzed in depth the application of a base isolator in the structure. In this study, one structure with different support systems was analyzed to investigate the use of base isolation. The research compared the features and performance of a structure with and without base isolation. The steel building was analyzed subjected to earthquake-induced load with and without a base-isolated rubber bearing. The building was modeled by SAP2000 for nonlinear time-history analysis. Ground-motion simulations of the M6.69 1994 Northridge earthquake in California were applied to the steel base-isolated building model. Study results showed that the presence of an isolation system in a structure with 24 feet (7.31 m) height increased the time period of the structure significantly due to reduced resonance throughout the building.
Keywords:Modal, Nonlinear; Time History; Dynamic Analysis; Northridge; Steel Structure; Rubber Isolator Systems; SAP2000<
Introduction
Base Isolation
Base isolators are placed under structures to isolate the entire structure or internal components within the structure from the devastating effects of seismic lateral force or fluctuations. One of the goals of seismic isolation is to distort the main frequency of the structure from the dominant frequencies of earthquakes. Isolation systems also provide devices for energy damping, which reduce ground acceleration transmitted to the superstructure. The primary objective of base isolation is to isolate the structure from the ground (generally in the horizontal direction) to reduce the transfer of earthquake excitation to the structure. A range of isolators, including elastomer supports (with and without lead core), sliding bearings, and roller supports, have recently been used in the design of anti-seismic new buildings in the United States, Japan, the United Kingdom, Italy, and New Zealand [1].
Based on current studies and observations, the use of suitable seismic isolators to isolate the bases of a building from its foundation significantly increases the natural period and damping, thereby reducing energy input to the system and improving its seismic performance [2].
Nonlinear Analysis
Nonlinear analysis implies a structural analysis that considers the nonlinear behavior of materials, cracks, and nonlinear geometric effects. In based-on-performance seismic design, a structure is designed for different levels of expected performance associated with various levels of earthquake risk. The two main types of nonlinear analysis are nonlinear time-history analysis and nonlinear static analysis (pushover analysis). In general, the nonlinear time-history analysis method is more accurate than the nonlinear static method because it avoids existing approximations to simplify the structural model. However, due to the large volume of input information required (accelerogram of ground movement, hysteresis behavior of structural members, etc.) and the required analysis time for structures with a very large number of elements, long, complicated calculations are applicable only to research work or the design of specific structures due to limitations of existing software/hardware and method sensitivity [3].
Because consideration of economic principles is essential for structural design, the inclusion of nonlinear behavior in the seismic analysis of buildings is especially common in the case of violent earthquakes. A behavior factor, or response modification factor, is often used to consider nonlinear behavior. Following linear analysis, nonlinear analysis responses are obtained by dividing internal forces derived from linear analysis by the behavior factor. Analysis of nonlinear time history using a step-by-step integral is the most effective method for analyzing the nonlinear dynamics of structures [4].
Typically, shell elements are used to model surface structures. The shell element is a three-node (triangular) or four- to multi- node formulation that combines separate members and plate bending behavior; the element does not need to be planar. Structures that can be modeled using shell element include thin planar structural components such as pure membranes and pure plates, as well as three-dimensional surface structures. In general, the full shell behavior is used unless the structure is planar and adequately restrained.
Shell elements are general surface element, which include bent planar elements for three-dimensional surface structures. The shell element provides full shell behavior, in other words, activates all six degrees of freedom at each of its connected nodes. Shell behavior consists of a combination of membrane and plate behavior (inplane and out-plane force action); all forces and moments can be supported (for three-dimensional surface structures, such as rigid shells and vaults). The thin shell is defined geometrically by the shape/form of the middle surface and the shell thickness. Shell surfaces may be made of reinforced concrete, wood, steel, plastics, or may be composite shells. They may form solid surfaces, or they may be grid-shells made from linear members, such as tubes or solid members, and possibly clad with fabric or glass.
Thin shells are form-resistant structures with sufficient curvature that carry loads primarily in membrane action, that is, they carry uniform loads primarily in pure axial and shear action along the middle plane of the shell; bending can be considered insignificant, except where boundary members have an effect. In other words, pure membrane behavior is based on in-plane force action. In SAP2000 shell behavior represents a combination of membrane and plate behavior–all forces can be supported. It is recommended to use shell elements for full shell behavior of threedimensional surface structures.
In contrast to the traditional heavy-weight domes that have a thickness-to-span ratio of up to 1:40, thin concrete shells can go up to 1:1800.
Structural joints may not always be fixed in place, causing them to change position when loads are transferred and potentially allowing free movement (e.g., elastometric bearings, rollers, sliding supports). These joints may also act as artificial damping devices, similar to shock absorbers in cars. Energy-dissipating connections such as slotted, bolted connections dissipate energy via friction between sliding surfaces and base isolators (e.g., viscoelastic dampers), thereby changing the period of motion between ground and structure in seismic areas or areas in which oscillations due to gust wind are critical [5].
The degree of fixity of member joints depends on the stiffness of the attached members. Restraints are rarely truly rigid. For example, a rotation on a foundation may cause differential settlements in the supporting soil, or a cantilever balcony slab may require a supporting wall or beam of extensive torsional stiffness unless a method of clamping (or balancing) is employed by integrating the building structure. Other examples include nonlinear links as isolators and dampers [5].
To control the vibration transmitted from the ground to a building due to traffic or earthquakes, base isolation systems (e.g., seismic dampers) can be used to isolate a structure from the ground to allow it to float as a rigid body [5].
Figure 1 demonstrates the behavior of a structure without and with isolator incorporation (Figure 1).
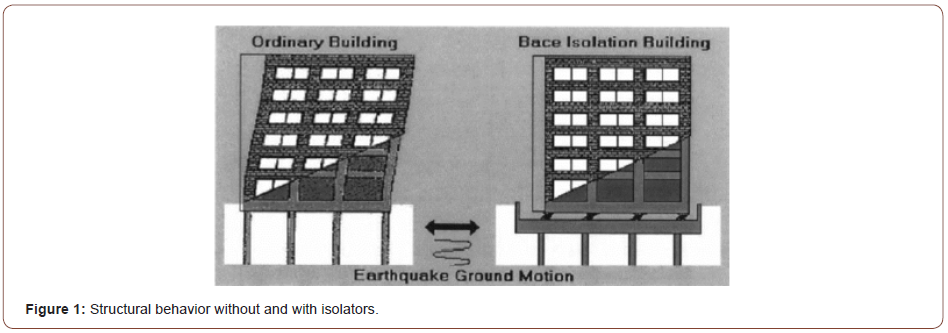
Figure 2 shows the components of a base-isolated structure in relation to the soil system (Figure 2).

Nonlinear Time History Analysis
Time-history analysis applies time-varying loads (e.g., point, line, or area loads) or accelerations to a structure using time-history functions. Time-history functions are defined by specifying time and value (e.g., force, acceleration, displacement, or velocity) or by specifying the function from a previously documented case, such as the base acceleration time history of the 1940 EI Centro earthquake. In other words, “a time-history function may be a list of time and function values, or a list of function values assumed to occur at equally spaced intervals. Function values in a time-history function may be normalized ground acceleration values or multipliers for specified (force or displacement) load cases” [5]. Acceleration history is typically applied at the base of the structure to analyze structural response to seismic action. However, a modal analysis is required before performing a time-history analysis.
Time-history analysis identifies the dynamic response of a damped structure to arbitrary loading or forcing functions due to:
• Periodic motions, in which the loads are periodic, resulting in a periodic structural response. One may distinguish between:
1. simple periodic motion, such as harmonic motion due to cyclic loading (e.g., sine function, cosine function, sawtooth function, triangular function, or user-defined periodic function), is a result of oscillating machinery or mechanical equipment.
2. complex periodic motion (e.g., includes building floor vibrations due to occupant movement or bridge vibration due to traffic)
• Transient motions are non-periodic motions in which the structure is initially at rest but then is subject to loads during a specified time, such as the impact, impulse, or short-duration motion of simple linear pulse loads (e.g., triangular, rectangular, straight line pulses) due to elevators, blasts, driving piles, shock waves, or sonic booms.
• Random motions due to ground movement, such as the histories of ground acceleration at a specified site for seismic design [5].
• When external, dynamic loads cause steady-state motion due to simple periodic motion, such as cyclical (harmonic, sinusoidal) loading, then steady-state analysis can determine the response of a damped or undamped structure [5].
Response Spectrum
The time it takes for the building to respond to its base-induced spectral acceleration, Sa, due to the fluctuating seismic ground loads, becomes an important characteristic of the building. The spectral acceleration, Sa, is a measure of maximum force experienced by a building that is modeled as an inverted pendulum having the natural period of the building.

It is apparent that a series of structures with varying natural period will each respond differently to seismic ground motion. When the maximum response acceleration of a structure is plotted, the graph is called a response spectrum.
In other words, the response spectrum may be visualized as representing a plot of the maximum response quantity against the varying periods of elastic single degree of freedom systems to a particular component of specified ground acceleration and a given amount of damping when they are shaken back and forth.
Seismic codes use the general design response spectrum curve to show the maximum response of an inverted cantilever pendulum to a particular ground motion. Notice that the design spectrum, which defines the ground motion in terms of spectral accelerations, Sa, versus the elastic fundamental period, T, does not represent an uneven curve of a particular earthquake, but a smoothed average response spectrum of many earthquakes.
Research Literature Review
Early pioneers of thin concrete shell design in the first part of the last century were Franz Dischinger in Germany, Eduardo Torroja in Spain, Anton Tedesko in the USA, Felix Candela in Mexico, among many others [5].
Chowdhury et al. compared the characteristics and performance effect of a building with base isolator system and fixed-base system [6]. Sayed-Ahmed analyzed the two buildings using the nonlinear time history response analysis for fixed base (FB) building, and isolated base (IB) building with rubber bearing [7]. AL-Mali- ki analyzed a multi-storied building to explain the behavior under seismic earthquake loading in the two cases, (i.e., with base isolation system and fixed-base system) [8]. Ambasta et al. [9] describe a project that deals with design, modeling and analysis of G+6 rigid jointed plane symmetrical reinforced concrete cement (RCC) frames for two cases: First case is fixed base, and second case is base isolated lead rubber bearing (LRB) [9]. Saksham and Sambhav published a paper in which the main purpose of the study was to reduce the story accelerations and story drifts due to earthquake ground excitation transmitted to the superstructure of the building by installing base isolation devices (base isolators) at the foundation level and then comparing the different performances between the fixed base condition and base-isolated condition using SAP2000 software [10].
Experimental Study
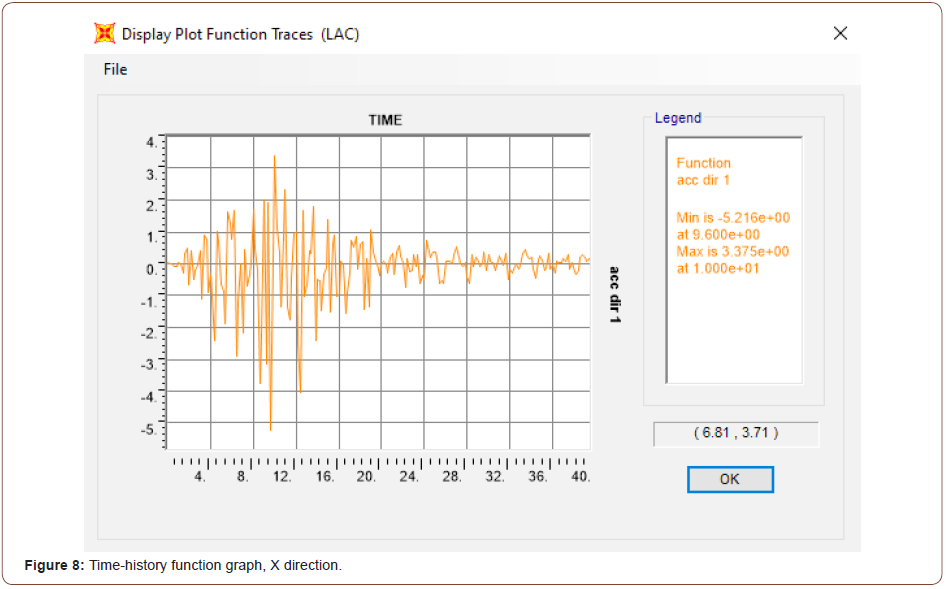
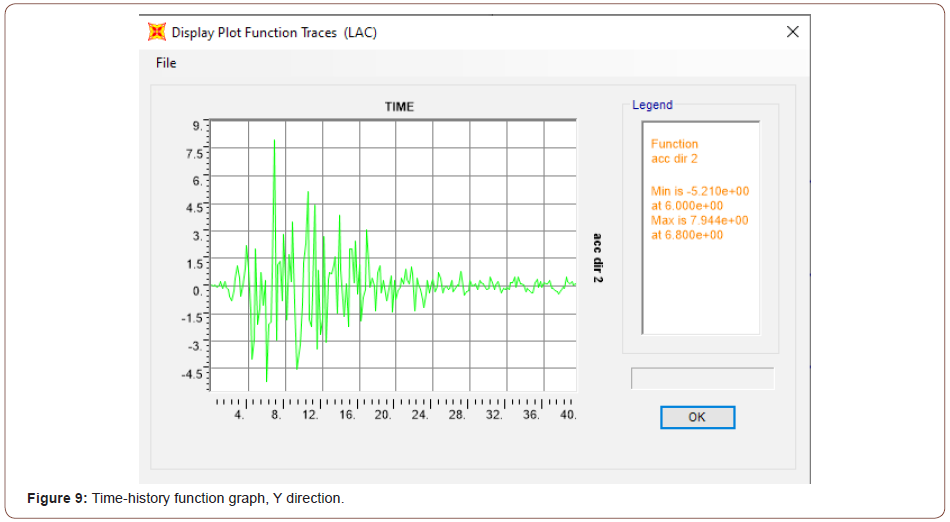
The time-history files LACC_NOR-1 (earthquake station) in the X direction and LACC_NOR-2 (earthquake station) in the Y direction were applied to the structure simultaneously. Each time history was given in units of cm/s2, with 3000 time steps at equal spacings of 0.02 second for a total of 60 seconds. In the time-history files each line contained eight accelerations points.
The two-storied steel structure frame properties used in this study were as follows:
• E = 29000 ksi = 199947961.12 KN/m2
• Poisson’s ratio = 0.3
• Beam: W24 ×55 (I/Wide Flange) (ASTM A992 (Fy = 50 ksi (344737.86 KN/m2), Fu = 65 ksi (448159.22 KN/m2)))
• Column: W14 ×90 (I/Wide Flange) (ASTM A992 (Fy = 50 ksi (344737.86 KN/m2), Fu = 65 ksi (448159.22 KN/m2))) The rubber isolator system utilized in this article was taken from the manufacturer “Dynamic Isolation System”. The rubber isolator system properties were as follows:
• Vertical (axial) stiffness = 10000 kip/in. = 1751267.9 KN/m (linear)
• Initial shear stiffness in each direction = 10 k/in. = 1751.26 KN/m
• Shear yield force in each direction = 5 kips = 22.24 KN
• Ratio of post-yield shear stiffness to initial shear stiffness = 0.2
Figure 3 shows the rubber isolator system support property data as modeled in the SAP2000 software (Figure 3).
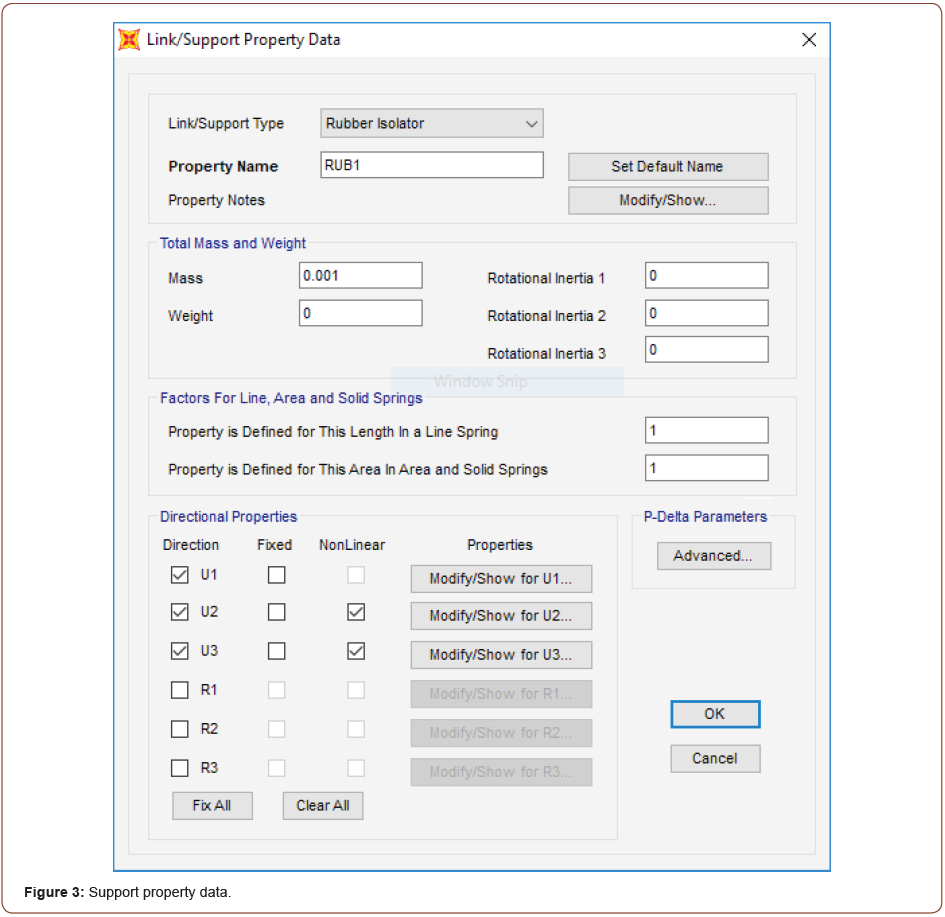
The nonlinearity in the model was the shear behavior of the rubber isolators. The vertical loadings and masses were as follows:
• Roof: 75 psf (3591 N/m2) for Dead Load
20 psf (957.6 N/m2) for Live Load
• Floor: 125 psf (5985 N/m2) for Dead Load
100 psf (4788 N/2) for Live Load
Concrete slab thicknesses were 6 in. (15.24 cm) for the roof and 10 in. (25.4 cm) for the first and second floors. Diaphragm constraint was provided at each level to ensure diaphragm rigidity.
The concrete strength fc was 4000 psi (27579 KN/m2), and the weight per unit volume was 0.15.
The roof and floors were Shell-Thin members. The plastic zone method of advanced analysis, which uses shell elements to create the entire structure, is the most accurate method to prognosticate steel structures’ ultimate strength and behavior. In the SAP2000 model, the plastic-zone model for structure analysis is accepted.
Figure 4 shows the unscaled response spectra (Figure 4).
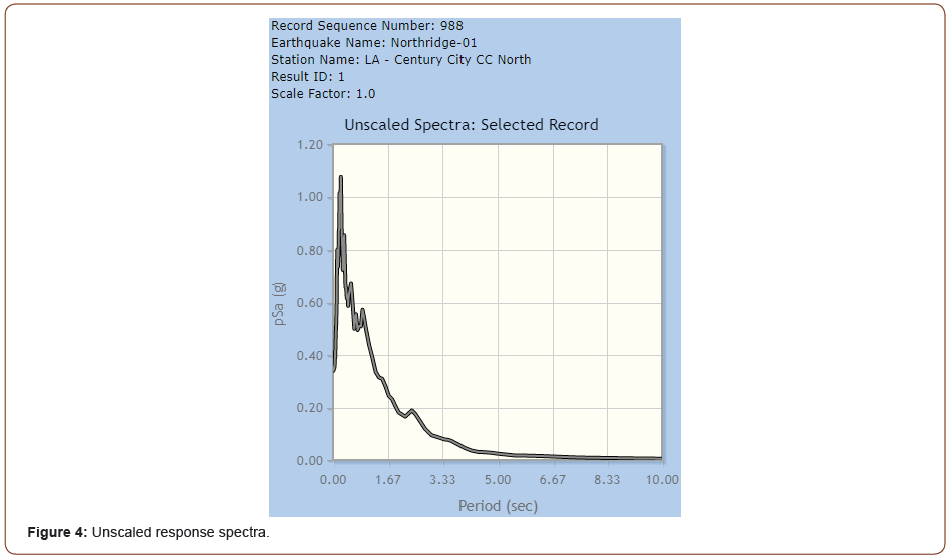
An accelerogram, which measures the peak ground acceleration, duration, and frequency content of an earthquake, can be integrated to obtain time variations of ground velocity and ground displacement [11]. The accelerograms were scaled.
Numerical Comparison
Figure 5 shows the unscaled time series of the Northridge earthquake record (Horizontal-1 Component) (Figure 5).
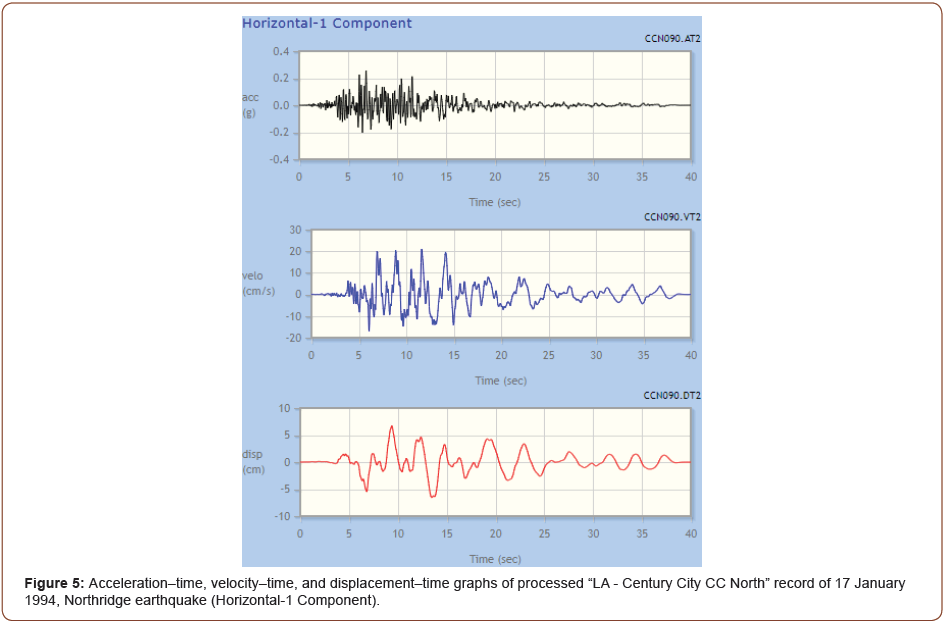
Figure 6 shows the unscaled time series of the Northridge earthquake record (Horizontal-2 Component) (Figure 6).
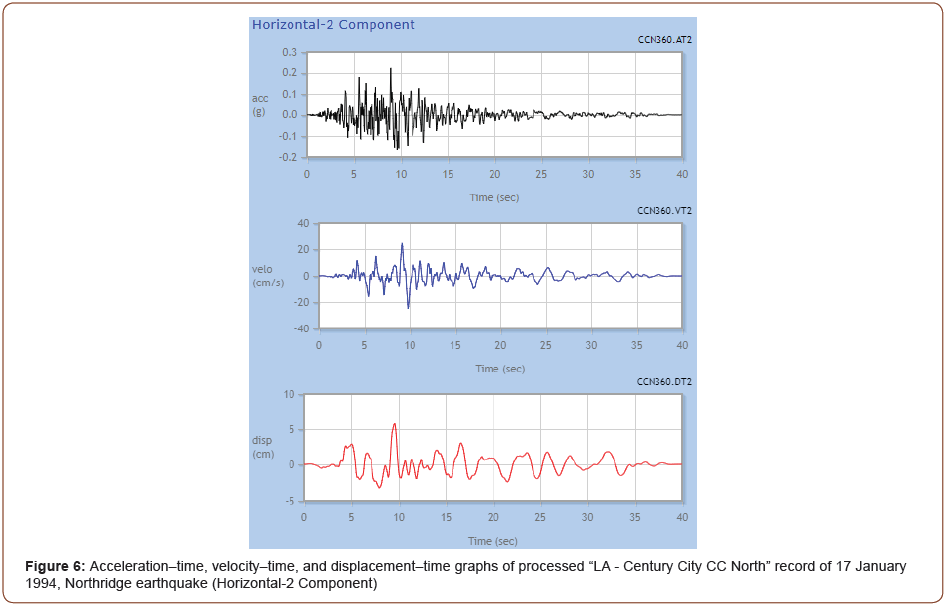
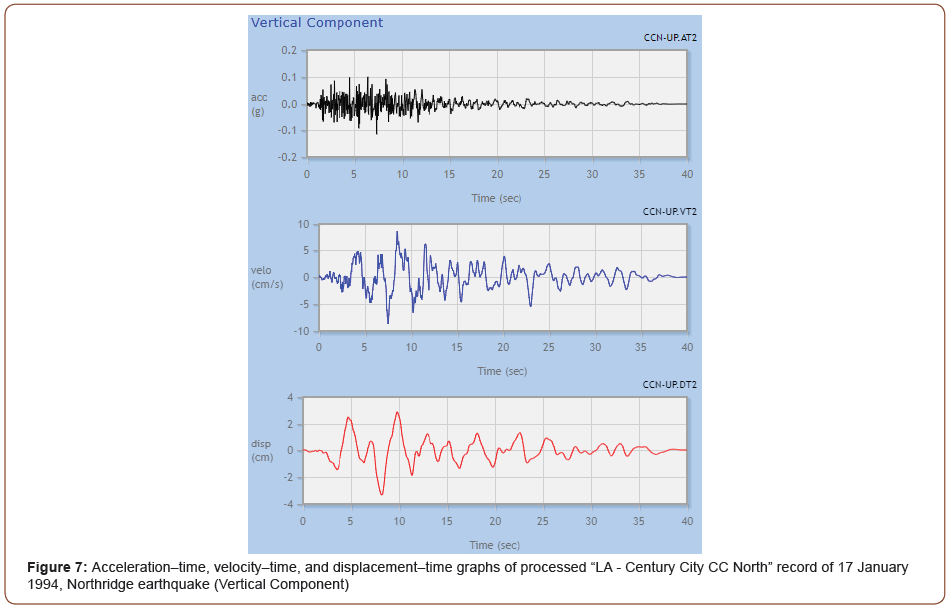
Figure 7 shows the unscaled time series of the Northridge earthquake record (Vertical Component) (Figure 7).
In the current research, the dynamic analysis was carried out using two different records of load time histories. Figures 8 and 9 demonstrate the two records of the load time history (LACC_NOR-1. TH) and (LACC_NOR-2.TH), respectively (function graphs in the X and Y direction) (Figures 8, 9).
Results
Figure 10 illustrates a three-dimensional (3-D) view of the steel structure with rubber isolator supports along with the span lengths and story heights (Figure 10).
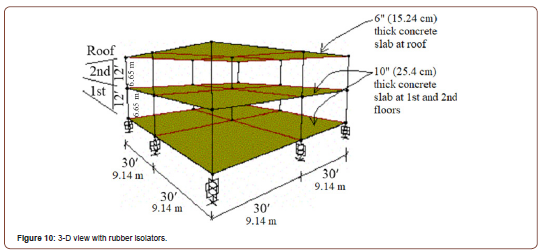
This study analyzed two joints, the center joint on the first floor (joint 13) and the center joint on the roof level (joint 15), to determine their individual displacements and the difference in these displacements.
Figure 11 shows the displacement plot (Figure 11).
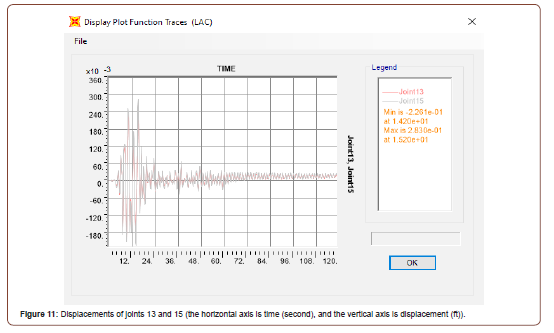
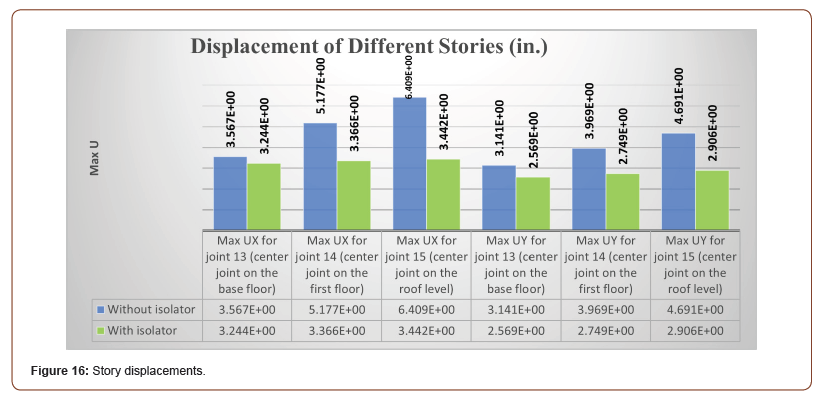
As shown in Figure 11, minimal difference was observed between the displacements, meaning the structure essentially moves as a rigid body on top of the isolators. Figure 12 shows the force-displacement plot (based shear Y) for joint 13 (center joint at the first floor). Base isolators are modelled as link elements in SAP2000 software using the required links element properties for the isolators which are calculated and inputted in SAP2000. The force displacement curve is idealized as a bilinear curve, as shown in Figure 12. From this curve, required data for link properties are input. This procedure was previously used by Saksham & Sambhav [10] (Figure 12).
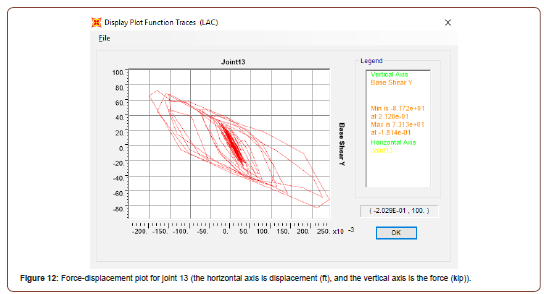
Figure 13 shows a 3-D view and a 2-D view of the structure with fixed supports (Figure 13).

Tables below show results of nonlinear time history analysis of the structure without isolator system as well as data analysis of the structure with isolator system (Tables 1-7).
Table: 1Structural time period for nonlinear time history analysis without and with isolator system.

Table: 2Structural frequency for nonlinear time history analysis without and with isolator system.

Table: 3Design base shear for nonlinear time history analysis without and with isolator system.

Table: 4Base moment for nonlinear time history analysis without and with shear walls.

Table: 5Maximum displacements for nonlinear time history analysis without and with isolator system.
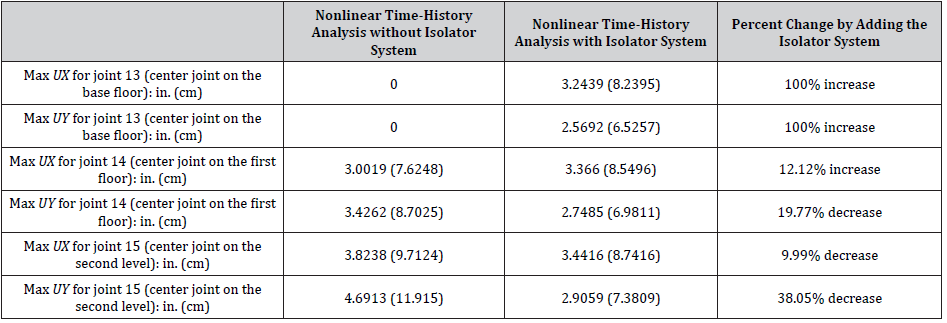
Table: 6Drifts for nonlinear time history analysis without and with isolator system.

Table: 7Structural time period for nonlinear time history analysis without and with isolator system.

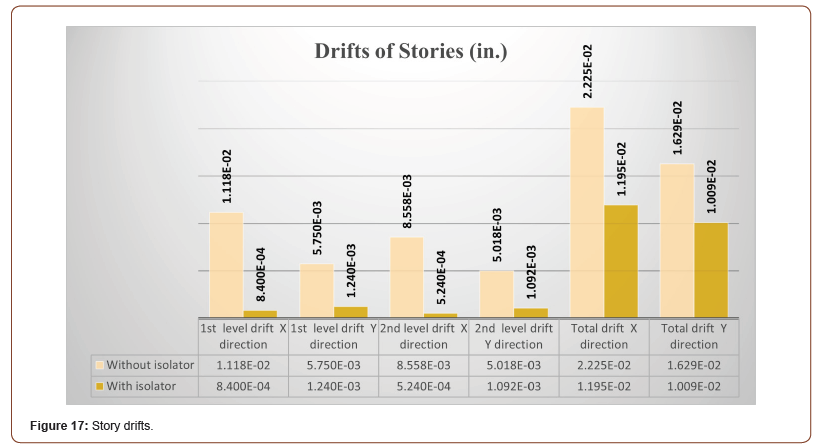
ASCE 7-10 allowable value of 0.025hsx=0.025×12×12=3.6 in. [12]. Figure 14 shows the deformed shape of the building without base isolation due to the fixed supports (Figure 14).
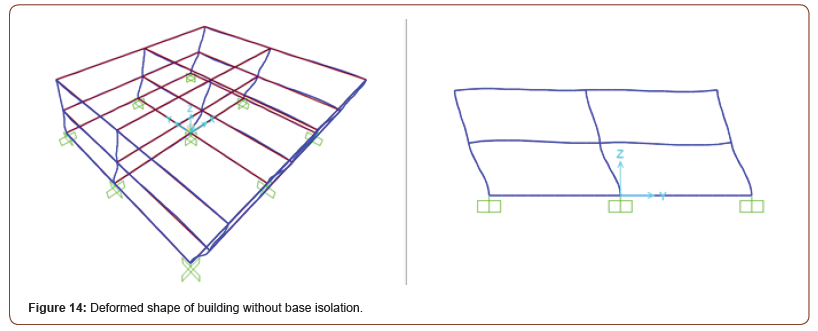
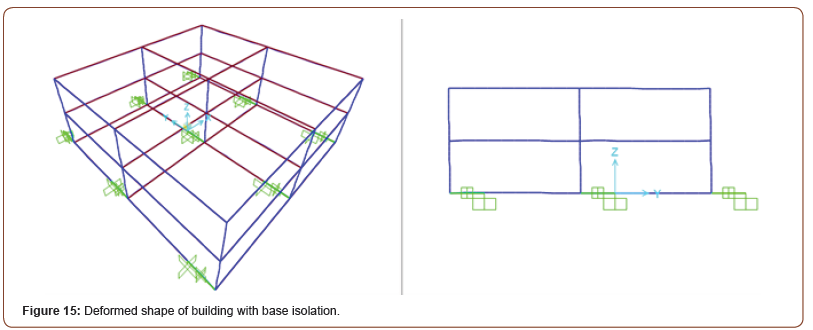
This figure shows that the building without base isolation moved in the same direction (X or Y) but with different values of displacement in three directions, leading to building collapse when subjected to seismic earthquake forces (due to inertia forces). However, use of the base isolation (i.e., nonlinear (NL) link system) led to movement in the same direction at different levels (stories). Base isolation is most effective when used due to reduce displacement, acceleration and base shear at building’s floor due to the dispersal of the shock energy of earthquake loading [8].
Figure 15 shows the deformed shape of the building with base isolation (Figure 15).
Maximum floor displacement, base shear, and base moment in X and Y direction is for the study the response of building under earthquake ground motion. Figure 16 charts the displacement of various stories of the building (Figure 16).
The main purpose of this study (current paper) is to reduce story accelerations and story drifts to the building superstructure due to earthquake ground excitation by installing base isolation devices (base isolators) at the building’s foundation. Figure 17 charts the drifts of various stories of the building (Figure 17).
Conclusions
This study analyzed a structure with and without a baseisolated rubber bearing system to determine their effects on a building’s response to a severe earthquake event (1994 Northridge earthquake). In this study, one structure with different support systems was analyzed to explain the use of base isolation. Structural time periods for various modes increased significantly with rubber isolator systems. In contrast, the structural frequency for various modes, the design base shear in X and Y directions, the base moment in X and Y directions, and the story drifts in X and Y directions decreased significantly with rubber isolator systems. The use of the response modal nonlinear time-history analyses depicted the most accurate behavior of the structure. Nonlinear modal time history analysis is also called Fast Nonlinear Analysis (FNA), which is more meticulous and effective than direct integration time history analysis. Response modal nonlinear time history analysis is conducted because it most accurately depicts the correct structural behavior. Numerical values and maximum percents of increase and decrease have been reported in the paper. Study results also showed that base-isolated rubber bearing systems significantly affect individual framing members and lead to a decrease in structural frequency (up to 86.4%), design base shear (up to 99.74%), base moment (up to 99.81%), and story drifts (up to 95.93%), as well as the increase in the structural time period (up to 635.29%). It should be noted that maximum story drifts often govern the design according to most building codes.
Acknowledgment
None.
Conflict of Interest
No conflict of interest.
References
- Felber Andreas J (2017) Applied Time History Processing and Interpretation: Strong Motion Record Manipulation for Dynamic Analysis with Tips and Tricks for Data Evaluation. Vancouver, British Columbia: EDI Experimental Dynamic Investigations, Ltd.
- Lee, Dong-Guen, Jang-Mi Hong, and Jinkoo Kim. 2001. “Vertical Distribution of Equivalent Static Loads for Base Isolated Building Structures.” Engineering Structures 23 (10): 1293–1306.
- Noorie, Jahed. n.d. “Push Over Anaysis.” Academia.edu - Share Research.
- Amiri, Saeed, and Aram Sorooshian. 2017. August 9, 2017.
- Schueller Wolfgang (2009) Building Support Structures: Analysis and Design Using SAP2000 Software. Berkeley, CA: Computer and Struc- tures, Inc, USA.
- Chowdhury, Arman. 2013. “Evaluation of Structural Implication of Incorporating Base Isolator as Earthquake Protection Device.” IOSR Journal of Mechanical and Civil Engineering 8 (1): 27–30.
- Sayed-Ahmed, Mahmoud. n.d. “BUILDING WITH BASE ISOLATION TECHNIQUES.” Al-Azhar University Engineering Journal, JAUES 7 (Dec. 2019).
- Chowdhury, Arman. 2013. “Evaluation of Structural Implication of Incorporating Base Isolator as Earthquake Protection Device.” IOSR Journal of Mechanical and Civil Engineering 8 (1): 27–30.
- Ambasta, Swapnil, Dushyant Sahu, and G.P. Khare. 2018. “ANALYSIS OF THE BASE ISOLATED BUILDING (LEAD PLUG BEARING) IN ETABS.” International Research Journal of Engineering and Technology (IRJET) 05 (01 Jan-2018): 404–10.
- Saksham, Jain, and Gangwal Sambhav. 2017. “Assessment of Seismic Response Analysis of Base Isolated RC Building Frame.” International Journal of Science and Research (IJSR) 6 (4, April 2017): 1396–1402.
- Zad, Nader, and Hani Melhem. 2021. “A Parametric Study on the Effects of Shear Wall Locations in a Typical Five-Story Reinforced Concrete Structure Subjected to a Severe Earthquake.” Current Trends in Civil & Structural Engineering 7 (5): 1–15.
- Zad, Nader, and Hani Melhem. 2021. “A Parametric Study on the Effects of Shear Wall Locations in a Typical Five-Story Reinforced Concrete Structure Subjected to a Severe Earthquake.” Current Trends in Civil & Structural Engineering 7 (5): 1–15.
- 12. Minimum Design Loads for Buildings and Other Structures (2013) Res- ton, VA: American Society of Civil Engineers, USA.
https://doi.org/10.5459/bnzsee.33.3.209-221.
https://doi.org/10.1016/s0141-0296(01)00031-1.
https://www.academia.edu/34984492/Push_Over_Anaysis.
http://www.rbsee.ir/index.php/rbsee/article/download/201/157.
https://doi.org/10.9790/1684-0812730.
https://www.researchgate.net/publication/338331798_Analytical_Behavior_of_Multi-Storied_Building_with_Base_Isolation_Subjected_to_Earthquake_Loading/link/5e0d14f192851c8364ab86c9/download.
https://www.irjet.net/archives/V5/i1/IRJET-V5I187.pdf.
https://www.ijsr.net/get_abstract.php?paper_id=ART20172625.
-
Nader Zad, Hani Melhem. Response Modal Nonlinear Time-History Dynamic Analyses of the Northridge Earthquake of a Two-Storied Steel Structure with Rubber Isolator and Fixed-Base Systems. Cur Trends Civil & Struct Eng. 8(2): 2021. CTCSE. MS.ID.000683.
-
Modal, Nonlinear, Time History, Dynamic Analysis, Northridge, Steel Structure, Rubber Isolator Systems, SAP2000
-

This work is licensed under a Creative Commons Attribution-NonCommercial 4.0 International License.


