


 Review Article
Morphometric Indicators Analysis of Relief for the Engineering Design Problems
Received Date: March 25, 2019; Published Date: April 17, 2019
Abstract
In the practice of engineering design, the most demanded morphometric indicators of the relief, such as the average slope of the territories and the general slope of the entire territory. Based on these indicators, decisions are often made on the acceptability (adequacy) of a project for a selected territory. The article presents a comparative analysis of the existing methods of triangulation and spatial interpolation of the relief based on primary sources. The selection of primary source data is based on a rectangular regular network, which is applicable in the practice of engineering preparation of territories to various tasks of vertical planning. The reasonable problem points of the preliminary relief analysis are given for making optimal decisions on the existing methods of the digital relief model. In this regard, a new method of morphometric analysis of the relief was proposed, based only on the primary data, regardless of the choice of the method of triangulation and spatial interpolation. New definitions are given, such as: the quarter of the surface, which is a unit of the selected territory and the plane of the quarter, based on the average values of the source data of the quarter. On the basis of the proposed method, the “Geoanalyzer” software complex has been developed and some program modes of operation are given that help to visually and numerically analyze the topography of the selected territory.
Keywords: Relief; Triangulation; Spatial interpolation; Morphometric characteristics of a relief; A quarter of a relief surface; A plane of a quarter; A slope vector
Introduction
In most of the tasks of engineering preparation of territories, digital terrain models (DTM) are in demand, which contribute to a preliminary analysis of the terrain and the adoption of optimal decisions among a variety of options. One of these conditions of preliminary analysis are indicators of the formation of a surface stack of water. As is known, the initial data for the construction of the DEM for the tasks of engineering preparation of territories are the spatial coordinates (x, y, z) of known relief points-sampling points defined on a rectangular regular data network. Based on known points, triangulation and spatial interpolation is performed. The essence of the problem is that the construction of triangulation on the initial set of points is ambiguous [1; p.8]. With the same source data, there are different variants of triangulation (Figure 1a). With an increase in the amount of input data, triangulation variants increase proportionally (Figure 1b). Most of the Delaunay triangulation methods on the efficiency of algorithms [1,2] have been studied, which indicates the progressive development of this task [3] (Figure 1).

There is also the problem of spatial interpolation. The task of spatial interpolation is to obtain (with the minimum possible error) the values of the spatial variable Z under study at arbitrary points in the study area based on processing and analyzing its values measured in a limited number of sample points [4]. The program Surfer-15 presents 12 methods of spatial interpolation. Some of them are shown in Figure 2.

Consequently, spatial interpolation methods are an approximation of the natural relief and are themselves the object of research. Different methods of spatial interpolation lead to different morphometric indicators of the relief, which indicate the ambiguity of the analysis for the same area. The vector indicators of the slope of the plots with identical initial data are different (Figure 3A-E) and contradictory in their comparison (Figure 3F) (Figure 3).

In connection with the above problems, there is a tendency in the integrated assessment of land resources based on the processing of geospatial data [5,6], which indicates a multi-factor approach to the analysis of the relief. A new method of geometric modeling of the relief is proposed, based on the plane of the average slope over the sections and the plane of the average slope of the whole territory. The definition of the average slope line [7,8] allowed the definition of the average slope plane [9]. The development of the theoretical foundations of the degree of complexity of the relief [10,11] was the prerequisite for determining the relief area as a quarter [10]. The developed software package “Geo-analyzer” is based on the software application “The complexity of the relief” [12]. The core of the program for constructing isolines was the “Test Tri_Dll” program [13].
Basic Definitions
‘The program “Geo-analyzer” works on the basis of primary source data, measurements of the terrain, calculated on the basis of a rectangular regular network:

Definition 1
Nine adjacent nodes of a regular 3 × 3 network is called a quarter, which consists of four cells, called a quadrant.

The main geometric characteristics of the surface quarter of the relief include the following:
a. the spatial position of the plane of the quarter;
b. the vertical angle of inclination of the plane of the quarter relative to the horizontal plane;
c. the slope line and the position of the slope vector.
Definition 2
A plane drawn from the average values of the source data of the quarter is called the quarter plane. Finding the position of the slope vector means determining the coordinates of the beginning and end of this vector with a view to its subsequent visualization in digital models. The beginning of the vector is in the center of gravity of the plane, and its end is directed perpendicular to the horizontal wake of the plane.
Offered Algorithms
By definition, the plane of the quarter passes through the point ΔZкв - the average value of the source data of the quarter:

The coordinates of the ΔZкв point are the coordinates of the center of the quarter (ΔX, ΔY). The orthogonal projection of the point ΔZкв onto the horizontal plane is the point ΔZ’кв. To determine the plane of the quarter, in addition to the ΔZкв point, it is necessary to determine the position of two more points of this plane. Let a profile cross section of the relief be given in the form of a linear matrix defined by the line Si and the column Cj of the matrix (1):

Linear approximating functions of the data represented by this line and a column are searched as

respectively. The coefficients a’, b’, a, b of these functions are determined using the method of least squares by solving the following systems of linear algebraic equations:

For the sake of simplicity, we will consider the first quarter of the relief (1). The average values of the elements, for example, row S1 and column C1 of this quarter are respectively


The average values of all the rows and columns of the quarter under consideration form the row U and the column V, which define the corresponding flat curves u and v (Figure 4):

The u, v curves are approximated by linear functions of the form

The system of equations (6) for determining the coefficients of these functions takes a simpler form:

Graphs of linear functions (9) pass through the points corresponding to the average values of rows and columns of the quarter (Figure 5).


For k = 2, the equations of system (9) have the same solutions. This means that the straight lines defining the average slopes of the rows and columns have a common point of intersection and form a plane. It is easy to see that the Z coordinate of the intersection point of these lines is equal to ΔZкв - the average value of the source data of the quarter. Thus, this plane is the plane of the quarter, drawn from the average values of its rows and columns, and determines the overall slope of the quarter surface. To determine the equation of a quarter plane, it is enough to have the coordinates of three points that do not belong to one straight line. As these points, choose the points Q, R, ΔZкв (Figure 6):
Thus, the equation of the plane of the quarter is

where 
 .
.
Equation (11) allows you to determine the line of the slope, as well as the line of greatest slope in the form of an arrow of the slope vector, indicating the direction of the slope of the plane.
The algorithm for determining the slope vector consists of the following steps.
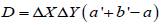
1) Finding the horizontal trace of the quarter plane as a solution to the problem of intersection of the quarter plane and the horizontal plane passing through the level z = 0:

2) Determination of the horizontal plane of the relief, passing along the level Z = ΔZêâ2 , necessary for the visualization of the arrow within the boundaries of the quarter (Figure 7):


Here D2 is the free term, different from that in equation (12);

where; d is the distance from ΔZ’кв to the horizontal trace,
equal to 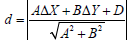
In the practice of engineering design is usually ΔX = ΔY.
3) The mutual intersection of the horizontal (13) and the perpendicular drawn through the ΔZ’кв point determines the point of their intersection:

Thus, the slope vector Vск determines the equality

Experimental Conclusion
The “Geoanalyzer” program produces visualization of the formation of surface water runoff (Figure 8-a), a cartogram of the slopes of the relief (Figure 8-b), as well as inclination angles tan α (Figure 8-c) (Figure 8).

Conclusion
The ‘Geo-analyzer’ program allows the user to perform a preliminary visual analysis of various terrain areas and select optimal solutions among the many options for the vertical planning project in tasks related to water disposal as well as in choosing the optimal route for dislocation, taking into account the ruggedness of the terrain. Based on the developments, a certificate of official registration of the program “Geo-analyzer 1.0” to the Agency for Intellectual Property of the Republic of Uzbekistan [14] was received.
Acknowledgement
None.
Conflict of Interest
No conflict of interest.
References
- Skvortsov AV, Mirza NS (2006) Algorithms for constructing and analyzing triangulation. Tomsk: Izdvo Tom University p 168.
- Skvortsov AV, Kostyuk Yu L (1998) Effective algorithms for constructing Delaunay triangulation Geoinformatics. Theory and practice. Tomsk: Publishing house Tom. University 1: 22-47.
- Ishenko AV, Kireev (2009) Algorithm for constructing two-dimensional nested grids. Journal of the Siberian Federal University. Mathematics and physics 2(1): 83-90.
- Maltsev KA, Mukharamova SS (2014) Building models of spatial variables (using the Surfer package). Tutorial Kazan: Kazan University p.103.
- Maglinets Yu, Raevech K, Tsibulskii G (2018) Architecture of the information system of evaluating of the land resources based on processing of spatial data. Journal of Siberian Federal University. Engineering & Technologies 11(1): 52-60.
- Maglinets Yu, Tsibulskii G, Noskov M (2016) Current trends of development of the regional systems of earth remote sensing. Journal of Siberian Federal University. Engineering & Technologies 9(7): 1012- 1018.
- Khaitov BU (2015) On a geometric method for determining the line of the total slope of a flat curve. Young scientist: Monthly scientific journal Kazan 10 (90): 340-342.
- Khaitov BU (2016) Graph-analytical method for determining the line of the total slope of a flat curve. Technical sciences: theory and practice. Materials III international scientific. conf. - Chita: Young scientist p.137- 139.
- Khaitov B (2016) Graphic-analytical method of relief plane definition. Landscape architecture and regional planning. Science Publishing Group 1(1): 13-17.
- Khaitov BU (2018) Determination of the complexity of the relief for engineering design problems. Internauka. Science Magazine M Internauka 7 (41): 62-64.
- Kheifets BS, Khromchenko AV (1978) The use of information theory to assess the degree of dissection of the terrain. University news. Surveying and Aerial Photography. Moscow 4: 13-23.
- Khaitov BU (2010) Digital terrain modeling for design. Modern problems of agriculture and water management: Collection of works of the IX scientific conference. Tashkent, TIIM p. 7-19.
- Triangle, polygons and other algorithms. Сайт: http://achawk.narod. ru/index.html#begin (05.01.2019)
- Certificate of official registration of the computer program “Geo-analyzer 1.0” in the Agency for Intellectual Property of the Republic of Uzbekistan (№ DGU 06083 от 08.02.2019).
-

This work is licensed under a Creative Commons Attribution-NonCommercial 4.0 International License.


