 Review Article
GIS and Processing data with SIMUS
Nolberto Munier, Valencia Polytechnic University, Spain.
Received Date: July 27, 2020; Published Date: August 12, 2020
Abstract
This is a case with a real structure from a road project in Africa, but with data changed for confidentially reasons. The purpose of this paper is to demonstrate how a powerful tool such as the Geographic Information System (GIS), may be used jointly with a Multi Criteria Decision-Making (MCDM) method. This problem is addressed using both methodologies in two different and sequential steps, when the first precedes the second. Thus, GIS produces information regarding consideration spatial interrelations of all features considered. The MCDM uses that information aiming at the selection of the best alternative. In this case, GIS provides spatial information on a certain area combining about 15 different themes involving environment, social and natural features such as villages, rivers, forests, swamps, etc. Four potential paths where detected, subject to these mentioned features, and then, the selection of the ‘best’ path was implemented by a MCDM method. To analyze robustness of the result, a sensitivity analysis was also performed.
Keywords: GIS; SIMUS; Routes; Integration; Spatial features; Sensitivity analysis
Background Information
The purpose of this paper is to show how spatial data obtained by GIS (Geographic Information System), can be used in MCDM (Multi Criteria Decision-Making) problems. Therefore, two technologies were used; GIS to analyze interaction between the different characteristics or themes in an area, and from them, a MCDM method to select the most appropriate use of land regarding a project. It is assumed that the reader has some knowledge of GIS, which in path road selection is used as a research strategy, to determine the potential sets of paths. We are no detailing in this work the GIS structure or its workings but looking for the interaction between GIS and a MCDM method, especially in the determination of a path for a highway. Both methodologies work in a very close link in determining the most convenient path for a route. There is a good deal of papers about the uses of GIS and MCDM methods working together, especially on land use, but very few related to determination of a path, when the terrain is occupied by different and varied land use, that constitute restrictions or impedances for building a road, such as population, farms, protected areas, etc. Normally, not all layers or themes have the same significance, and thus, it is common in this type of analysis to make a subjective estimate of their importance. The problem is its inaccuracy and the dependency on the person doing the appraisal, and which may conduct to false results. Some methods such as Arc GIS use the criteria weights from the Analytical Hierarchy Process (AHP) [1], a well-known MCDM method, other use an algebraic analysis, and others estimate weights by experts, however, all of them are subjective, and because of that debatable and uncertain. In this work we use no weights, therefore, no subjectivity is present. This is the main difference with the above-mentioned procedure, and as far as this author knowledge never addressed before. We use here the SIMUS method (Sequential Interactive Modeling in Urban Systems) [2], since it works without weights, but not ignoring criteria relative significance. The latter is accounted for by an internal and automatic calculation based on inputted data, therefore, the method is completely objective, and no matter how many experts address this issue, the importance of the criteria remains constant, Citation: Nolberto Munier. GIS and Processing data with SIMUS. Cur Trends Civil & Struct Eng. 6(1): 2020. CTCSE.MS.ID.000631. DOI: 10.33552/CTCSE.2020.06.000631. Page 2 of 6 as we understand the real-world is. The method is grounded on vector algebra, and the selection of options, in this case the election of the best route, is done through the economic concept of cost of opportunity. Another difference with more traditional methods is that we suggest an objective methodology to assess robustness of the solution, since it is also based on objective data.
The case
The case relates to the simultaneous consideration of ground features or themes between two cities A and B, separated by 102 km as the crow flies, in an African country, to determine the best route for a highway to link them. In such a distance there are villages, swamps, forests, wild-life, farms, etc. Each of these areas may be an obstacle or impedance to build the highway, because it can’t pass or intrude through them, as in protected areas, or pass very close to villages, or close to native cemeteries or archeological ruins. In other cases, the highway can infringe an obstacle, producing and accepted damage, or by a horizontal or vertical alignment, or negotiate it through engineering constructions, by way of bridges, viaducts, tunnels, overpasses, etc., which of course, increase costs. In most cases buffering is necessary to protect some safety margin. These buffers guarantee that the route will be off, and at a certain minimum distance, of villages, sacred places or national parks to preserve their identity and avoiding disturbance for people and wildlife. In addition, a theme may occupy diverse parts of land, or be only in one place, or mixed with other features. For instance, a forest in the shores of a small lake is protected and as thus can’t be penetrated, but the lake can be spanned. If this is complicated with one or two features, it becomes much more difficult when there are many different characteristics between the two cities along the 102 km between them, that need to be combined graphically. The objective of the work is to find the best route between the two cities, as short as possible, and at the minimum cost. This is done observing which are potential paths between A and B that allow construction of a road, by combining these ‘void’ spaces between impedances, and sometimes overriding them in a little extent. This allowed overriding must be of course considered from the beginning. For instance, environmental authorities can say that only a narrow stripe of land at the Center East of the forest can be used, but also establishing limits, in length and width, along with other restrictions, for instance in maximum speed along it. The engineering plan, including ancillary civil, mechanical, and electrical constructions, is based on the idea that it is a necessary first step in all planning, to study the location and adjust the planning to it.
http://ratt.ced.berkeley.edu/tool_time/suitability_analysis/ suitability_analysis.html
A very costly real example of not adjusting the planning the realities of a scenario, can be seem in Christensen [3]. This paper follows these steps: Introduction, a second step with a brief description of the GIS system. In a third step the information from GIS is inputted into the MCDM methods and solved. In a fourth step results are analyzed including a sensitivity analysis, and finally there is a conclusion.
Using GIS to Build a Composite Map of the Area
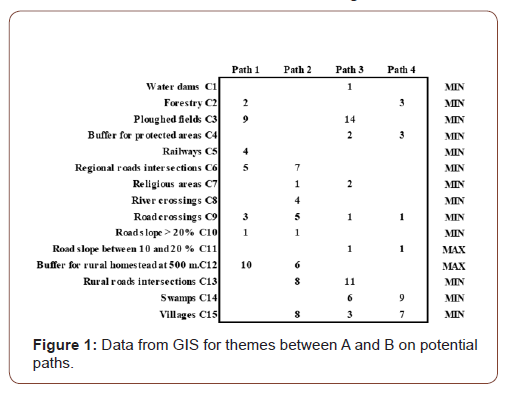
It allows building a raster mosaic of the terrain between the two cities, and then visually determining the potential paths between A and B. Naturally, this selection is based in trying to find as much as possible straight paths and considering features that are in each one. Thus, the problem boils down to finding the best and cheapest progression of void spaces, with a minimum use of some impedances. The process starts with topographic maps of the whole area, converted to vector themes and then to raster maps using appropriate GIS software. From superimposing the 15 levels, total information on the area was obtained. In this road project, it wasn’t known how many paths or alternatives routes could be identified between A and B; this information came from the analysis of the GIS integrated map. From its examination is was possible to select 4 possible paths, looking at the areas than are free of encumbrances or impedances, or ‘void’ spaces, and/or that surpass areas or features that are not very sensitive, and admit a certain disturbance. This is clearly shown in GIS because each theme has a different color. Since the area is very close to the Equator and the relatively small distances involved, the buffers are designed using planar instead of geodesic distances, to consider the Earth curvature. This is the normal procedure in transportation engineering. From here, it was possible to have a count or a percent of the magnitude of each impedance, as well as an idea of their relative length, costs, maintenance costs, speed, etc. This is the kind of data needed to build the initial decision matrix, as shown in Figure 1.

Positive values represent the number of impedances, and zero values indicate their absence. For instance, 8 villages were counted in path 2, 3 villages in path 3 and 7 villages in path 4, while none in path 1. A visual inspection suggested that two potential best alternatives could be paths 1 and 4, considering the amount of void spaces. However, this is only a subjective appreciation, because their areas are not the same, and it is incomplete, due to the fact that there are other aspects that were not considered in GIS, such as engineering estimates for the potential paths. In addition, not all the themes or layers have the same relative significance, and then their relative importance needs to be assessed. This is normally done using pair-wise comparisons between layers however, this procedure and evaluation is subjective, and consequently, it has a relative worth. Therefore, there is need for a procedure based on real data and independent of subjective estimates, and that also considers technical or engineering aspects, such as maximum speed, distances, topographic characteristics, costs, noise, etc. This is the field of MCDM, a mathematical discipline with different procedures that process information and gives results, which constitute a solid ground, based on which the decision-makers can reach rational and documented conclusions. The word ‘documented’ is principal in this process, not only for checking the validity of the result, but to give stakeholders solid arguments that support a decision. It is not the objective of this paper to develop the theory and use of the GIS. A very simple and understandable explanation of the GIS system applied to road path selection can be found it Alhamadani [4]. Also, Warner et al [5] present a very illustrative case on selection of two sections of overhead lines. Ahmed [6], produced a paper on an actual work which explain, almost as a manual, the successive steps for performing the GIS.
Using MCDM to Select the Best Route
It starts with the initial decision matrix and uses an algorithm that determines the most convenient solution or path, considering that a path may be very good on some layers but bad in others. This is repeated in all paths, and then the problem transforms in a very difficult undertaking. It is not possible to find an optimal solution, normally because conflicting layers (called criteria, in MCDM parlance), therefore, all MCDM methods look for a compromise solution that satisfies most criteria. Normally, the path that satisfies more criteria is the best.
Construction of the initial matrix with GIS data- The SIMUS method
The procedure starts by building the initial decision matrix, with the 4 different potential paths in columns, while the 15 themes are in rows. At the intersection of a column for instance Path 2 with a row, there is a number that indicates for instance, the number of ‘River crossings’ (4) along it. For the same column or path, it may exist a cell corresponding for instance to theme ‘Ploughed fields’ that is blank, indicating that for this path, and related with that theme, there are no impedances. The whole area is divided in 4 horizontal zones or stripes 25 km wide in the A to B direction, and each one analyzed separately, but processed conjointly. In this way, the best path in the first stripe will connect with the best stripe in the second and so on. Consequently, in the initial matrix we have:
For criterion C1 (Water dams), there is only one dam in path 3, and none in the others.
For criterion C3 (Ploughed fields), GIS tell us that along the whole A to B distance there are 9 for path 1, and 14 for path 3.
In criterion C15 (Villages), there are 8 in path 2, 3 in path 3 and 7 in path 4, and so on.
In this way, all the characteristics of the A-B scenario are jointly represented by criteria. These quantities come from the GIS analysis; therefore, we have reliable and quantitative information.
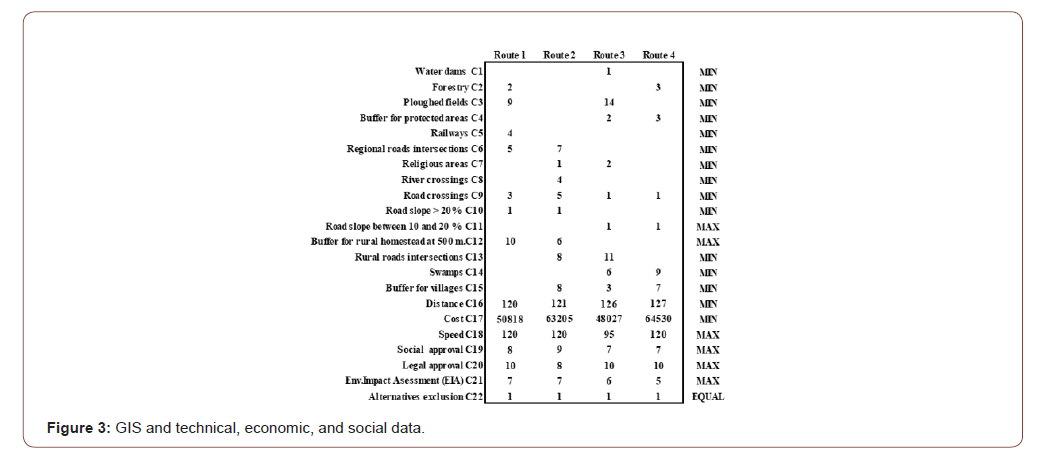
However, qualitative information can also be inputted in the initial matrix, as depicted in Figure 3 in criteria C19 and C20.
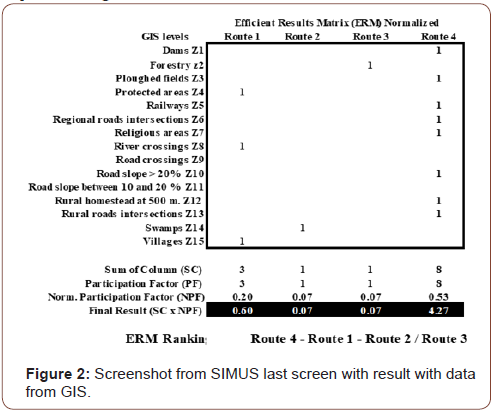
This information is then electronically loaded in Excel as depicted in Figure 2.

All criteria call for minimization except C11 (Road slope between 10% and 20%), which is to be maximized.
Figure 2 has the same structure as Figure 1, however, in lieu of criteria there are objectives (Zi). Objectives are the mapping of criteria and are an output of the problem. They are responsible for the selection. The score for each alternative is found in the solid black row, while the ranking is shown below.
It can be seen that each alternative does not satisfy all objectives; for instance, road 1 satisfies only Z4, Z8 and Z15. In turn, each objective is formed by one or more criteria, and this relationship is given by the so-called Dual Problem of Linear Programming, and can be seen in the last screen of SIMUS, however, it is not shown here because readability reasons, since it is, in this case, a matrix with 15 objectives and 15 criteria. The result is shown in the solid black row, and indicates that route 4 is the best, followed by route 1 and by routes 2 and 3 with equal score (Figure 2).
Figure 2 shows that for each layer or criterion there are occupied and empty cells corresponding to the four potential routes. If we introduce into the initial decision matrix the six additional technical criteria, we obtain Figure 3.
Therefore, the ranking is Route 4 ≽ 1≽ 2=3.
The symbol ‘≽’ means ‘Preferred to’.
Construction of the initial decision matrix adding engineering, social, environment and economics data (in general, named as ‘technical or exogenous data’)
The computation of Section 2.1 considers only data from the GIS, that is, something that already exists, and as a function of it, it is possible to get an idea of the potential paths between A y B, which is the outcome needed. However, there is more data that has to be added pertaining to engineering, social, environment and economic data, and based on this preliminary assessment of routes. It is data inexistent at present, but that when introduced, will most probably modify the current status of the scenario, as happens with any new project. For instance, from the environment point of view it will certainly modify the present landscape, with inevitably damage to it, in a greater or lesser degree. From the social point of view, it is necessary to have the approval of people that in one way or the other will be affected by the project. This effect can be materialized in noise production because the traffic, in disturbing and even impeding a transboundary elephant corridor, or blocking a path for daily trip of wildlife to water reservoirs, etc. The most knowledgeable people about these issues are the people living close the highway paths, and then, they must be consulted. Therefore, the initial decision matrix has to consider these issues, on top of those from GIS. This is reflected in Figure 3 (Figure 3).
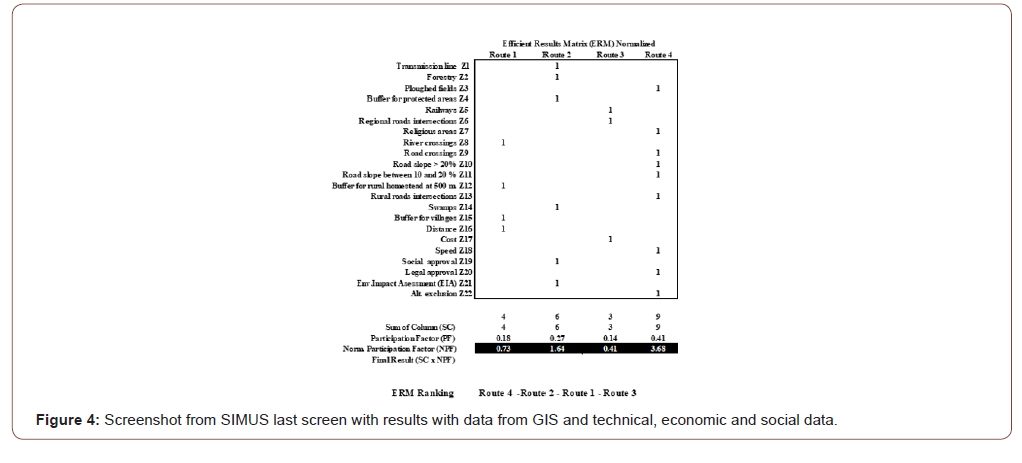
Notice the last criterion ‘Alternatives exclusion’. It refers to the fact that it is necessary to select only one convenient path, and then, precluding others. However, a ranking between them is necessary because, if it is true that the selected path will be the most convenient, there is no guarantee that it is robust or stable and might eventually be replaced by other. This is analyzed in Section 3. Figure 4 shows the final screenshot for this enlarged matrix (Figure 4).


The ranking is in this case: Route 4 ≽ Route 2 ≽Route 1 ≽ Route 3
Analysis
Figure 3 shows the result by SIMUS when only information from GIS was considered. If we neglect the scores for routes 2 and 3 due to their low values, the ranking will be reduced to Route 4 ≽ Route 1. Figure 4 shows the result by SIMUS when GIS and technical data are combined; the ranking is then: Route 4 ≽ Route 2 ≽ Route 1 ≽ Route 3, and all of them with significant scores. There is a reversion in the previous ranking, when Route 1 preceded Routes 2 and 3. In the new ranking notice how Route 2 has increased its score from 0.07 to 1.64, while Route 1 has also increment from 0.60 to 0.73, and Route 3 from 0.07 to 0.41, however, this last one keeps being the least preferred. It is interesting to find out why Route 3 is the least preferred. It can be seen in Figure 3 that this potential path has a large number of ploughed fields (14), large number of rural intersections (11), and one of the largest distances (126) between A and B. However, its cost in the smallest. Notice also that the potential speed is the lowest, which is attributable to its topography. This indicates the importance that the technical criteria have in the selection, and evidences the need to complement the very important information provided by GIS, which represent the status of the region as it is at present, with its status when significant anthropogenic activities take place, modifying the landscape.
Sensitivity Analysis
The sensitivity analysis aims at determining how sensible is the result found (starting with the best path), to variations of some parameters, normally the layers or themes. Since this selection depends on these elements it is fundamental to determine this dependency. For instance, there could be periodical variations of the course of some rivers and creeks in flows and directions, that may affect the highway because they can have an impact on the foundations of a bridge or viaduct or even flood it. Consequently, it is important to determine, based on historical data, what is the maximum flow and level that a river can reach and with which frequency. Is this level if well beneath the bridge, then there is leeway for the phenomenon occur without damaging the bridge structure, then, it can be said that the criterion ‘River crossing’ is not important. But this analysis must be done for each of the criteria that intervene in the selection. There could be other criteria that could affect the structure, and the margin of all of them must be consider jointly. In this case, we begun studying Route 4 and found that criteria C18 and C20 have very little or not leeway. For instance, C18, that is speed, calls for maximization, however it has no margin, meaning that an increase in the maximum speed can cause a reversal in the ranking. This could be because the high speed may produce too much noise that can alter some villager’s life, even with the buffering, or even not adequate for the road structure due to the terrain. The same for C20 (Legal approval), that also calls for maximization; it does not have any margin. This last one is very important because there could be legal actions from farmers, that feel threatened by the highway, because for instance, it will cut direct access to cattle to water sources. Both C18 and C20 have to be considered simultaneously. Consequently, the solution found for Route 4 is the best, but very sensitive to variations. It then makes sense to analyze Route 2 which is the second best. There are 4 significant criteria here, C5, C18 and C4. None of them have any leeway either, however, they correspond to issues that are not unpredictable, and then manageable.
They are: C5 (Railways crossings). No future plans are envisaged for this element.
C18: Speed. It is not foreseen any further increase in speed.
C4: Buffers to protected areas. Does not seen as a problem, and in any case can be increased during construction. Therefore, it appears that Route 2 should be selected as the best.
Conclusion
An actual problem has been formulated consisting in the construction of a highway between two cities and determining which is the best route among several. It is addressed using two tools: GIS to determine potential routes combining all features, and SIMUS to select the best path.
In this proposal there are three definite different important features, regarding other MCDM methods than can be used to solve this scenario.
1) No pair-wise comparisons between themes is done for determining their relative subjective weight. Therefore, it does not matter who or how many decision-makers participate.
2) A thorough sensitivity analysis is performed considering all intervening criteria simultaneously, and not only one and independently, as in most methods.
3) The SIMUS method employed, guarantees that there are not rank reversals, which can happen in other methods if a new path is added or deleted or if two paths are very similar,
The result identifies Route 4 as the best, followed by Route 2, and this is a mathematical result in which the DM has had no participation in inputting the initial data. Therefore, with SIMUS result which is purely objective, the DM analyzed but not accepted it, not because he assumes that it is wrong, but because it is extremely sensitive to some important parameters, and then, any variation in them can reverse the result. For this reason, he selects Route 2. In is important to mention that this rejection is based on his analysis and that he has quantifiable elements to justify his decision when informing the stakeholders.
This case shows that, following the SIMUS procedure of not interfering with initial data, the DM applies his knowledge, expertise and information given my the method, to select the second route as the best one, and thus demonstrating that the output is consequence of a sound algorithm, but the final decision is based on his appraisal.
Acknowledgement
None.
Conflict of Interest
No conflict of interest.
References
- Saaty TL (1980) The Analytic Hierarchy Process: Planning, Priority Setting, Resource Allocation, McGraw-Hill.
- Munier N (2011) Tesis Doctoral Procedimiento fundamentado en la Programación Lineal para la selección de alternativas en proyectos de naturaleza compleja y con objetivos múltiples Universidad Politécnica de Valencia, Españ
- Christensen B (1995) Too Good to Be True: Alcan's Kemano Completion Project.
- Alhamadani Z (2006) Road Path Selection Using Geographic Information System GIS Article in University of Baghdad Engineering Journal.
- Warner L, Diab R (2002) Use of geographic information systems in an environmental impact assessment of an overhead power line-Impact Assessment and Project Appraisal 20(1): 39-47.
- Ahmed N, Asmael N (2007) A GIS-Assisted Optimal Urban Route Selection Based on Multi Criteria Approach The Iraqi Journal for Mechanical and Material Engineering, Special Issue.
- Dawwas S (2005) GIS as a Tool for Route Location and Highway Alignment – Master Thesis An-Najah National University Faculty of Graduate Studies.
-
Nolberto Munier. GIS and Processing data with SIMUS. Cur Trends Civil & Struct Eng. 6(2): 2020. CTCSE.MS.ID.000631.
-
GIS, SIMUS, Routes, Integration, Spatial features, Sensitivity analysis
-

This work is licensed under a Creative Commons Attribution-NonCommercial 4.0 International License.


