 Review Article
Effectiveness of Cape Seals on Asphalt Pavements
Peter Sebaaly1*, Elie Hajj1 and Dean Weitzel2
Department of Civil Engineering, University of Nevada, Reno, USA
Department of Civil Engineering, University of Nevada, Reno, USA
Engineering Consultant, Reno, USA
Peter Sebaaly, Pavement Engineering and Science Program, Department of Civil Engineering, University of Nevada, Reno, NV 89557, USA.
Received Date: April 12, 2019; Published Date: April 30, 2019
Abstract
With the continuous limitations in budgets for pavement preservation and maintenance, Nevada road agencies expressed interest in learning about the performance of cape seal treatments with either a slurry seal or a micro surfacing, and their abilities to extend pavement life at the least cost. Accordingly, this study evaluated the long-term performance of cape seals that have been constructed in Northern Nevada during the past 15 years. Among the six factors that were evaluated (construction, materials, traffic, structure, environment, and pre-PCI), only the pre-PCI value (i.e., PCI value prior to the application of cape seal) had a significant impact on the long-term performance of the cape seals. Micro surfacing cape seals exhibited very consistent long-term performance regardless of the conditions of the existing pavement as expressed by the pre-PCI level. This was shown by the narrow range of the final PCI values of all micro surfacing cape seals of 70-80. The effective performance life of micro surfacing cape seals ranged from 5 years in Incline Village (base elevation of 6,350 feet) to 7 years in the Truckee Meadows (base elevation of 4,400 feet). On the other hand, the effective performance life of slurry seal cape seals was 3.0 and 3.5 years in the Incline Village and Truckee Meadows, respectively. The LCCA indicated that the micro surfacing cape seal is more cost effective than the slurry seal cape seal. Based on the excellent long-term performance and the significantly higher benefit-cost ratio of the micro surfacing cape seals as compared to the slurry seal cape seals, it was recommended to continue the use of the micro surfacing cape seal as a preventive maintenance treatment.
Keywords: Asphalt pavement preservation; Cape seal; Micro surfacing; Slurry seal
Introduction
As long as pavements are subjected to traffic loads and environmental actions, they will experience deterioration and eventual failure. A preventive maintenance program puts pavement engineers and managers in full control of the system’s long-term behavior: to prevent significant failures from occurring. Through preventive maintenance, the agency can decide on the level of service provided by the facility and the length of time prior to a major rehabilitation activity. The fundamental purpose of preventive maintenance is to slow down the deterioration process to avoid significant failures. Typically, the cost of preventive maintenance is 10-15% of the expected cost to repair the ultimate failure that will occur without the application of maintenance activities. For example, national data indicate that every $1 spent on maintaining the pavement surface saves $5 on major rehabilitation that will be required if the maintenance activities are not conducted [1,2]. A major difficulty in implementing a preventive maintenance program is estimating the long-term performance of the applied activities due to their dependency on the specific conditions of the existing pavement and the combination of materials and traffic conditions under which the activities have been applied. In other words, the long-term performance of maintenance activities is highly localized. Therefore, national generic performance models cannot be applied to estimate the long-term performance of maintenance activities on a specific project within a given locality.
Road agencies can learn from the experiences of their neighboring agencies in terms of what works and what does not work for certain types of pavements. However, road agencies should not assume validity of the long-term performance of maintenance activities on their system when based solely on the performance from other locations. This is because each agency has unique materials, traffic volumes and composition, and environmental conditions, which are not uniform even throughout its own roadway system. For example, successful pavement preservation activities in the hotter climate and high traffic volumes of southern Nevada may not be as successful in the colder climate and medium traffic volumes of northern Nevada. Accordingly, public agencies in Nevada have been aggressive in their pursuit of the most costeffective pavement preservation treatments for maintaining their roads. Among the various surface treatment methods, the method of combining a chip seal with a slurry seal or a microsurfacing referred to as “Cape Seal”, has been used extensively over the years. The main difference between a slurry seal and a microsurfacing is that slurry seal uses a standard asphalt emulsion with good aggregates while microsurfacing uses a specialized polymer-modified asphalt emulsion (typically 3% polymer) with high quality aggregates.
Literature Review
Cape seal was originally developed in South Africa by the Cape Province in the 1950’s. It started as a process of applying a hot premix of crusher dust and asphalt binder over a 19-mm seal coat. It was initially used on roads with traffic less than 300 heavy vehicles per day. The modern cape seal process was established in 1957 and was initially introduced into the U.S. in 1977 [3,4]. A national U.S. study stated that a cape seal is applied when the pavement deterioration is greater than a slurry seal or a microsurfacing can be expected to correct and less than the level at which an expensive AC overlay is required [5]. However, cape seal application does have a substantial disadvantage, as it requires the equipment for both chip seal and slurry seal. Another significant disadvantage is that the cape seal application requires a much longer construction time than chip seal, slurry seal, and microsurfacing applications. This disadvantage will result in longer traffic delays, which in many areas may be challenging to deal with. Cape seal has been found to have a treatment life that ranges from about 6 to 15 years [5]. A study for the Texas Department of Transportation concluded that the major factor influencing the performance of the cape seals is the behavior of the underlying chip seal in terms of aggregate loss or insufficient chip seal-pavement bond [3]. The same study also concluded that bleeding and shoving were the most significant distresses associated with cape seals. Therefore, the bond between the chip seal and the underlying layer must be strong enough to avoid shoving.
As for the performance of microsurfacing alone, the National Cooperative Highway Research Program (NCHRP) published a synthesis on the service life of microsurfacing as identified by different state DOT’s, which concluded that the average service life of microsurfacing generally ranges from 6 to 7 years [6]. In the case of slurry seal, a study by Sebaaly et al conducted a performance evaluation and benefit-cost analysis of slurry seals on asphalt concrete pavements [7]. the study concluded that the best performance of slurry seals coupled with the highest benefit-cost is achieved when the first slurry seal is applied between years 3 and 5 after pavement construction and the second slurry seal is applied between year 7 and 9. It can be seen from previous work that the performance life of a cape seal can reach up to 15 years while the performance life of microsurfacing and slurry seal can reach up to 7 and 4 years, respectively. The literature shows a variation in the performance life of cape seals with a significant increase when compared to microsurfacing and slurry seal alone. This paper will examine the performance of cape seals to determine if recent advances in materials and construction have improved its service life.
Objective
With the continuous limitations in budgets for pavement maintenance, road agencies in Nevada expressed interest in learning about cape seal treatments covered with either slurry seal or microsurfacing, and their abilities to extend pavement life at the least cost. Hence, the main objective of this research study was to evaluate the performance and cost-effectiveness of cape seal treatments in northern Nevada using long-term field performance data. In order to achieve the research objective, the following activities were completed during the course of this study: (1) analysis of the pavement management system data to assess the field performance of cape seals, and (2) evaluate the impact of the slurry and microsurfacing cape seals on the long-term performance of pavements under various traffic, structural, and environmental conditions.
Review of Washoe County Cape Seals Program
Washoe County is located in Northern Nevada with a climate ranging from extremely cold in the winter to very warm in the summer. The county covers two distinct regions; Truckee Meadows at elevation of 1500m and Incline Village at elevation of 2000m. Washoe County’s first use of cape seals was in 1999. The constructed cape seals consisted of a 9.5mm chip seal followed by a type 2 slurry seal. At the time, five roadways in the Truckee Meadow were treated with a cape seal placed over a fabric based on the experience of the City of Sand Diego, CA, USA. After observing field performance of the cape seals, Washoe County started routinely placing cape seals as part of its preventative maintenance program in 2001. Based on the observed field performance, starting in 2006 Washoe County elected to only construct cape seals utilizing microsurfacing based on their better resistance to damages caused by snowplows and chains.
Washoe County uses the MicroPAVERTM system to manage its pavement system [8]. MicroPAVERTM uses the concept of the Pavement Condition Index (PCI), which is calculated based on the observed distresses on the pavement surface. The PCI ranges from 0 to 100; a newly constructed pavement has a PCI value of 100. The PCI is calculated through empirical functions in the MicroPAVERTM based on the combination of extent and severity of various observed surface distresses (e.g., rutting, cracking, bleeding, raveling, etc.) in accordance with ASTM D6433 [9]. Washoe County begins the project selection process with a review of the MicroPAVERTM information concerning traffic category (defined later) and PCI values. The Washoe County’s target PCI value for cape seals on pavements with traffic categories A-C is: 60-70 (A: arterial roads, B: collector roads, and C residential roads). However, cape seals have been placed on roadways with PCI values in the range of 40- 90 based on the need of the roadway. In addition to traffic category and PCI value, Washoe County uses other factors such as budget availability, 5-7-year treatment cycle, and proximity of various projects to identify pavement candidates for cape seal treatment.
For this study, Washoe County Engineering Department provided a query of all their projects that currently had a cape seal as the last treatment applied. After an initial review of the database and the Washoe County annual work program, a total of 95 roadways were identified that had the application of a cape seal covering a service life of one to fifteen years (no other treatments were applied during the service life of the cape seal). For the final data collection and performance analysis, a representative number of projects were selected using the following five criteria described below.
1. Cape Seal Type: A cape seal is a two-treatment application consisting of a chip seal covered with a slurry seal or microsurfacing. Since both treatments are applied together, it is not possible to separate the performance of the chip seal from that of the slurry seal or microsurfacing. A review of the project’s information indicated that chip seals over all of the selected projects were constructed following the same materials specifications. As such, any performance difference observed between a cape seal covered with a slurry seal and a cape seal covered with a microsurfacing would be attributed to the slurry seal or microsurfacing layer.
2. Age: Due to the short service life, and relatively few PCI ratings to develop a performance curve, cape seals less than three years of age were eliminated from this study. The final projects were selected in the range of 4 to 13 years old cape seals.
3. Environment: The aim was to evaluate the performance of cape seals over a wide range of environments. Projects were selected throughout the Truckee Meadows to obtain a representative number of projects for comparison to the extreme environment of Incline Village.
4. Traffic Level: In the MicroPAVERTM database, Washoe County classifies roadways into five traffic categories: Arterial (A), Collector (B), Local Residential (C), Industrial (D), and Rural Highway (E). The roadway classification was used in the selection process in order to have representative projects in each classification to evaluate the effect of traffic volume on the expected performance of cape seals.
5. Project Size: In order to get a true measure of performance, the cape seal constructed section must be of sufficient length to allow for consistent application during construction and to obtain a representative measure of the performance of the treatment. The projects with the greatest treatment area were selected for evaluation when other selection criteria were similar.
Table 1: Characteristics of the Cape Seal Sections included in the Performance Evaluation.
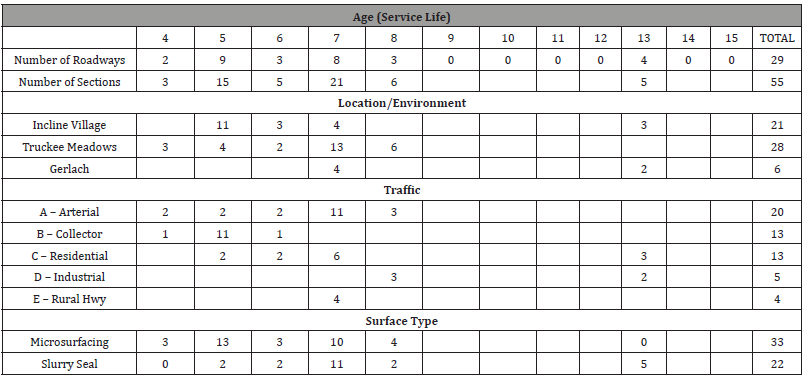
As noted earlier a complete list of all cape seal applications resulted in a total of 95 roadway projects prior to the implementation of the selection criteria. After the implementation of the five selection criteria listed above, 51 roadways were identified for further analysis. Further elimination of projects with less than 4 years of service life resulted in a total of 29 roadway projects. Upon review of the Washoe County MicroPAVERTM data it was discovered that many of the roadways are subdivided into multiple sections for condition rating and budgeting purposes. As such, the total number of sections that can be used in this evaluation is larger than the total number of roadway projects. The use of multiple sections within a roadway resulted in a total of 55 sections for the field performance evaluation as summarized in Table 1.
It should be noted that the sections are listed and analyzed by age of the cape seal and not the year of application. No cape seals were placed in years 2003, 2004, and 2005 relating to ages of 11, 10, and 9 years, respectively. Also, there are no cape seals shown with an age of 12 years as those projects were placed in 2002 and have been subsequently overlaid. However, these sections are used in the analysis with an age from construction to the time of overlay treatment. During the initial use of cape seals, mainly slurry seals were used for the second application over the chip seal. However, as time progressed and early performance was observed, Washoe County phased out the use of slurry seals in favor of microsurfacing. This can be observed in the 13-year-old cape seals having all slurry seals and from 4 to 7 years a general trend of increasing percentage in the use of microsurfacing in the cape seal (Table 1).
Collection of Pavement Information and Performance Data
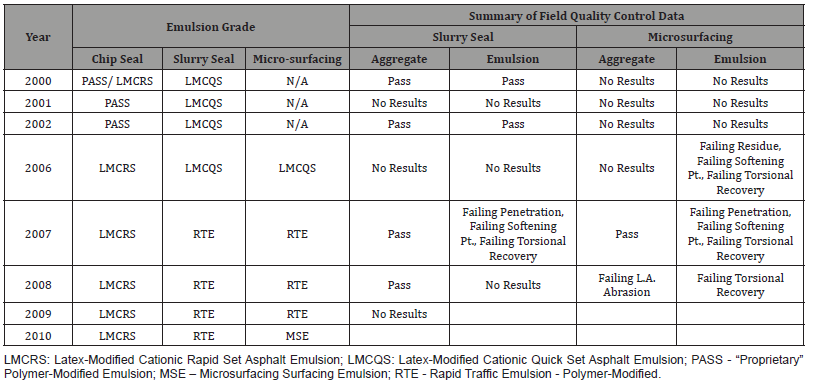
After selection of the 55 cape seal sections, the 2014 MicroPAVERTM database was obtained from Washoe County to extract the work history, section information, and PCI ratings for each of the selected cape seal sections. A section summary and PCI curve were developed for each section. Available materials information was also collected from Washoe County files for cape seals constructed in years 2000, 2001, 2002, 2006, 2007, and 2008. Yearly specifications were collected for chip seal emulsions, slurry seal and microsurfacing emulsions, chip seal aggregates, slurry seal and microsurfacing aggregates, and mix design requirements. Along with specifications requirements, field testing results for all materials used in the construction of the cape seals were collected. The grade of emulsion used in the construction of the chip seals, slurry seals, and microsurfacing are summarized in Table 2. A summary of available passing and failing field quality control test results is also provided in Table 2. For slurry seal aggregate and emulsion, the limited test results show the materials met the project specifications. For the microsurfacing, the single test results show the aggregate failing the L.A. abrasion specifications while the emulsion failing multiple specifications. However, from the data collected it is not possible to correlate the test results with the exact project location. In a review of the project specifications for chip seals, slurry seals, and microsurfacing the specification requirements remained fairly consistent throughout the duration of this study. This indicates that any changes in the materials used were not the result of direct specification changes. Therefore, combining cape seals by age rather than by year of construction should not have any significant effect on the analysis (Table 2).
Table 2: Grades of the Asphalt Emulsions used in the Construction of Cape Seals and Summary of Field Quality Control Data.
Data Analysis and Performance Modeling
Impact of construction practices
The first step in the data analysis was to review roadways that had multiple sections of cape seals applied during the same year. This comparison can be used to evaluate the effect of construction practices followed during placement of the cape seal. Below is a summary of the analysis on the impact of construction practices on the performance of cape seals.
1. Incline Way: this road had two sections (1 and 2) treated with microsurfacing cape seals in 2008. Both sections had 127mm asphalt concrete layer (AC) and similar traffic. After five years of performance, the PCI value for section 1 reduced from 96 before treatment in 2008 to 85 in 2013. For section 2, the PCI value reduced from 91 before treatment in 2008 to 84 in 2013.
2. Alexander Lake Road: this road had three sections (1, 2, and 3) treated with microsurfacing cape seals in 2006. Sections 1 and 3 had 64mm AC layer and section 2 had 100mm AC layer. All sections are classified as an industrial roadway. The PCI’s ranged from 18 to 35 before treatment in 2000 and reduced to 64 to 69 after eight years of service in 2014.
3. White Lake Parkway: this road had two sections (1 and 2) treated with slurry seal cape seals in 2000. Both sections had 140mm AC layer and similar traffic. After seven years of service, the PCI value for section 1 dropped from 99 before treatment in 1999 to 92 in 2007. For section 2, the PCI value dropped from 95 before treatment in 1999 to 92 in 2007.
The purpose of this review was to verify that the applications of the cape seals were uniform across all roadway sections. The above reviewed roadways with multiple sections demonstrated that under similar conditions of location, structural section, traffic, and year of application, the performance of the cape seals were similar and not likely to be influenced by the application procedures followed during construction. Therefore, differences in the long-term performance of the two types of cape seals may be contributed to the differences in technologies between the slurry seal and microsurfacing.
Impact of materials properties and mix design
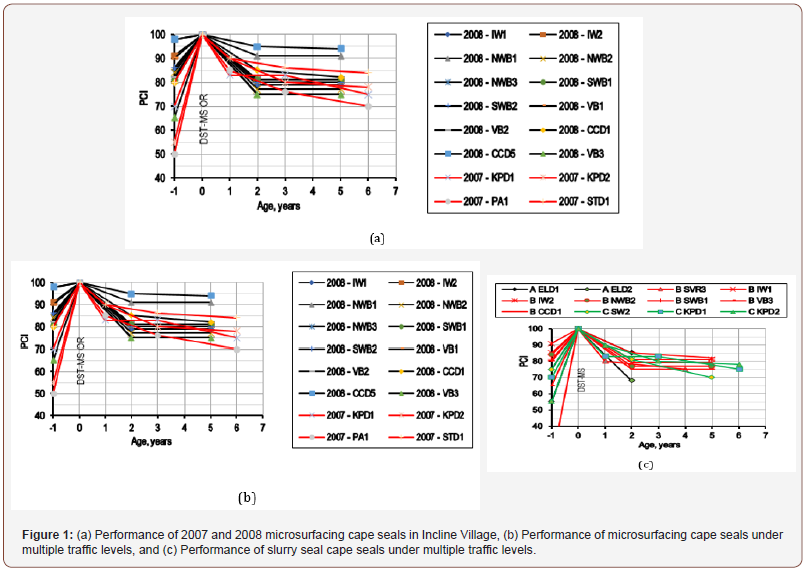
Some limited field testing indicated the failure of the microsurfacing emulsion on the residue, penetration, softening point, and torsional recovery. In the cases where failing asphalt emulsions were used in the microsurfacing, the contractor provided the County with extended warrantee. In order to assess the impact of materials variations on the performance of cape seals, the performance of cape seals with microsurfacing constructed in 2007 and 2008 in Incline Village were compared as shown in Figure 1a. The 2007 projects were rated for PCI values at 1, 3, and 6 years of service life while the 2008 projects were rated at years 2 and 5. The 2008 projects tended to have slightly lower PCI values after 2 years of service as compared to the 2007 projects, which could be due to the timing of the data collection. In most cases, the performance of the 2007 and 2008 microsurfacing cape seals were similar indicating a minimal impact of the yearly variations in materials properties on the performance of the cape seals.
Impact of traffic level
Based on the available groups of sections, it was feasible to identify cape seals sections constructed over 127-140mm AC layer with multiple levels of traffic. Figure 1b and Figure 1c present the performance of microsurfacing and slurry seal cape seals, respectively. The twelve microsurfacing cape seal sections shown in Figure 1b consist of 3-arterial, 6-collector, and 3-residential. With the large variations in the pre- PCI values, the direct impact of traffic was not clearly observed on the performance of the cape seals. It can be seen that regardless of the pre-PCI, the long-term performance of cape seals with microsurfacing are fairly consistent amongst all the traffic levels. The nine-slurry seal cape seal sections shown in Figure 1c consist of 7-arterial and 3-industrial. The range of the pre-PCI values of the slurry seal cape seals is from 75 to 100. The performance data presented in Figure 1b and Figure 1c lead to the following observations:
1. The performance of the microsurfacing cape seals are similar under multiple levels of traffic even-though the pre-PCI values varied over a wide range of 40-90.
2. The performance of the slurry seal cape seals is highly variable under a single traffic level (A or D) even-though the pre-PCI values varied over a narrow range of 75-100 (Figure 1).
Impact of pavement structure
In this study, the impact of pavement structure on the longterm performance of the cape seals was evaluated in terms of the thickness of the AC layer underneath the cape seal as obtained from construction records. Figure 2a compares the performance of microsurfacing cape seals over 127 and 190mm AC layer with pre-PCI values of 82-90, Incline Village, and traffic category B. The measured PCI values of all sections ranged between 75 and 80 at ages of 2 and 5 years indicating no impact of pavement structure on the performance of microsurfacing cape seals (Figure 2).
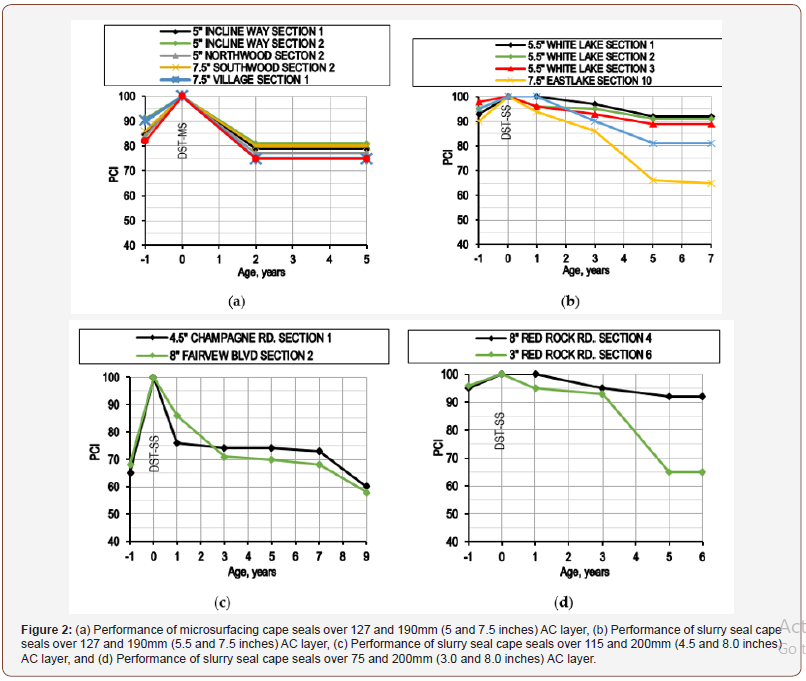
Figure 2b compares the performance of slurry seal cape seals over 127 and 190mm AC layer with pre-PCI values above 90, Truckee Meadows, and traffic category A. Figure 2b indicates that the cape seals applied over the thicker AC layer performed worse than the sections over the thinner AC layer under the same traffic and within the same location. Figure 2c compares the performance of slurry seal cape seals over 115 and 200mm AC layer with similar pre-PCI values around 65, Truckee Meadows, and traffic category C. In this case, the performance of the slurry seal cape seals under traffic category C is not impacted by the thickness of the AC layer. Figure 2d compares the performance of slurry seal cape seals over the same roadway with two AC layers of 75 and 200mm with same pre-PCI values of 95, Truckee Meadows, and traffic category A. In this case, the slurry seal cape seal on the thicker pavement section significantly outperformed the cape seal on the thinner pavement section. The overall data indicate that the impact of pavement structure on the performance of slurry seal cape seals is inconsistent and dependents on the characteristics of the specific project.
Impact of the environment
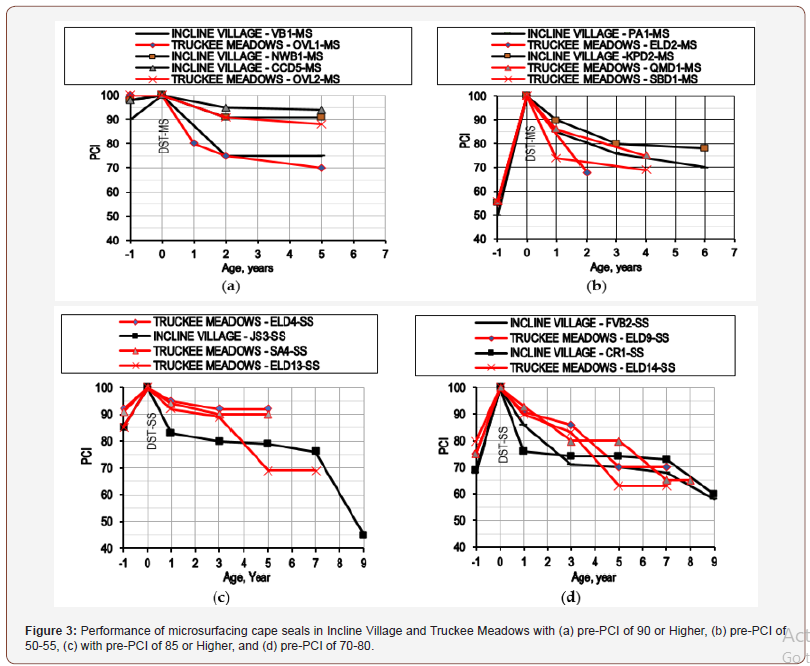
The impact of the environment on the performance of cape seals was evaluated by comparing projects located in Incline Village with projects located in the Truckee Meadows. Each group was further subdivided into PCI ranges to eliminate the effect of the pre- PCI values. Figure 3a and Figure 3b compare the performance of microsurfacing cape seals in Incline Village and Truckee Meadows with pre-PCI of 90 or higher and pre-PCI of 50-55, respectively. In both cases, there does not appear to be a direct and noticeable impact of the environment on the performance of microsurfacing cape seals. Figure 3c and Figure 3d compare the performance of slurry seal cape seals in Incline Village and Truckee Meadows with pre-PCI of 85 or higher and pre-PCI of 70-80, respectively. There is a trend for the slurry seal cape seals to drop in PCI to the pre-PCI values in the first few years of service life in both Incline Village and in the Truckee Meadows.
In general, based on the projects reviewed in this study, any environmental differences between Incline Village and the Truckee Meadows does not appear to have a significant impact on the relative long-term performance of the microsurfacing as compared to the slurry seal cape seals (Figure 3).
Impact of pre-PCI value
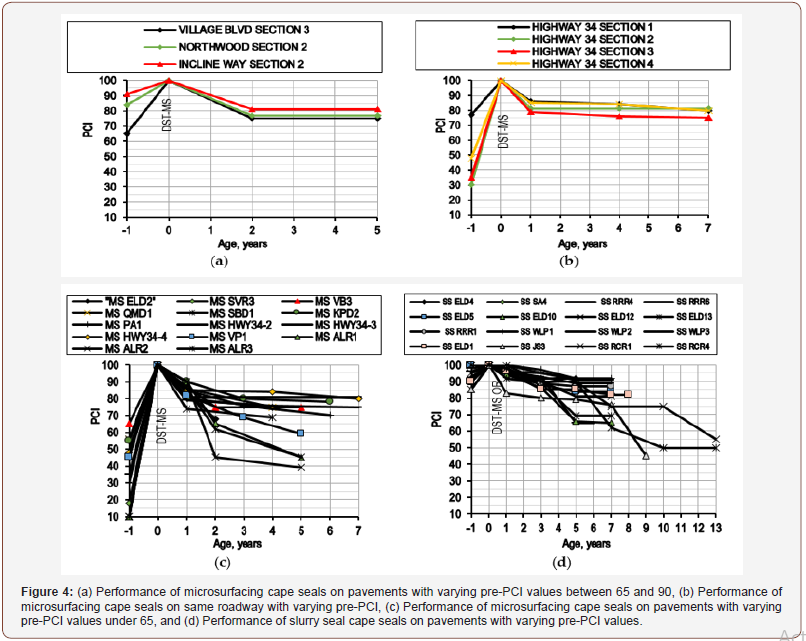
The condition of the asphalt pavement section before the application of the cape seal (i.e., pre-PCI) may have a significant effect on the treatment performance. Figure 4a compares the performance of three microsurfacing cape seal sections under traffic category B with different pre-PCI levels. Although the pre- PCI values ranged from 65 to 90, after 5 years of service life the final PCI values are all within a close range. Figure 4b compares the performance of four microsurfacing cape seal sections on the same roadway with pre-PCI values ranging from 30 to 76. After 7 years of service, the final PCI values are all within a close range. Figure 4c compares the performance of several microsurfacing cape seal sections with varying pre-PCI values under 65 (i.e., 10- 65). After 5 years of service, the PCI of the sections range from 40 to 80. When considering the range of roadways presented in Figure 4c, the variation of the final PCI values of the microsurfacing cape seals over the range of 40 to 80 is still relatively narrow compared to the range of the pre-PCI of 10 to 65. In general, the impact of the pre-PCI on the performance of the microsurfacing cape seals is minimal (Figure 4).
Figure 4d compares the performance of several slurry seal cape seal sections on multiple roadways with pre-PCI values ranging from 85 to 100. After 5-7 years of service, the final PCI values ranged from 65 to 92 and after 13 years of service the final PCI values ranged from 50-55. The data in Figure 4d indicate that the long-term performance of the slurry seal cape seals is highly variable even-though when applied on pavement sections with good conditions having PCI values above 85.
Comparison Based on Overall Long-Term Performance
The objective of this analysis is to compare the overall longterm performance of cape seals constructed with microsurfacing and slurry seal. The cape seals sections at 7 years of service provided the most basis for comparisons. Figure 5 shows the longterm performance in terms of the PCI values of microsurfacing and slurry seal cape seals that have been constructed by Washoe County during the past 15 years. The comparison included 10 microsurfacing cape seal sections and 10 slurry seal cape seal sections. A review of the performance data leads to the following observations:
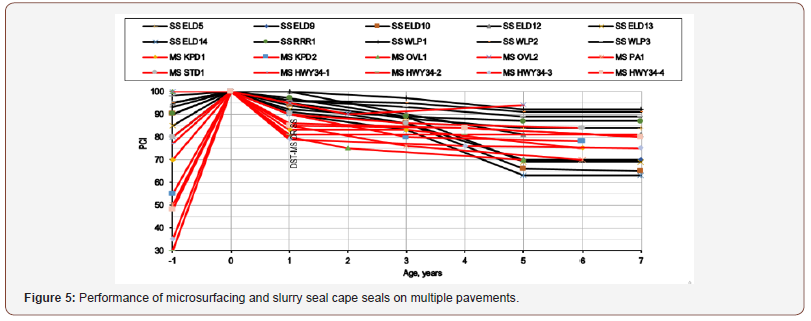
1. Microsurfacing cape seals exhibited very consistent longterm performance regardless of the conditions of the existing pavement at the time of application as expressed by the pre-PCI level (30 to 100). This is shown by the narrow range of the final PCI values of 70-80.
2. Slurry seal cape seals exhibit a highly variable longterm performance even-though the conditions of the existing pavement at the time of application are mainly good as expressed by the high pre-PCI levels (85 to 100). This is shown by the wide range of the final PCI values of 62-92 (Figure 5).
Comparison Based on Life Cycle Cost Analysis
The life cycle cost analysis (LCCA) of cape seals with microsurfacing and slurry seal was conducted. The LCCA is based on two major components: unit cost and performance life of each type of cape seal.
Cost of cape seals
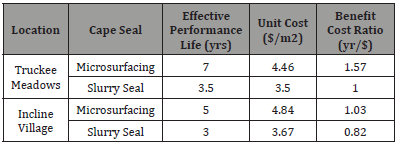
Washoe County solicits bids for its annual pavement infrastructure preservation program utilizing separate pay items for chip seal, slurry seal, and microsurfacing. The bid schedule was obtained for the 2015/2016 and the 2007/2008 programs. In the 2015/2016 bid the unit prices for a chip seal, type II slurry seal, and microsurfacing were $145, $160, and $169 per ton, respectively. The unit bid prices received in the 2007/2008 solicitation for a chip seal, type II slurry seal, and microsurfacing were $175, $165, and $190 per ton, respectively. In reviewing the approximate quantities bid each year the 2007/2008 quantities were more balanced than the quantities in the year 2015/2016 (i.e., included similar tonnage for each treatment). Also, the difference in cost of the slurry seal and microsurfacing bid of 2007/2008 were slightly larger at $25 per ton as compared to the difference of only $9 per ton for the 2015/2016 program. Based on these observations, the cost data for the 2007/2008 were selected for the LCCA. The cost based on bid item of tonnage was converted to a cost per square meter for each type of cape seal. Using the general recommended application rates for chip seals, slurry seals, and microsurfacing in Truckee Meadows and Incline Village, the costs per ton were converted to costs per square meter (Table 3). The cost data show that the microsurfacing cape seals are 27% more expensive than the slurry seal cape seals. The LCCA combines the unit costs of the cape seals with their corresponding performance life in order to identify the more effective type.
Average performance life of cape seals
The various analyses conducted in this study showed that the most critical factor on the long-term performance of cape seals is the pre-PCI value. Based on these observations, it was decided to define the effective performance life of a cape seal as the number of years in-service after the application of the cape seal until the pavement section reaches its pre-PCI value. For example, if a microsurfacing cape seal is applied over a pavement section with a PCI of 70 and the performance data indicate that the pavement returned to a PCI level of 70 after 5 years in-service, in this case the effective performance life of the microsurfacing cape seal is 5 years. It should be noted that no slurry seal cape seals were applied to pavement sections with pre-PCIs below 65 which may limit the determination of the effective performance life of the slurry seal cape seals. The average effective performance life of microsurfacing and slurry seal cape seals in the Truckee Meadows were determined to be 7 and 3.5 years, respectively. While the average effective performance life of microsurfacing and slurry seal cape seals in Incline Village were determined to be 5 and 3.5 years, respectively.
Benefit cost ratio
The last step of the LCCA is to calculate the benefit cost ratio of the two types of cape seals. The benefit-cost ratio is defined as the ratio of the benefit provided by the cape seal treatment over its unit cost. The benefit in this case is represented by the effective performance life of the cape seal. The unit of the benefit-cost ratio is year per dollar (yr/$) of effective performance life. Therefore, the higher the benefit-cost ratio the more economical and effective the cape seal. In other words, a higher benefit-cost ratio indicates that more years of effective performance life is achieved per 1-dollar of cost. Table 3 summarizes the benefit cost ratios of the two types of cape seals. The LCCA indicates that the microsurfacing cape seal is more cost effective than the slurry seal cape seal at both locations of Truckee Meadows and Incline Village. In the Truckee Meadows, the microsurfacing cape seal achieved 57% higher benefit-cost ratio than the slurry seal cape seal. In Incline Village, the microsurfacing cape seal achieved 20% higher benefit-cost ratio than the slurry seal cape seal. It should be noted that the benefit-cost ratio of the slurry seal cape seals in Incline Village should be observed with caution due to the limited number of pavement sections of 3. The benefit-cost ratios of both types of cape seals in Incline Village are lower than their benefit-cost ratios in the Truckee Meadows. This finding is expected due to the additional snowplow and chains damages encountered in Incline Village (Table 3).
Table 1:Benefit-Cost Ratios of Microsurfacing and Slurry Seal Cape Seals.
Findings and Recommendations
This study evaluated the long-term performance of cape seals with microsurfacing and slurry seal in the Truckee Meadows and Incline Village areas of Northern Nevada. A total of 55 cape seal sections were evaluated; 33 microsurfacing and 22 slurry seal. The ages of the evaluated sections ranged from 4 to 13 years. The impact of the following factors (whenever available) on the longterm performance of the cape seals were evaluated: construction practices, materials properties and mix design, traffic level, pavement structure, environment/climate, and pre-PCI (PCI prior to application of cape seal).
In addition to the analysis of the field performance data in terms of the PCI values, a life cycle cost analysis was completed. The analysis of the data generated from this study led to the following findings:
1. Among the six factors that were evaluated, only the pre- PCI value had a significant impact on the long-term performance of the cape seals.
2. Microsurfacing cape seals exhibited very consistent longterm performance regardless of the conditions of the existing pavement as expressed by the pre-PCI level. This is shown by the narrow range of the final PCI values of all microsurfacing cape seals of 70-80.
3. Slurry seal cape seals exhibited a highly variable longterm performance even-though the conditions of the existing pavement are mainly good as expressed by the high pre-PCI levels (over 85). This is shown by the wide range of the final PCI values of all the slurry seal cape seals of 62-92./
4. Even-though the pre-PCI showed the most significant impact on the long-term performance of the cape seal, some projects with lower pre-PCI out-performed projects with higher pre-PCI. This indicates that the exact level of the pre-PCI is not the only critical value but the type of distresses that led to the drop in the PCI is also critical. For example, if the same level of the pre-PCI on one project is mainly due to raveling and bleeding while on another project is due to cracking, the project experiencing the cracking distresses in the existing pavement will have a reduced performance life due to the extensive appearance of reflective cracking.
5. The average effective performance life of microsurfacing cape seals was 7 years in the Truckee Meadows and 5 years in Incline Village.
6. The average effective performance life of slurry seal cape seals was 3.5 years in the Truckee Meadows and 3 years in Incline Village.
7. The LCCA indicated that the microsurfacing cape seal is more cost-effective than the slurry seal cape seal at both locations of Truckee Meadows and Incline Village. In the Truckee Meadows, the microsurfacing cape seal achieved 57% higher benefit-cost ratio than the slurry seal cape seal. In Incline Village, the microsurfacing cape seal achieved 30% higher benefit-cost ratio than the slurry seal cape seal.
Based on the results and findings of this study, the following recommendations are made:
1. Based on the excellent long-term performance and the significantly higher benefit-cost ratio of the microsurfacing cape seals as compared to the slurry seal cape seals, road agencies should continue to use the microsurfacing cape seal as a preventive maintenance treatment.
2. Road agencies are encouraged to conduct full mix designs and implement an effective QA testing program for the cape seal projects.
3. Even-though the pre-PCI showed the most significant impact on the long-term performance of cape seals, road agencies should further investigate the various individual distresses on the existing pavement prior to making the decision regarding the application of the cape seal treatment.
Acknowledgement
None.
Conflict of Interest
No conflict of interest.
References
- California Department of Transportation (2013) 2013 State of the Pavement Report: Based on the 2013 Pavement Condition Survey. Division of Maintenance, Pavement Program.
- Wong P (2014) State road funds stuck in traffic, Portland Tribune.
- Kennedy T (1998) Evaluation of the Cape Seal Process as a Pavement Rehabilitation Alternative. Texas Department of Transportation, Austin, Texas.
- Campbell R (1977) Slurry Seal in New Construction, Shell Bitumen Review No. 56. Shell International Petroleum Company, Amesterdan, Holland.
- Quality Engineering Solutions (2011) Cost Benefit Analysis of Including Microsurfacing in Pavement Treatment Strategies & Cycle Maintenance. Pennsylvania Department of Transportation, Harrisburg, Pennsylvania.
- Gransberg D (2010) Microsurfacing. A Synthesis of Highway Practice, National Cooperative Highway Research Program, Synthesis 411, Washington DC, USA.
- Sebaaly P, Hajj E (2016) Effectiveness of Preventive Maintenance of Asphalt Pavements. 6th Euroasphalt and Eurobitumen Congress, Prague, Czech Republic.
- US Army Corps of Engineers (2014) MicroPAVERTM Version 7.0.4 [Computer Software] Illinois: U.S. Army Corps of Engineers Engineer Research and Development Center/Construction Engineering Research Laboratory.
- ASTM D6433-11 (2012) Standard Practice for Roads and Parking Lots Pavement Condition Index Surveys, American Society for Testing and Materials.
-
Peter Sebaaly, Elie Hajj, Dean Weitzel. Effectiveness of Cape Seals on Asphalt Pavements. Cur Trends Civil & Struct Eng. 2(3): 2019. CTCSE.MS.ID.000538.
-
Asphalt pavement preservation, Cape seal, Micro surfacing, Slurry seal, Environmental actions, Deterioration, Rehabilitation, Aggregate, Materials, Construction, Pavement condition index
-

This work is licensed under a Creative Commons Attribution-NonCommercial 4.0 International License.
- Abstract
- Introduction
- Literature Review
- Objective
- Review of Washoe County Cape Seals Program
- Collection of Pavement Information and Performance Data
- Data Analysis and Performance Modeling
- Comparison Based on Overall Long-Term Performance
- Comparison Based on Life Cycle Cost Analysis
- Findings and Recommendations
- Acknowledgement
- Conflict of Interest
- References


