 Short Communication
Curvature-Deflection Relations for Polypropylene Fiber-Reinforced Deflection-Hardening Alkali- Activated Slag Composite
Allahverdi Bahrami and Kiachehr Behfarnia*
Department of Civil Engineering, Isfahan University of Technology, Isfahan 84156-83111, Iran
Kiachehr Behfarnia, Department of Civil Engineering, Isfahan University of Technology, Isfahan 84156-83111, Iran.
Received Date: January 19, 2022; Published Date: February 08, 2022
Abstract
To obtain a tensile strain-hardening behavior by using the ordinary polypropylene (PP) fiber, the micromechanical model recommends the increase of the fiber low interfacial bond with an ordinary cementitious matrix. It was predicted that the alkali-activated slag (AAS) composite high drying shrinkage performance would affect the fiber interface frictional bond during the pullout. Generally, twenty different PP fiber reinforced AAS composites with drastically different material properties were obtained in this research. In order to alter the drying shrinkage performance of the composites, two different curing methods, namely, heat-treatment and laboratory temperature, were applied to the developed specimens. All examined composites showed a deflection-hardening response in flexure; for most of them, the flexural strength was significantly increased from the cracking strength and the responses were similar to flexural response of a strain-hardening cementitious composite (SHCC). However, for some of the mixing proportions, the composites did not display a tensile strain-hardening behavior; indeed, given slight increase in flexural strength. Among the experimented composites, the two mixing proportions were different only in the curing method, altering the drying shrinkage performance of the AAS composites. Practically, the AAS composite with the lower shrinkage performance showed a considerable increase in the flexural strength and a high deflection capacity; however, the deflection capacity for the AAS composite with the higher shrinkage performance was much further improved. As the first stage of the research, the flexural behavior of all twenty different composites was studied in detail by using the Digital Image Correlation (DIC) technique. The DIC inspections considered the strain data at the beam mid-span, which was experimentally distributed linearly across the beam depth; also, the curvature distribution data along the beam during the test had a good agreement with the expectations. According to the structural mechanics and the changes occurring during the four-point bending test (FPBT) in the curvature distribution along the deflection-hardening cementitious composites, the initial and ultimate state boundaries were also set theoretically for the mid-span curvature in relation to the load-point deflection. Basically, the mid-span curvature was calculable by either the strain or curvature distributions; however, due to the cracking nature of the composites, a couple of issues were influential on the strain distribution calculation method for some of the bending specimens examined. According to the theory of the curvature-deflection relation and, the experimental data, the mid-span curvature was estimated by a polynomial which would serve as a simple calculation for different material properties at the ultimate flexural strength.
Keywords: Flexural Deflection-Hardening; Strain-Hardening Cementitious Composites (SHCC); Polypropylene (PP) fiber, Alkali-Activated Slag (AAS); Strain Distribution; Curvature Distribution; Digital Image Correlation (DIC)
Introduction
In the 1980s, the efforts made to create a fiber-reinforced
concrete with tensile ductility by applying random discontinuous
fibers; these led to the development of the concept of the micromechanics-
based design theory of strain-hardening cementitious
composites (SHCCs) in the early 1990s [1]. The micromechanics
expresses the conditions for the tensile strain-hardening response
in terms of some measurable microstructure parameters including
matrix properties, fiber properties, interface properties, and fiber-matrix interaction properties. Furthermore, the SHCCs tensile
behavior at the macroscale, as the composite tensile strength and
strain capacity, and also, controlling the width of the cracks and saturated
multiple cracking are related to this microstructure at the
microscale through the micromechanical models. This powerful
tool has been developed for the pullout behavior of different fibers;
in fact, it is widely recognized as the design guideline for achieving
high strain capacity alone [2]. The micromechanical models have
assisted civil material engineers in producing various SHCCs by using
many fibers with different mechanical and interfacial properties,
such as polyethylene (PE), polyvinyl alcohol (PVA - as the most
useful fiber in this technology by now), polypropylene (PP), steel
[3,4] and even natural fibers [5] in combination with an optimized
cementitious matrix. Nowadays, SHCC is a family of materials with
a vast range of ultimate tensile strengths and strain capacity; multiple
cracks under tensile load have been developed and modified,
depending on the demands of a particular structure [6]. Among effective
microstructure parameters in the micromechanics theory,
the fiber interface property during the fiber pullout serves a key
role in the propagation of steady-state cracks, with a major impact
on the fiber bridging stress versus crack opening relations used in
the models. The very first micromechanical studies on the fibers
by Li et al revealed that only about 0.3-0.7% volume fraction of the
ultra-high molecular weight polyethylene (PE) fiber was necessary
to achieve a tensile strain-hardening response, thus experimentally
confirming a tensile strain capacity of about 6% [7-9]. According to
the micromechanical models, a stronger interfacial bond for the PE
fiber is favorable to strain-hardening. While fiber surface modification
with plasma treatment was found to be effective in enhancing
the PE fiber interfacial bond with a cementitious matrix, both tensile
strength and strain capacity of the produced composite were
improved experimentally [10].
Despite the PE fiber, an ordinary polyvinyl alcohol (PVA) fiber
tends to rapture during pullout from a cementitious matrix, due to
the strong interfacial bond and also, the slip-hardening effect. In
order to minimize the needed PVA fiber volume fraction to achieve
the strain-hardening behavior, the micromechanical models suggest
that the interfacial bond should be lowered to an optimal
range. Experimental results have also confirmed that applying an
appropriate amount of the oil coating to the PVA fiber surface could
alter the fiber pullout behavior and reduce in terms of the fiber-matrix
both chemical and frictional bonds. Also, the slip-hardening
fiber delamination effect was disappeared almost completely. Due
to the composite experimentations, the tensile strain capacity was
enhanced from 0.99% by using the ordinary PVA fiber to 4.88% by
applying oil coated PVA fiber [11]. Nonetheless, practical applications
of SHCCs by using the PE fibers are limited due to the high
cost of them; even though the PVA fibers are cheaper than the PE
ones, they still account for approximately 50% of the total material
cost of SHCC [11,12]. While the fiber cost has a significant effect
on the total cost of SHCCs, polypropylene (PP) fiber, as one of the
cheapest and most available fibers all around the globe, seems to
be the most favorable candidate to decrease the cost of the SHCCs.
However, due to the very low tensile strength, modulus of elasticity,
and interfacial bond with a cementitious matrix, the ordinary PP
fiber is less practical to achieve tensile ductility than PE and modified
PVA fibers. The micromechanical model advises the use of the
PP fiber with a higher aspect ratio rather than the PVA fiber, as well
as the increase of the fiber tensile strength and the interfacial bond
in any possible way. However, although the tensile strength of the
high-tenancy PP (HTPP) fiber is almost twice that of the ordinary
PP fiber, according to the studies conducted by Yang, the strength
criteria of the micromechanical model were not met to achieve
strain-hardening by applying the ordinary HTPP fiber. This was
confirmed by the experimental results and a tensile strain-softening
response was attained. Copolymerization of the HTPP fiber surface
with different additives changed the surface properties from
the core. It was found that proper copolymerization could increase
the interface frictional bond significantly from 0.2 MPa to 1.5 MPa.
Also, in one of the experimented cases, a 1.4 J/m2 interface chemical
bond was achieved. The use of the properly treated HTPP fibers led
to a significant improvement in the ductility of the composites up to
about 5% [13]. The developed HTPP fiber was used by Lee et al in a
later experiment and the produced HTPP-SHCCs showed the tensile
strain capacity of 3-6% [14]. Later, Zhang and Li used an acrylic latex
admixture to apply a strong adhesive to a steel substrate to produce
a spray-applied fire-resistive SHCC. Their experiment showed
that the HTPP fiber hydrophobic behavior was altered upon the incorporation
with the acrylic latex admixture and a strong interface
chemical bond about four times higher than that of the modified
PVA fiber was recorded; meanwhile, the fiber post debonding pullout
behavior had not been changed [11,15].
As discussed before, it is difficult to achieve high tensile ductility
by applying the non-treated ordinary PP fiber. In order to achieve
tensile strain-hardening by the PP fiber and further decrease the
cost of SHCCs, the main idea of this research was using a cementitious
matrix with a high shrinkage performance; this was predicted
to have a significant effect on the interface frictional bond of the
ordinary PP fiber (or any other fiber) with the matrix. It was found
that alkali-activated blast furnace slag (BFS) binders had a considerably
higher shrinkage performance (which as measured to be
higher than 2000 microstrain in some circumstances) in comparison
to the ordinary Portland cement (OPC). The reaction of the BFS
with an alkali metal source (solid or dissolved) formed a solid material
physically and chemically comparable to the hardened Portland
cement, which is known as alkali-activated slag (AAS) [16-18].
Therefore, in this research, AAS was used as the cementitious matrix
to produce SHCC with high tensile ductility by using the ordinary
PP fiber. In order to examine the matrix shrinkage effect on the
composite tensile properties, two different curing methods were
applied to the composites after demolding. Some of the specimens
were kept in the laboratory temperature for seven or twenty-eight
days in plastic bags. In this situation, the AAS paste showed a high
shrinkage performance. Along with them, some of the specimens
were heat-treated at 60˚C for 24 hours; this has been reported to be
very effective in reducing the shrinkage of the AAS concrete, making
it comparable with that of the OPC concrete [19]. Although the
efforts made to gain reliable results from the uniaxial tensile test
(UTT) were unsuccessful practically, the flexural deflection capacity
of the PP fiber reinforced AAS composite cured at the laboratory temperature was significantly enhanced, most probably due to the
higher shrinkage of the composite, as shown in Figure 1. As reported,
the UTT process is generally considered to be relatively complicated
and sensitive to several factors, such as sample imperfections,
machine stiffness, slippage, and above all, stress concentration and
cracks caused by shrinkage stress. In other words, advanced equipment
and delicate experimental skills are required [20-23]. Therefore,
indirect assessments such as the Japan Concrete Institute (JCI)
method [24], the University of Michigan (UM) method [22,23], and
many others [25-28] remain as the options available to investigate
the tensile response of the produced composites. It should be noted
that according to the JCI method calculations, a considerably high
average tensile strain capacity of about 12% was achieved from the
specimens kept in the laboratory temperature (Figure 1).

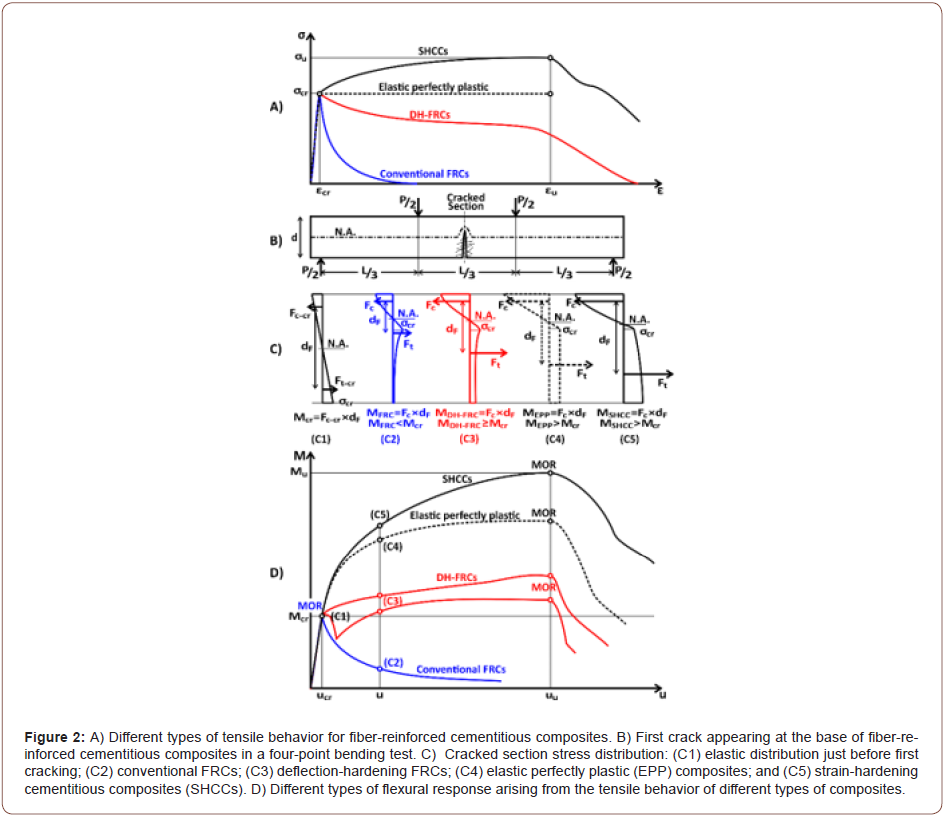
Generally, the type of the flexural response of a fiber-reinforced cementitious composite (FRCC) in a four-point bending test (FPBT) greatly depends on the material tensile behavior, while the influence of compressive parameters is insignificant [21]. Figure 2 emphasizes the FRCC flexural response transition from a deflection-softening response for the conventional FRCCs to a deflection-hardening one for deflection-hardening FRCCs (DH-FRC) and SHCCs. Under bending, when the tensile stress caused by external loading exceeds the tensile strength of the cementitious matrix, the first crack is formed at the base of the beam. After the crack has appeared, the fibers at the crack location bridge across the two sides of the crack and transfer the tensile stress in the composite, which can be calculated based on the crack width [2]. Since the tensile strength of the cementitious composites is much smaller than their compressive strength, the neutral axis moves toward the extreme compressive fiber and the cross-section stress is redistributed. In a conventional fiber-reinforced concrete (FRC), by increasing the deflection after the first crack, the beam sectional moment of resistance is diminished; this is called the deflection-softening behavior and deformation is localized onto the single crack. As illustrated in the part C of the Figure, enhancing the transferred stress by the fibers, could increase both compressive and tensile stress equivalent forces (Fc and Ft); also, the distance between them (dF) is increased; so, the resulted moment of resistance is increased as well. By adequately enhancing the transferred stress through the bridging fibers, the flexural resistance at the crack section overtakes the cementitious matrix flexural resistance. In this situation, more deflection might cause the appearance of another crack from a weaker section at the beam bottom. This process might be repeated multiple times; it is usually along with increase in the bearing capacity of the member; which, the deformation is considered as a deflection-hardening response until a single crack bridging fibers fail to transfer more stress. After that, the beam flexural strength is softened in a way similar to conventional FRCCs. In an FPBT, a deflection-hardening beam undergoes a large deflection and experiences a high curvature while bearing a larger load in comparison to the composite first cracking load. It should be noted that in composites with elastic perfectly plastic (EPP) tensile properties and beyond that, the strain-hardening cementitious composites (SHCCs) will always show a deflection-hardening response along with a major increase in the flexural strength (Figure 2).
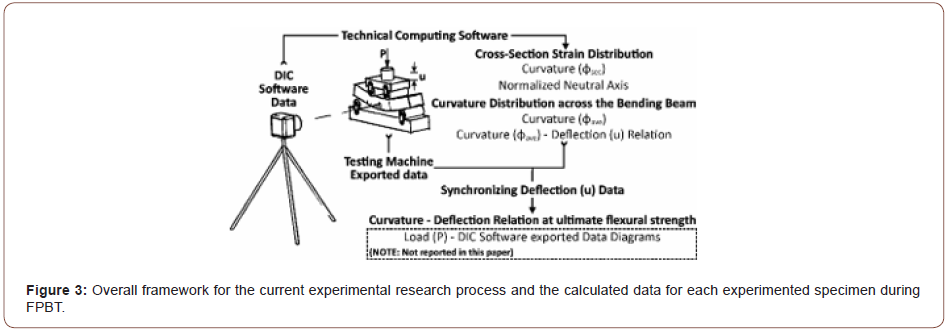
As the first step of this study, flexural response of the PP fiber reinforced AAS composites was comprehensively studied by means of a digital image correlation (DIC) software in this paper. Later, in a subsequent study, a new indirect method will be introduced applying the data in this work to estimate the SHCCs tensile strength and strain capacity. The new method results will be compared with those of JCI and UM methods as the second step of this study. The indirect approaches will help to judge on the examined tensile properties of the composites. In order to have the proper judgment, the produced compressive strength and modulus of elasticity of the composites were also examined by a uniaxial compression test (UCT) along with FPBT. Twenty different mixing proportions, all with deflection-hardening responses, were produced and examined in this research. The differences in them were related to the utilized BFS chemical compositions and the amounts of the solid alkali activator, silica fume, superplasticizer, fine silica sand, water, and polypropylene fibers, as well as the curing method. Finally, the effect of the compounds content of the composites and the curing methods on the tensile properties of composites will be addressed in a separate paper. The overall experimental research framework and the studies of this paper for each bending specimen can be seen in Figure 3. FPBT was assisted by a camera capturing the whole test procedure video. The video was imported into the DIC software, in which the intended points and virtual extensometers were identified at the un-deformed stage. The software calculated the identified point displacements and the extensometers longitude strain during FPBT in a frame-by-frame manner. The displacement data of the points were used to investigate the curvature distribution along the beam and also, the deflection of the beam. The extensometers strain data were also considered to investigate the beam midspan cross-section strain distribution. Due to the large number of the inspected frames during the test for each specimen and hence, the related calculations, a technical computing software, Wolfram Mathematica, was employed to calculate the required equations and manage the data. While the beam mid-span curvature was calculated by both strain distribution and curvature distribution investigations, the advantages and disadvantages of the DIC inspection of these two different methods, besides the related achieved data, were compared. It should be noted that the strain distribution data was disturbed in some cases due to the cracking nature of the cementitious composites. Therefore, the deflection-hardening midspan curvature-deflection relation of the cementitious composites was investigated by using the curvature distribution data. The curvature- deflection investigation was along with a theoretical calculation related to the boundaries of the diagrams for a deflection-hardening composite, as confirmed by the experiment data. Finally, by using the experimental ultimate flexural strength (MOR) results for all inspected bending specimens, the mid-span curvature was correlated to the beam deflection. This relation could help to evaluate the beam mid-span curvature, simply according to the load-point deflection in an FPBT. In addition to the curvature inspections as the main purpose of this paper, the neutral axis location was also calculated from the strain distribution data and studied (Figure 3).
Experimental Procedure
Mixing proportions
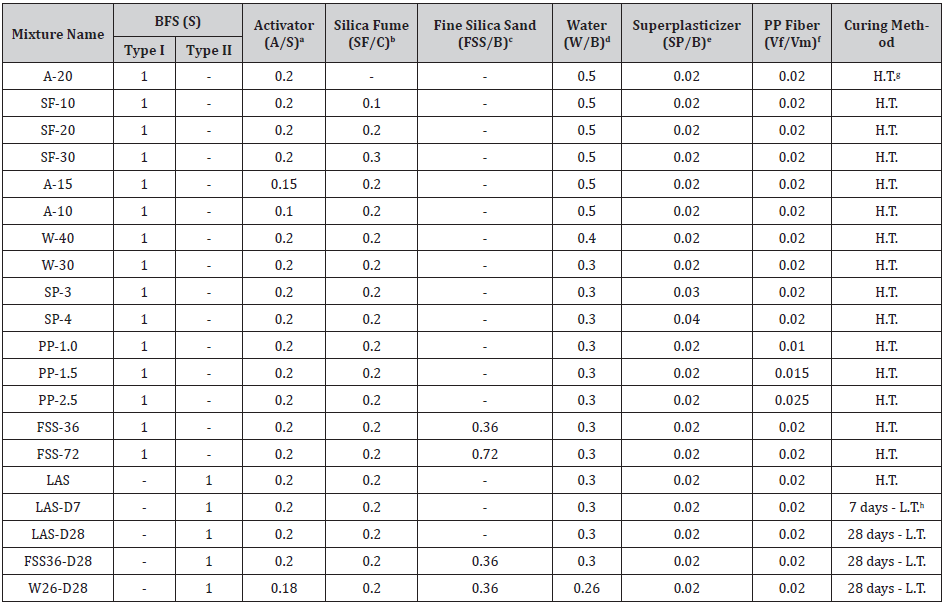
Mixing proportions of the fiber reinforced AAS composites and the curing type of the developed specimens are listed in Table 1. As shown, two different types of BFS were used in this study. Both, which were Isfahan steel company by-products, had been milled to the specific surface of 400 m2/kg by the Sepahan Cement Company. The specifications provided by the Sepahan Cement Company for these two types of BFS are presented in Table 2. The main difference between them was in the Al2O3 content of the chemical compositions. A higher Si/Al ratio lead to longer silicate chains in the produced C-A-S-H gel, imparting more polymeric properties to the system and increasing the drying and autogenous shrinkage of alkali- activated materials [17]. In order to produce the AAS paste, the powdered sodium metasilicate pentahydrate (Na2SiO3.5H2O) was used as the alkali metal source (activator) and pre-mixed with the BFS before adding water. Sodium metasilicate pentahydrate contained about 42.5% wt. of the crystalline water. Dissolution of the sodium metasilicate pentahydrate in water released the crystalline water, which acted as part of the compound water [29]. In this research, it was assumed that all of the solid activators are dissolved in the added water; thus, all crystalline water in the activator was subtracted from the required water to make the AAS binder. It can be seen in the table that different amounts of the activator, silica fume (90 to 95% wt. SiO2), fine silica sand (89% wt. 50 to 150 μm), water, superplasticizer (polycarboxylate-based) and ordinary PP fiber were used in the mixing proportions. It is known that fine silica sand increases the matrix fracture toughness, making it harder to achieve the strain-hardening behavior; also, it increases the stiffness of the composite and volume stability [6]; so, the fine silica sand was not used in most of the mixing proportions. The curing method of the specimens for the mixing proportions is displayed in the last column of the table. After demolding, all specimens were perfectly sealed in a plastic bag to prevent the loosening of the moister. The specimens of the mixing proportions are shown with the H.T. sign in the table, these were heat-treated in the oven at 60˚C for 24hr and immediately tested after cooling down. The specimens of the mixing proportions, as are shown with the L.T. sign, were kept sealed in plastic bags at the laboratory temperature and then tested 7 or 28 days after production. As the main idea of this research, the higher drying shrinkage performance in the specimens kept at the laboratory temperature was predicted to cause higher interface frictional bond strength between the fiber and matrix, which would be favorable to produce SHCC by using the ordinary PP fiber. The mechanical and physical properties of the PP fiber used in this research are listed in Table 3. The tensile strength and modulus of elasticity of PP fibers were less than one-half and about two-thirds of those for the HTPP fiber, respectively. As can be seen, the fiber volume fraction was 2% for most of the mixing proportions (Table 1 & 2).
Table 1: Mixtures proportions of fiber reinforced AAS composites.
aA: Activator
bSF: Silica fume and C=S+(1-0.425) ∙A
cFSS: Fine silica sand and B=C+SF
dW: Mixture total water and Wadd=(W⁄B) ∙B-(0.425)∙A
eSP: Superplasticizer
f(Vf/Vm): Fiber volume fraction
gH.T.: High temperature
hL.T.: Laboratory temperature
Table 2: Chemical compositions of GGBFS (wt. %) [30].

Mechanical properties of the materials
For each of the mixing proportions, three bending specimens with the dimensions of 50×70×350mm were prepared and FPBT was conducted according to ASTM C1609/ C1609M [31] by applying an ELE “digital tritest 50” device with the span length of 300mm and a load-cell of 50KN. In the FPBT, multiple cracking was formed at the tensile zone of the beams; the composites demonstrated the deflection-hardening behavior for all of the mixing proportions, as illustrated in Figure 4. While it may not be appropriate to judge if a composite would show a tensile strain-hardening response according to the flexural behavior, it seems that the two different deflection- hardening response types described above, as well as in ACI 544.8R-16 [25], were achieved. For most of the mixing proportions, flexural strength was significantly increased from the cracking strength and the responses were similar to the flexural response of SHCC. However, according to the flexural response for some of the mixing proportions, the composites did not display the tensile strain-hardening behavior. Figure 5 shows the flexural response of the mixing proportion LAS-D7 in regard to the composites assumed to attain tensile strain-hardening with the highest deflection capacity. Also, the flexural response for the mixing proportion A-15 in the case of DH-FRCs is illustrated in Figure 6 (Figure 4-6).
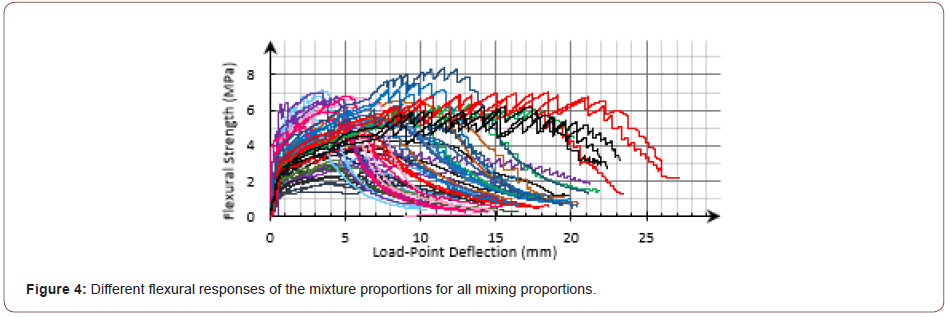
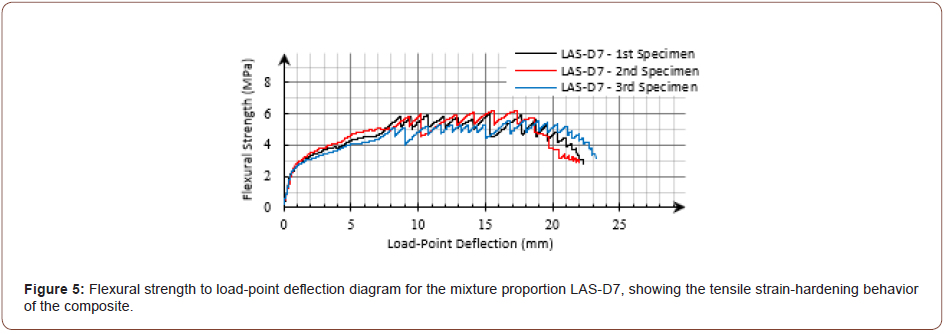
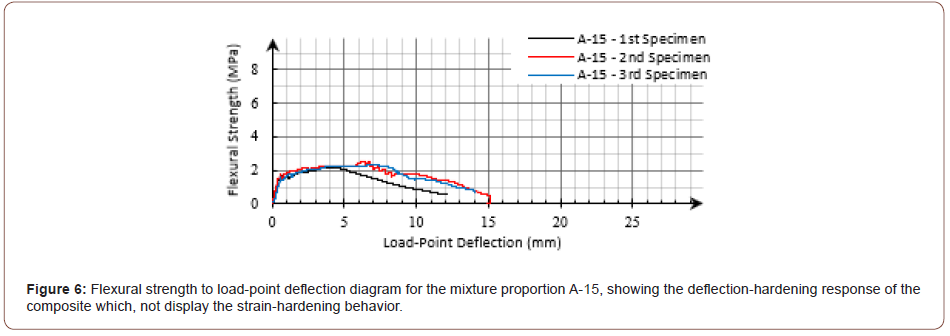
Table 3: Mechanical and physical properties of PP fiber.

In order to measure the compressive strength and modulus of the elasticity of the composites, three cylindrical specimens with the diameter of 150mm were prepared for each of the mixing proportions; UCT was implemented in accordance with ASTM C39/ C39M and ASTM C469/ C469M [32,33]. Regardless of the type of the tensile response of the composites, the mean values of the modulus of rupture (MOR) and the load-point deflection capacity (u) obtained from FPBT, besides the mean values of the compressive strength and the modulus of elasticity data obtained from UCT, are listed in Table 4. As can be seen, the material properties were measured to be drastically different for the twenty mixing proportions experimented (Table 4).
Table 4: Range of the material’s mechanical characteristics.

Image processing of the four-point bending test
Measuring the surface deformation of materials and structures exposed to different loads is an important issue in the experimental mechanics of solids. Apart from point-wise measurements with contacting tools, various non-contact and optical methods have been developed and used for the whole sample surface investigation. Nowadays, the DIC technique is widely accepted and used as a powerful and flexible tool in this field. In this method, the displacements and strains on the specimen surface are presented on the full field by comparing the sample surface in the deformed image or those with the un-deformed image (the reference image), directly by numerical calculations. The advantages of this method over similar ones are the simplicity of the testing set-up and samples preparation, without any need for special lighting or imaging equipment. With more than three decades of experience, this method has been well developed by researchers; various types of software have been provided accordingly [34]. In this experiment, “GOM Digital Image Correlation” software was used to investigate the flexural behavior of the produced composites [35-37]. According to the software instructions, the surface of the flexural specimens was speckled with a black and white spray prior to testing, as shown in Figure 7. After the painted surface was dried, a straight line along the beam length was marked near the compression zone (5mm from the top). At the reference image, this line is represented as the x-direction in the software. Given the fact that the software calculates the displacement data according to a defined distance as a computational reference, it is necessary to be precise in marking the distance on the specimen surface and specifying this measuring reference in the software at the reference image. In this research, two points were marked with a distance of 100mm on the specimen surface prior to testing on the marked line, as shown in the Figure. It should be noted that the FPBT was assisted by an ordinary cellphone capturing 30 fps video during the test. The captured videos were converted to 1 fps videos using some movie converter software to reduce the number of the frames and then imported into the DIC software (Figure 7).

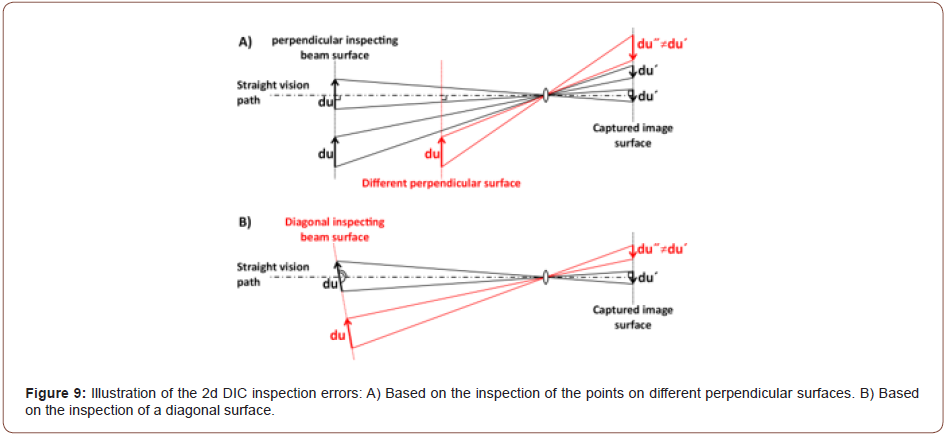
The load-point deflection (u) was measured by a speckled pattern placed on the loading deck of the testing machine, as represented in Figure 8. The speckled pattern surface and the inspected beam surface were arranged in one perpendicular surface to the straight vision path of the camera to avoid 2D DIC inspection errors, as illustrated in Figure 9. The load-point deflection was also measured by an LVDT attached to the testing machine. For each frame imported into the software, the load-point deflection value calculated by the DIC software was synchronized with the testing machine displacement data. Then, the force related to the synchronized displacement measured by the testing machine, was determined as the beam bearing capacity at the inspecting frame. In this paper, this data was used in order to specify the MOR stage among captured frames. While it was not the main purpose of this paper, the achieved force-related data, as in the case of the moment-curvature diagrams could be effective in the subsequent indirect investigations or even other studies (Figures 8 & 9).

Strain distribution calculations
In order to investigate the mid-span cross-section strain distribution, nine virtual extensometers with the length of 100mm were arranged at the reference image in the DIC software, as shown in Figure 10. They were specified with the distance of 5mm from each other at the beam mid-span along the x-direction. The nearest extensometer to the compressive zone of the bending beam was identified at the distance of 5mm from the top of the specimen. As shown in Figure 11, the extensometers longitudinal strain data were calculated during the FPBT by applying the DIC software for each bending specimen (Figures 10 & 11).


Each extensometer strain data was assumed to be the mid-span strain at the extensometer defined height; so, the mid-span strain distribution was achieved across the beam height. Following the previous examples of different flexural responses for the mixing proportions LAS-D7 and A-15, their second specimens mid-span strain distributions during FPBT are depicted in Figure 12 and Figure 13, respectively. Due to the small depth to length ratio (h/ L=1/6) of the experimented beams, the calculated strain-distribution for almost all examined beams in this research was almost linear during the test (Figures 12 & 13).


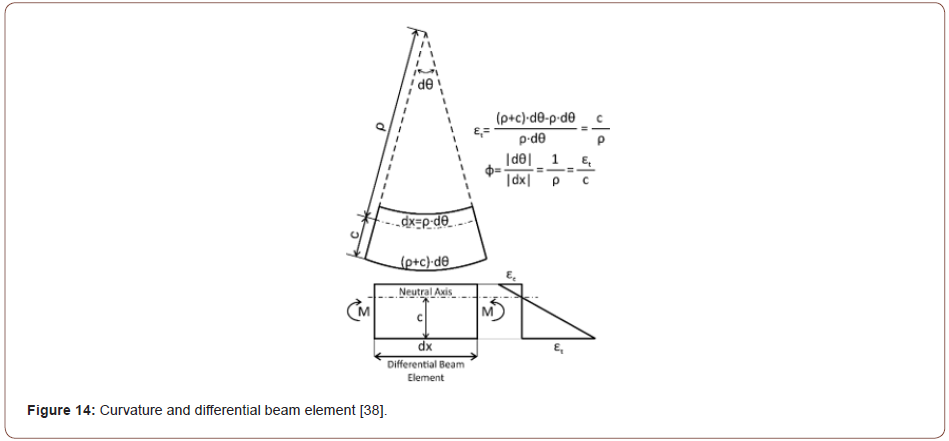
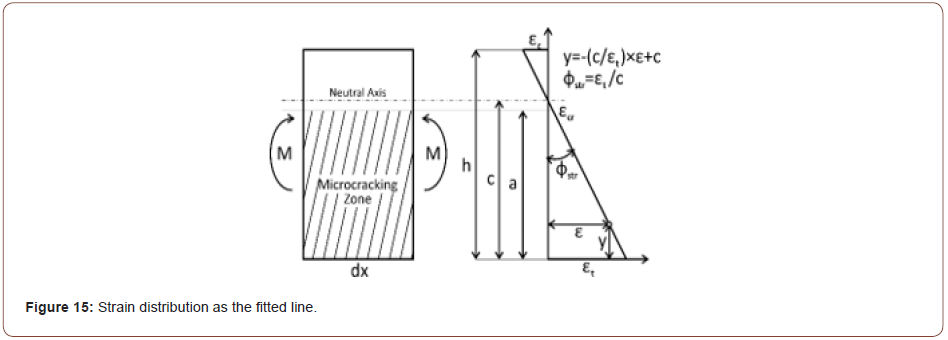
Figure 14 illustrates the curvature calculation for a differential beam element. As can be seen in Figure 12 and Figure 13, a straight line was fitted to the strain distribution data at each stage of the FPBT in this paper. According to Figure 15, the strain at the extreme tensile fiber (εt), the neutral axis distance from the extreme tensile fiber (c) and so, the mid-span curvature, as specified with ϕstr in this paper, were calculated using the equation (1) from the strain distribution data (Figures 14 & 15).


Curvature distribution calculation
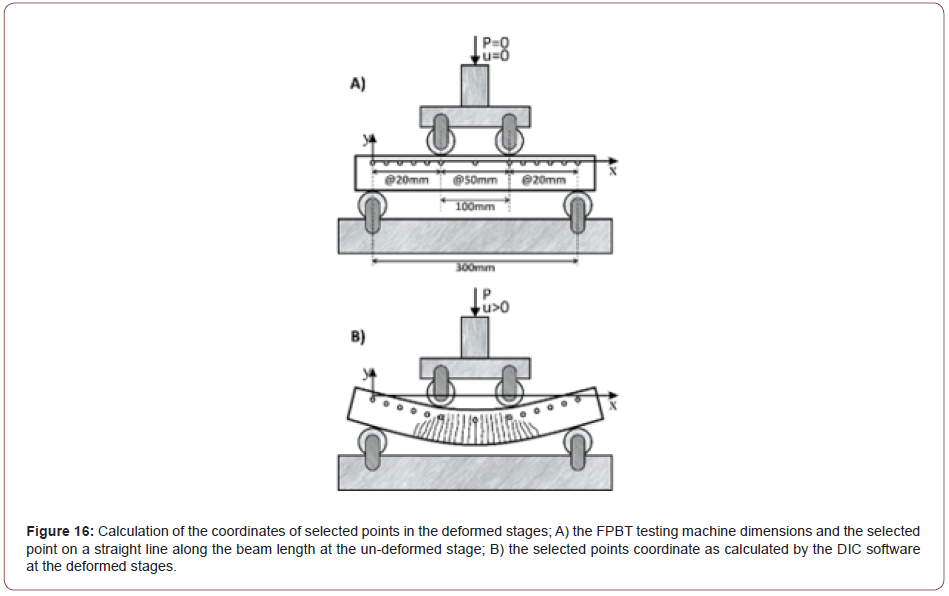
The idea was to approximate the beam curvature distribution by specifying some points on a straight line along the x-direction at the reference image in the DIC software, as shown in Figure 16, and to investigate the curvature at those points instead of the whole beam length. At each deformed stage, the coordinates of the points were obtained by using their initial coordinates and the displacements calculated by the DIC software (Figure 17). Solving the equations (2) for each point and the two adjacent points made the center of the circle cross from the points with a radius equal to ρ. It was much simpler to approximate the calculated circle radius as the curvature radius at the point location (ϕ=1/ρ) than to use the curvature exact equation (ϕ=idθ/dSi) along the beam. As can be seen in the Figure, thirteen points were determined on a line perpendicular to the loading direction on the surface of the bending beams in this study. To ensure that the selected points were identifiable by the software during the test, the points were selected with a distance of 7mm from the ultimate compressive fiber to avoid the tensile cracks. Three points in the mid-span with a distance of 50 mm and the rest of the points with a distance of 20 mm were selected. The choice of a smaller distance at the shear-span was due to the large curvature variations in those areas. The curvature calculations were repeated for each point with the two adjacent points according to equation (2); then the curvature was estimated along the bending beam length at each inspected stage (Figures 16 & 17).

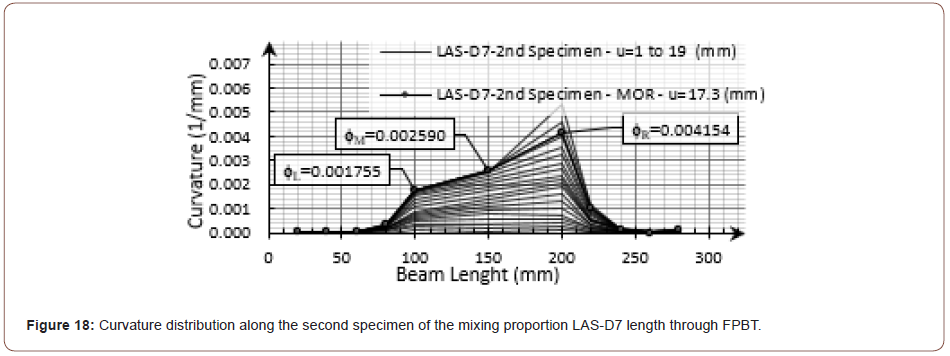
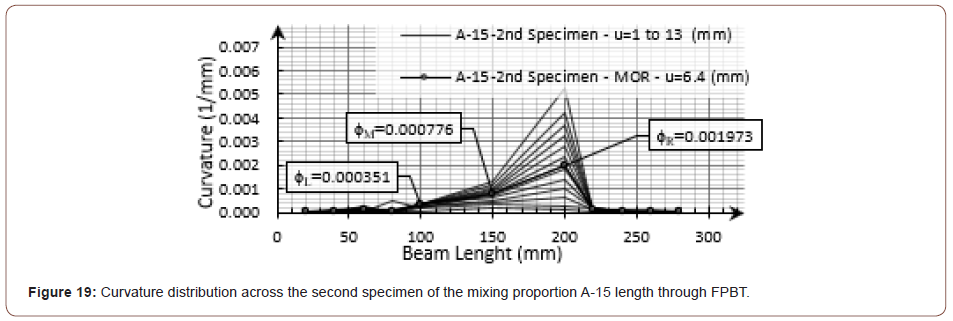
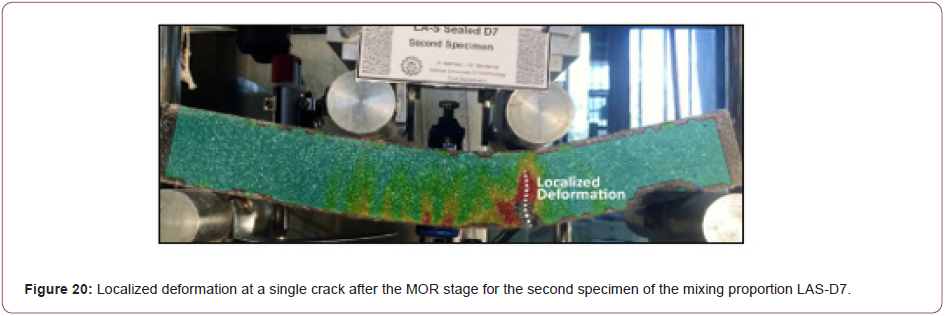
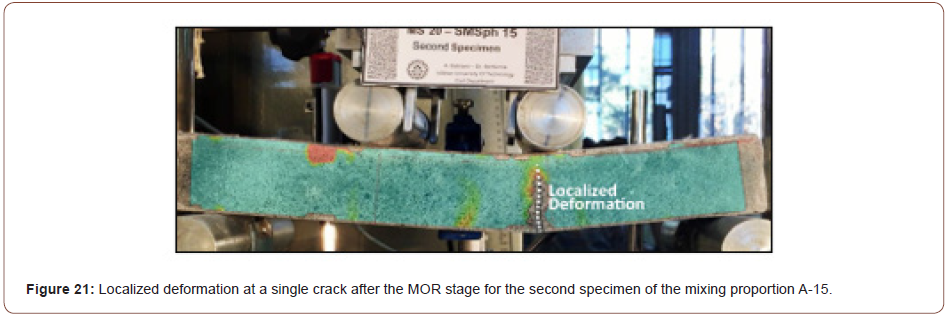
According to the previous examples for different flexural responses in this research, the calculated data for the curvature distribution along the bending beam during the FPBT for the second specimen of the mixing proportions LAS-87 and A-15 are shown in Figure 18 and Figure 19, respectively. Although the mid-span curvature for the inspected composites was not disturbed quite uniformly, the obtained experimental results were almost in a good agreement with the theoretical expectations until the MOR stage. After the MOR stage, further deformations were localized onto a single crack similar to the ordinary FRCs, as shown in Figure 20 and Figure 21 for the above examples. At the end of the test, while the beam was being unloaded, the bridging fibers shrank elastically and the width of the cracks was slightly reduced, as compared to the MOR stage. Therefore, after the MOR stage and during the deflection- softening, a significant increase in curvature was expected at the failed crack section, beside a slight decrease in the curvature at the other section of the beam. As can be seen in the examples of the curvature distribution diagrams brought below, the calculated curvature for the adjacent points with the localized crack section was increased significantly despite the other inspected points after the MOR stage. In this research, the mean value for the calculated curvature for the three specified points at the beam mid-span was considered as the curvature of the mid-span and shown with the symbol ϕave, as can be seen in equation (3) (Figures 18-21).

As mentioned before, all displacement and deformation data, as calculated by the DIC software, were exported as a number of .csv files; due to the high number of the inspected frames for each specimen (570 to 1536 frames), Wolfram Mathematica computational software was used to synchronize the DIC software and the testing machine data; calculation was done using the presented equations and the results were managed. It should be noted that the described FPBT procedure was unsuccessful for three of the bending specimens. The problem was caused by exporting the testing machine data for one bending specimen of the mixing proportions PP-2.5; also, the filming procedure was spoiled during the test for one specimen of each of the mixing proportions A-20 and SF-20.\
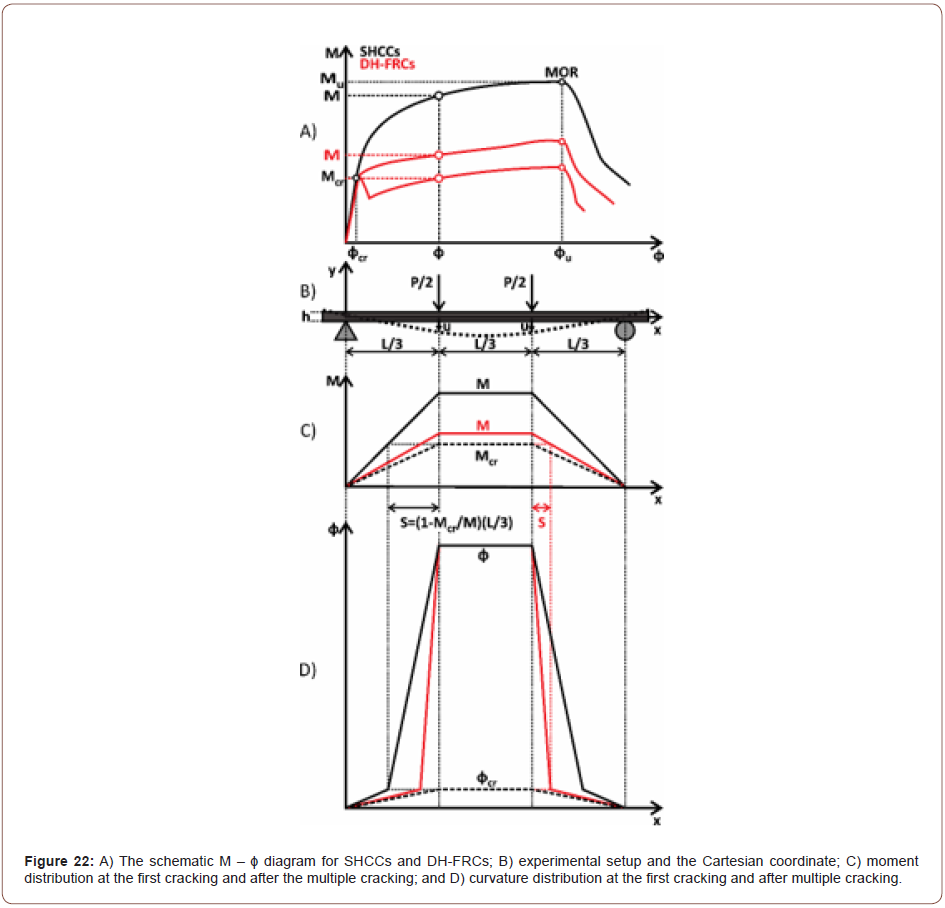
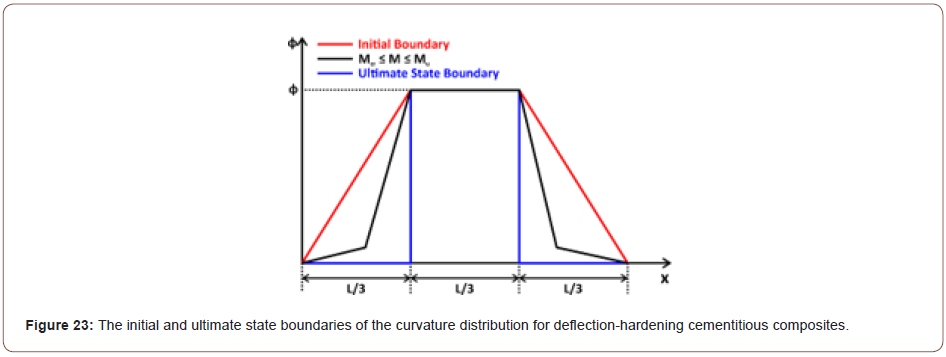
Curvature-deflection relation theoryFigure 22 illustrates the curvature distribution of perfect homogenous cementitious composites with the deflection-hardening behavior in an FPBT. Theoretically, until the first crack stage (M ≤ Mcr and φ ≤ φcr), the beam curvature distribution is similar to the moment distribution; it rises from zero at the supports and increased linearly up to the curvature at the mid-span. In this modeling, it is assumed that after the first crack stage, a homogenous dense multiple cracking occurs at any section of the beam in which the moment of resistance (M) rises from the cracking moment (Mcr). So, the curvature distribution along a beam in an FPBT can be related to the moment distribution, as shown in parts C and D of the figure. Due to the uniform moment distribution at the beam mid-span, a uniform curvature is also assumed to be disturbed by considering a dense multiple cracking there. As can be seen in part A of the figure, after the first crack occurred, the moment-curvature diagram slope diminished, resulting in the smaller moment ratio (M/ Mcr), as compared to the curvature ratio (φ/ φcr). Therefore, depending on the moment ratio and the curvature ratio, the curvature distribution for the bending beam would be similar to the illustrated ones in part D of figure until the MOR stage. The parameter S, shown in the figure, presents the shear-bending cracks outside the mid-span, specifying the effect of the moment ratio on the curvature distribution shape. Due to the lower moment ratio for DHFR, the curvature distribution along the beam will be more slender than SHCC for a determined mid-span curvature. Thus, given the wide range of the mechanical properties of deflection-hardening cementitious composites, the curvature distribution would move from the initial boundary at the first cracking stage toward the ultimate state boundary in an FPBT, as illustrated in Figure 23. So, the curvature distribution would stand between the boundaries during the test from the cracking stage until the MOR stage for a specified mid-span curvature (Figures 22 & 23).
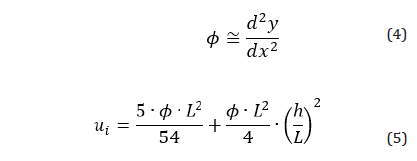
Via the classical beam theory of differential equations, the curvature of a point on a curve could be simplified, as represented in equation (4), in the Cartesian coordinate with approximately 1% error from the exact solution, if the deflections of a simple span are on the order of one-twentieth of its length, as most of the inspected specimens in this research, it would be remarkably accurate [39]. According to the structural mechanics, equation (5) was obtained by Qian and Li in the UM indirect method by considering the described initial boundary to relate the load-point deflection (u) to the mid-span curvature (φ) in an FPBT with a span length of L for some SHCCs beam with the height of h. In this equation, the first term includes the flexural deformation, as calculated by equation (4), and the second term represents the shear deformation [22]. By considering the ultimate state boundary and also ignoring the deflection caused by shear force, the flexural load-point deflection (u) can be related to the mid-span curvature (φ) according to equation (6). So, the estimated load-point deflection could be higher than the deflection calculated from the ultimate state boundary and less than the deflection obtained from the initial boundary, as shown in equation (7), in the case of a specified mid-span curvature for a deflection-hardening cementitious composite in an FPBT.

Results and Discussions
Comparison of the two different curvature calculation methods
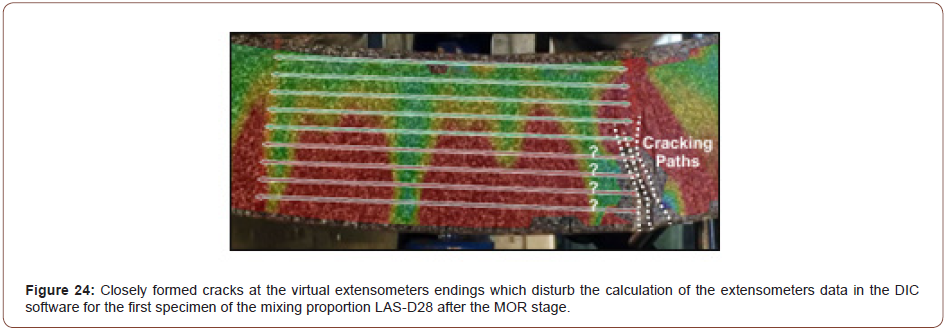
The main idea in some of the indirect methods, such as the JCI method, is to estimate the strain distribution as the first step. Then, the bending extreme tensile fiber strain value (εt), as calculated from strain distribution, is assumed to be equal to the composite tensile strain capacity. So, this shows the importance of the calculated strain distribution data in the indirect approaches; however, practically, obtaining a reliable strain distribution may not always lead to success. The most frequent issue in this research for strain distribution inspections is shown in Figure 24. As can be seen, the formation of the cracks at the specified endings of the extensometers disturbed the strain calculations in some frames during the test, especially after the MOR stage. So, it was not possible to investigate the strain distribution in a frame-by-frame manner during the FPBT. In this paper, in order to overcome this problem, all obtained data were presented for natural numbers of load-point deflections; so, the described issue was almost not problematic (Figure 24).
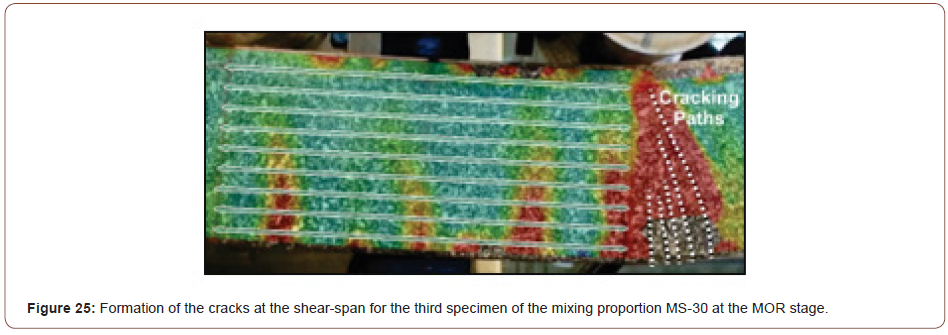
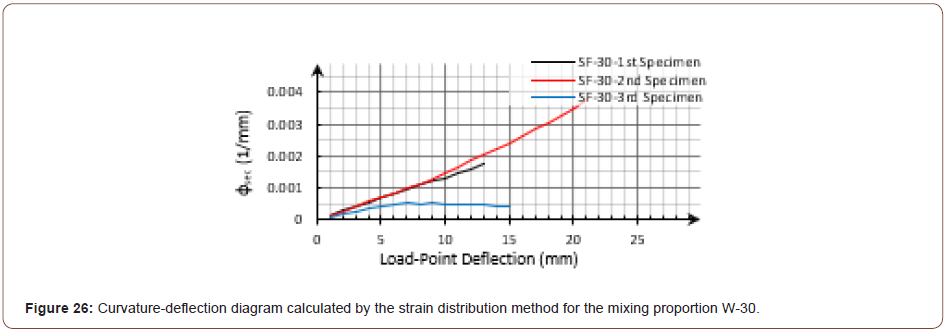
For a deflection-hardening composite with non-saturated multiple cracking behaviors in the FPBT, the flexural shear cracks formed at the shear-span play an important role in carrying the applied load to the higher deflections; so, every single crack could affect the beam flexural response. Another issue in the investigation of the strain distribution for such materials is that most cracks are formed at the shear-span instead of the mid-span. For the third specimen of the mixing proportion MS-30, which can be seen in Figure 25, while the curvature caused by the shear-span cracks was not calculated by the mid-span extensometers, the load-point deflection was significantly affected by them. The curvature-deflection diagram for the mixing proportion MS-30, as shown in Figure 26, depicts that this had effect on the calculated mid-span curvature, based on the comparison with the other two specimens of the mixing proportion (Figures 25 & 26).
It should be noted that a partly wide crack was formed at the shear-span, crossing the extensometers endings line into the pure bending-span for the third specimen of the mixing proportion W-40, as shown in Figure 27. The crack marked in the Figure caused the strain distribution to change from an almost linear trend to the one in Figure 28. So, the accuracy of the line fitted to the calculated strain data was shifted toward a relatively higher value for the neutral axis position (c) and a relatively lower mid-span curvature (ϕsec) at each stage, as can be seen in Figure 29 and Figure 30, respectively (Figures 27-30).


Via a theoretical model, Qian and Li numerically studied several SHCCs with drastically different material properties in an FPBT. They showed that immediately after the first cracking stage, by elevating the extreme tensile fiber strain (εt), the neutral axis moved quickly toward the extreme compressive fiber. Afterward, the neutral axis position remained almost constant, with about 90% of the beam height with respect to εt [22]. In the continuation of the previous examples, the diagrams for the calculated normalized neutral axis (c/h) to the extreme tensile fiber strain (εt) calculated from the strain distribution data are shown in Figure 31 and Figure 32 for the mixing proportions LAS-D7 and A-15, respectively. Apart from the issues caused by the shapes and location of the formed cracks, the strain distribution calculated data met the expectation (Figures 31 & 32).


So, the mid-span curvature was calculated by two different methods for all fifty-seven bending specimens. These data were compared in the hysteresis diagram, as shown in Figure 33. The curvatures obtained from the curvature distribution data (φave) had less than 10% difference with the strain distribution data (φsec) for twenty-four specimens, 42% from all. It could be seen that for thirty- three cases, covering 58% of all specimens, φave was calculated to be less than φsec. The described shear-span cracking issues made curvature ratio be higher than 1.2 for nine specimens. For instance, for the third specimen of the mixing proportion W-30 was the example, as shown in Figure 25, the flexural shear cracks caused the highest φave to φsec ratio, which was 2.67. Except for these nine specimens, the difference between the calculated curvatures was less than 20% (Figure 33).

As a final comparison, it should be noted that the human mistake might cause error in specifying the computational reference distance on the experimental specimen surface and or also, in the DIC software. This could affect the calculated displacement data used for the investigation of the curvature distribution. However, the error would not affect the calculation of a dimensionless parameter, as in the calculated longitudinal strain of the extensometers used for the strain distribution investigation.
Curvature – deflection relations
As mentioned before, the strain distribution data could be more informative for indirect approaches than the curvature distribution data. As well, due to the elimination of some human mistakes, it would be more accurate theoretically. However, there are a couple of practical drawbacks in the method due to the cracking nature of the composites. Since the curvature distribution helped to relate the mid-span curvature to the beam deflection theoretically, to avoid the reported drawbacks of the strain distribution investigation, the curvature- deflection diagram was inspected using of the curvature distribution data (φave) in this paper. As in the previous examples, the diagrams for the mixing proportions LAS-D7 and A-15 were accompanied by the fitted line (crossed from the origin), as shown in Figure 34 and Figure 35, respectively (u ≤ 1mm). Similarly, the diagrams for all of the examined composites demonstrated an almost linear relation between the curvature and deflection (Figures 34 & 35).


In order to examine and compare the experimental results with the specified boundaries by theory, the mid-span curvature was related to the load-point deflection, as shown in equation (8). By taking into account the dimensions of the specimen used in this research (L=300mm and h=50mm) and equation (7), we could estimate the coefficient α as represented in equation (9). As shown in Figure 36, for all fifty-seven inspected specimens, the curvature- deflection diagrams were narrowly laid between the calculated boundaries (Figure 36).

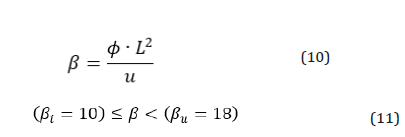
It was expected that the curvature was related to the deflection by the coefficient αi at the beginning of the FPBT until the first crack. After the first cracking stage, the general shape of the curvature distribution along the beam was changed toward the ultimate state boundary, as discussed before. Thus, the coefficient α would be increased from αi theoretically, it could reach to αu at the ultimate state for a deflection-hardening material. In order to better display the process of these changes, the dimensionless coefficient β was defined, as shown in equation (10). By considering the curvature distribution boundaries and also the dimensions of the FPBT, the coefficient β was estimated, as shown by equation (11), in this research. The calculated values for the coefficient β are shown in Figure 37 and Figure 38 for the previous examples. The diagrams show the increasing trend from βi toward βu had a good agreement with the discussed theory; so, the calculated values for the presented coefficient, β, were increased by incrementing the load-point deflection during the test. As can be seen in the figures, the result ed diagram slope was higher at the lower deflections, while at the higher ones, the diagram slope was diminished and the calculated coefficient, β, remained almost constant and less than βu (Figures 37 & 38).


In order to estimate the boundaries of the coefficients α and β, it was assumed that the curvature was constant at the mid-span during the test theoretically; however, as shown in Figure 18 and Figure 19, the curvature was not exactly the same as that with the theory. Also, it should be noted that while the span-length (L) was considered equal to 300mm, the looseness of the left side support was along with an eccentric rotation, as can be seen in Figure 39, the actual span-length seemed to experience a small increase during FPBT. Disregarding the span-length increase leads to calculating slightly smaller amounts for the coefficient β. So, the coefficient β was experimentally obtained to be less than the calculated βi for the small deflections in some cases (Figure 39).
Since the curvature-deflection diagrams during the FPBT for all inspected specimens stood between the calculated initial and the ultimate state boundaries, it was expected that the calculated curvature-deflection points at the ultimate flexural strength (MOR) would be placed in a relatively narrower band. Considering the expected increasing trend for the coefficient α, the mid-span curvature was estimated by a fitted polynomial (crossed from the origin) on the obtained data, as shown in Figure 40. At the initial deflection values, the polynomial was almost tangent to the initial boundary and moved toward the ultimate state boundary by increasing the deflection, as expected. Since the load-point deflection data at the MOR stage is one of the commonly obtained data from an FPBT, this estimation would be a simple mid-span curvature calculation for different material properties (Figure 40).

Conclusion
The main purpose of this research was to achieve strain-hardening behavior through the use of the ordinary PP fiber in AAS composites. The idea was that the AAS composites higher shrinkage performance, rather than the Portland cementitious matrix, would enhance the fiber interface frictional bond during the pullout, which was in accordance with the suggestion of the micromechanical model. Given the indirect approaches used to evaluate the tensile behavior of SHCC, this paper provided a detailed study of the flexural response of the produced deflection-hardening PP fiber-reinforced AAS composite in the FPBT by applying the DIC technique. The following specific conclusions could be drawn from this paper:
As expected, due to the small depth to length ratio of the experimented beams, the mid-span strain distribution was calculated to be almost linear across the beam’s height. The calculated strain distribution data was used to obtain the strain at the extreme tensile fiber, neutral axis distance from the extreme tensile fiber and also, the mid-span curvature. Apart from the things caused by the shapes of the formed cracks and locations for a couple of the experimented beams, the strain distribution calculated data met the theoretical expectation; so, immediately after the first cracking stage, the neutral axis moved quickly toward the extreme compressive fiber by elevating the extreme tensile fiber; then, it remained almost constant with about 90% of the beam height.
The curvature distribution along the beam was approximated in some discrete points instead of the whole beam length by a simple method. The mean value of the calculated curvature for the specified points at the beam mid-span was considered as the curvature of the mid-span, beside the previous midspan curvature calculation. Considering the changes of the curvature distribution along the beam, the initial and ultimate boundaries for the mid-span curvature-deflection diagrams were theoretically calculated, according to the structural mechanics for deflection-hardening cementitious composites during the FPBT. Practically, the curvature-deflection diagrams were narrowly laid between the calculated boundaries for all fifty-seven inspected specimens. For as much as the load-point deflection at the MOR stage is one of the commonly obtained data from an FPBT, the mid-span curvature was simply estimated for different material properties.
Acknowledgement
None.
Conflict of Interest
No conflict of interest.
References
- Li VC and Leung CKY (1992) Steady-State and Multiple Cracking of Short Random Fiber Composites. Journal of Engineering Mechanics (ASCE) 118(11): 2246-2264.
- Li J, Qiu J, He S, Yang EH (2018) Micromechanics-Based Design of Strain Hardening Cementitious Composites (SHCC). presented at the Strain-Hardening Cement-Based Composites. SHCC 2017. RILEM Bookseries.
- Li VC, Wu HC, Maâlej M, Mishra DK, Hashida T (1996) Tensile Behavior of Cement-Based Composites with Random Discontinuous Steel Fibers. The American Ceramic Society.
- Kang ST, Choi Ji, Koh KT, Lee KS, Lee BYJCS (2016) Hybrid effects of steel fiber and microfiber on the tensile behavior of ultra-high-performance concrete. Composite Structures 145: 37-42.
- DG Soltan, das Neves P, Olvera A, Savastano Junior H, Li VC (2017) Introducing a Curauá Fiber Reinforced Cement-Based Composite with Strain-Hardening Behavior. Industrial Crops and Products 103: 1-12.
- Li V (2008) Engineered Cementitious Composite (ECC): Material, Structural, and Durability Performance. In: EG Nawy (Ed.) Concrete Construction Engineering Handbook, Boca Raton: CRC Press 24-1: 24-46.
- Li VC, Wu HC (1992) Conditions for Pseudo Strain-Hardening in Fiber Reinforced Brittle Matrix Composites. Applied Mechanics Reviews 45(8): 390-398.
- Li V (1993) From Micromechanics to Structural Engineering - The Design of Cementitious Composites for Civil Engineering Applications. JSCE Journal of Structural Mechanics and Earthquake Engineering 10: 37-48.
- Li VC, Mishra DK, Wu HC (1995) Matrix design for pseudo-strain-hardening fibre reinforced cementitious composites. Materials and Structures 28(10): 586-595.
- Li V, Wu HC, Chan YW (1996) Effect of Plasma Treatment of Polyethylene Fibers on Interface and Cementitious Composite Properties. The American Ceramic Society 79: 700-704.
- Li V, Wu C, Wang S, Ogawa A, Saito T (2002) Interface Tailoring for Strain-Hardening Polyvinyl Alcohol Engineered Cementitious Composite (PVA-ECC). ACI Materials Journal 99(5): 463-472.
- Felekoglu B, Tosun-Felekoglu K, Ranade R, Zhang Q, Li VC (2014) Influence of matrix flowability, fiber mixing procedure, and curing conditions on the mechanical performance of HTPP-ECC. Composites Part B: Engineering 60(359-370).
- Yang EH (2008) Designing Added Functions in Engineered Cementitious Composites. Ph.D. Thesis, Civil Engineering, The University of Michigan.
- Lee BY, Li VC, Kim YY (2013) Polypropylene Fiber-Based Strain-Hardening Cementitious Composites. presented at the Advances in Structural Engineering and Mechanics (ASEM 13), Jeju, Korea.
- Zhang Q, VC Li (2018) Micromechanics of an Ultra Lightweight Engineered Cementitious Composite Containing Polymeric Latex Admixture in Strain-Hardening Cement-Based Composites (RILEM Bookseries) pp.70-78.
- Bakharev T, Sanjayan JG, Cheng YB (1999) Alkali activation of Australian slag cements. Cement and Concrete Research, 29(1): 113-120.
- Provis J, Deventer Jv (2014) Alkali Activated Materials (RILEM State-of-the-Art Reports, no. 13). Springer Netherlands, pp. XIV, 388.
- Taghvaie H, Behfarnia K, Khalili M (2018) The Effect of Alkali Concentration and Sodium Silicate Modulus on the Properties of Alkali-Activated Slag Concrete. Advanced Concrete Technology. 16: 293-305.
- Bakharev T, Sanjayan JG, Cheng YB (1999) Effect of Elevated Temperature Curing on Properties of Alkali-Activated Slag Concrete. Cement and Concrete Research 29(10).
- Kanakubo T (2006) Tensile Characteristics Evaluation Method for Ductile Fiber-Reinforced Cementitious Composites. Journal of Advanced Concrete Technology Copyright 4: 3-17.
- Qi Z, Huang Z, Li H, Chen W (2019) Study of Flexural Response in Strain Hardening Cementitious Composites Based on Proposed Parametric Model. 12(1): 113.
- Qian S, Li V (2007) Simplified Inverse Method for Determining the Tensile Strain Capacity of Strain Hardening Cementitious Composites. Advanced Concrete Technology 5: 235-246.
- Qian S, Li VC (2008) Simplified Inverse Method for Determining the Tensile Properties of Strain Hardening Cementitious Composites (SHCC). Journal of Advanced Concrete Technology 6(2): 353-363.
- JCI Standard (2006) Method of Test for Bending Moment-Curvature Curve of Fiber-Reinforced Cementitious Composites. Journal of Advanced Concrete Technology 4(1): 73-78.
- AC 544 (2016) Report on Indirect Method to Obtain Stress-Strain Response of Fiber-Reinforced Concrete (FRC). American Concrete Institute.
- Baby F, Graybeal B, Marchand P, Toutlemonde FO (2012) UHPFRC Tensile Behavior Characterization: Inverse Analysis of Four-Point Bending Test Results. Materials and Structures 46: 1337–1354.
- Suryanto B, Cockburn B, Lie HA, McCarter WJ (2017) An Alternative Method for Determining Tensile Properties of Engineered Cementitious Composites. Procedia Engineering 171: 584-591.
- López J (2017) Characterisation of the Tensile Behaviour of UHPFRC by Means of Four-Point Bending Tests. Politècnica, Valè
- Ma C, Long G, Shi Y, Xie Y (2018) Preparation of Cleaner One-Part Geopolymer by Investigating Different Types of Commercial Sodium Metasilicate in China. Journal of Cleaner Production 201: 636-647.
- Co SC (2019) Available: http://www.sepahancement.com/home/en/
- ASTM C1609/ C1609M (2007) Standard Test Method for Flexural Performance of Fiber-Reinforced Concrete (Using Beam with Third-Point Loading).
- ASTM C39 / C39M-16 (2016) Standard Test Method for Compressive Strength of Cylindrical Concrete Specimens.
- ASTM C469 / C469M-02 (2002) Standard Test Method for Static Modulus of Elasticity and Poisson’s Ratio of Concrete in Compression.
- Pan B, Qian K, Xie H, Asundi A (2009) Two-Dimensional Digital Image Correlation for In-Plane Displacement and Strain Measurement: a Review. Measurement Science and Technology 20(6): 062001.
- (2015) GOM Correlate Professional: Inspection ‒ 3D Testing. ed. Germany: Gom GmbH.
- (2016) GOM Testing Technical Documentation: Digital Image Correlation and Strain Computation Basics. ed. Germany: Gom GmbH.
- Correlate G (2020) Precise Industrial 3D Metrology.
- Maalej M, Li V (1994) Flexural/Tensile Strength Ratio in Engineered Cementitious Composites. Materials in Civil Engineering 6: 513-528.
- Popov EP (1990) Engineering Mechanics of Solids. Englewood Cliffs NJ: Prentice Hall.
-
Nader Zad, Hani Melhem. Response Modal Nonlinear Time-History Dynamic Analyses of the Northridge Earthquake of a Two-Storied Steel Structure with Rubber Isolator and Fixed-Base Systems. Cur Trends Civil & Struct Eng. 8(2): 2022. CTCSE. MS.ID.000687.
-
Flexural Deflection-Hardening; Strain-Hardening Cementitious Composites (SHCC); Polypropylene (PP) fiber; Alkali-Activated Slag (AAS); Strain Distribution; Curvature Distribution; Digital Image Correlation (DIC)
-

This work is licensed under a Creative Commons Attribution-NonCommercial 4.0 International License.


