 Research Article
Probabilistic Bridge Deterioration Prediction, Applied Analytics, and Predictive Modeling
Alireza Jamalipour, Department of Civil, Environmental, and Biomedical Engineering University of Hartford, West Hartford, Connecticut 06117, USA.
Received Date:November 02, 2022; Published Date:December 14, 2022
Abstract
Designing a new bridge structure or designing the rehabilitation of an existing bridge is a time-consuming process. It is important for bridge owners to proactively assess their structures to make sure that by the time rehabilitation or replacement is required, the design phase elements of such a project, including necessary permits, are ready. Assessing future bridge structure condition also helps the owner to evaluate a variety of design choices or options based on the risk imposed by each alternative. Federal regulations (MAP-21) have required state transportation agencies to implement asset management performance measures. Asset management performance strategies are arguably principal in guiding transportation infrastructure investments. Predicting future asset condition helps businesses and engineers to allocate and utilize the available resources in a direction that keeps the existing bridge inventory in the best possible condition, as well as serves the public. Prediction of bridge future condition also assists engineers and bridge owners in making decisions based upon quality information and well-defined and considered objectives [1]. The core element of any bridge management system is the database containing physical condition–rating data obtained through regular inspection and maintenance activities over a significant amount of time. Consequently, asset management relies on having an accurate inventory and condition assessment of assets in real time. One significant problem lies in the stochastic nature of traffic that transpires over time. This research focused on using the Markov process to predict future bridge condition state based on bridge inspection data inputs. Markov chain modeling was selected for this study because bridge condition ratings have a stochastic nature that requires an appropriate deterioration prediction method. The goal was to create a computational tool to predict bridge and highway degradation and assess such a structure’s long- term performance. As a proposed update to the National Bridge Inspection Standard, this study offers two methods for making changes to bridge inspection intervals. Both ways consider risk a significant contributing factor to the deciding criteria, for which this paper presents methodology to perform such a risk calculation..
Keywords:Bridge condition; Bridge risk; Condition assessment; Bridge asset; Markov chain
Background
From the onset of modern civilization, bridges have been iconic images and vital transportation components that have helped connect our world. From early design forms using natural resources to modern engineering techniques and advances in building materials, bridge construction has evolved with humankind’s increasing demands. Today’s bridges are a part of daily routes for most people, and as a result, transportation agencies face a myriad of challenges to optimize the flow of goods and people. From ensuring the operability of aging structures to planning, financing, rehabilitating, and constructing modern replacements that improve accessibility, finding solutions to bridge challenges is essential to our social and economic development. Bridges serve as critical features of an infrastructure system and require regular inspections to ensure their safe and operable condition for the public. According to a Federal Highway Administration (FHWA) report [2], approximately 600,000 bridges exist in the United States as of 2010, more than 25% of which are either structurally deficient or functionally obsolete and in need of maintenance, repair, rehabilitation, improvement, or replacement. The National Bridge Inventor y (NBI) database, compiled by the FHWA and state departments of transportation, contains detailed historical data on more than 600,000 bridges collected over the past 28 years. For instance, the Connecticut Department of Transportation has compiled and maintains inventory and inspection data on the bridges in it state.
Typical bridge databases include the following information: bridge designation, structural type, operational condition, geometric data, function descriptions, inspection records, etc. This information presents a tremendous resource for analysis, much of which has paramount potential for engineering insight. Researchers can discover inherent patterns and trends by investigating the relationships between data sets using novel data-mining approaches. Pertinent studies of these databases are therefore needed to better understand bridge deterioration patterns and related events.
Objective
Typically, bridge inspections occur every 2 years (or 24 months). However, a delay of bridge inspections happens when there is a low likelihood for a structure-diminishing event to occur. Such an event would consequentially lower the condition rating of the bridge. Conversely, if these events happen frequently, then so do inspections. To quantify the possibility of these events, one can calculate risk. As a general rule of thumb, civil engineers mathematically define risk as
Risk = Likelihood ×Consequence
The likelihood is the probability of a bridge or a bridge component moving into a certain deteriorated condition in a given period. The consequence is calculated from the replacement or repair cost of that component to deliver the public’s required service level [3]. In that regard, probability, or the likelihood of such a deteriorated condition, can be a critical factor in proactively evaluating the risk level—and consequently, the reliability of a given bridge and its components. Current literature on this topic does not present accurate and straightforward methods for calculating the probability of a bridge’s condition or state as it changes over time. This work aimed to calculate the probability of a given bridge changing its condition rating based on stochastic methodology such as Markov modeling or based on condition ratings alone.
Methods
In mathematics, “stochastic” is often synonymous with “random.” Therefore, stochastic models are based on random trials, whereas deterministic models always produce the same output for a given starting condition. A stochastic process consists of a sequence of indexed random variables separated by spaced points in time. The random variable in such a process is denoted by 𝑋𝑛. The spaces in time are used as the index for the independent variable, declaring 𝑛 = 1,2,3 as the period’s designation. At a given point in time, a random variable can contain a range of values called states. These states can fall into one or more mutually exclusive categories. A Markov chain quantifies the probability of a process where the outcome of a series of events can influence the next event in the process; it consists of states and transitions governed by random variables resulting from a random phenomenon. The Markov model is a mathematical system introduced by 19th-century Russian mathematician Andrey Markov, best known for his work on stochastic processes, which later became known as Markov chains and Markov processes [3]. Historically, using a Markov chain quantifies the probability of a process where the series of events can influence the next likely event in the process. A Markov chain consists of states and transitions governed by random dependent variables defined based on a given event; it is a conversion model that considers any current system’s state and then processes the transition from one state to another using probability theory [4]. This mathematical process is based on the transition through different states using the law of total probability, which claims that any distribution toward the next state is solely dependent on the current state rather than on the sequence of preceding events.
On the contrary, a stochastic process describes some random
variable’s history as it evolves with time [5]. Each state has its
predetermined probability for either transforming states or
remaining in its current state. In this study, applying the Markov
model to existing bridge data established a stochastic model for
bridge inspection condition data. The random variable is the
condition rating, 𝑋𝑛. In this case, period 𝑛 refers to the year at which a condition rating of an individual bridge is received. State
𝑖 refers to the state that a bridge is in, i.e., its condition rating itself. The Markov chain is one of the most applied categories of
random processes. The simplicity of the Markov model lies in the
assumptions necessary to specify such a process:
1. The distance sequence of observed states is equal.
2. Given the current state of a random process, the next
state’s conditional probability depends only on the current state.
It is independent of the prior states throughout the history of its
process.
The last assumption is known as the Markov property. If this
property is not assumed, then preliminary information about the
process would need to be given to categorize a process in the same
manner. By applying these assumptions to the working bridge
model, the following assumptions were made:
1. Each condition rating is recorded at equal points in time.
For this study, each condition rating is assigned yearly.
2. Each condition rating is independent of the condition
ratings given prior. In other words, the rating of a bridge does not
depend on the ratings it has received before that.
For this research project’s duration, the National Bridge Inspection Standard (NBIS) metric system developed by FHWA was adopted and used; it consists of 10 condition ratings, 0 being the worst and 9 being the best case. The first two condition ratings of 0 and 1 indicate that the highway is not safe to travel. A bridge containing the highest level of 9 indicates excellent condition, i.e., there are no working issues impacting the bridge’s quality. The condition ratings of 4 through 6 are good candidates for maintenance work, whereas bridges containing condition ratings less than 4 are considered for rehabilitation or even replacement entirely. If a bridge is considered a significant bridge, no closure can occur because these major bridges are responsible for necessary routes for daily commutes. Suppose the present inspection outcome’s knowledge cannot be considered sufficient to predict the next or future inspection outcome. In that case, both the present and previous inspection ratings can provide the prediction of the outcome. In other words, any future structure rating has a relationship with the structure’s present and past inspection ratings. Therefore, a prediction for the structure’s deterioration is possible if the history of transitions from one rating state to another can be estimated.
In the working bridge prediction model studied here, using a minimum of six states yielded significant results. State 3 represents a condition rating of 3, state 4 represents a condition rating of 4, and so forth. Considering that significant bridge structures cannot be out of service or nonfunctional, removing states 3 and below simplified the calculation. Conversely, this also applied to state 9 because its occurrence is rare. Each state’s probability was calculated from these bridges’ history as a group and not as individuals. It was noticed in the conducted literature review that prior work on this method has declared that a bridge structure maintains its current level or decays to the next lower level within 2 consecutive years. Therefore, if the probability of being in the current state is P, then the probability of moving to the next lower state is 1 – P. In such a model, only sequential movements or transitions between states require consideration. However, in this study, no restriction was given to the change from one state to another. In actuality, the probability of changing state was calculated based on the historical data. If past data suggested that no change between two states ever happened, then the possibility of such change was calculated as 0.
Transition and Transitional Probabilities
If at year 𝑛, the chain is in condition rating 𝐶𝑅𝑖, then the random variable would be

Notation 𝐶𝑅𝑖 designates a condition rating for a given year. Subscript 𝑖 designates the condition rating for the process and not the actual year associated with the rating. The probability that a given bridge receives condition rating 𝐶𝑅𝑖 during a given year 𝑛 is denoted by

The conditional probability that the given bridge receives conditional rating 𝐶𝑅𝑗 during the following year, n + 1, given that it received rating 𝐶𝑅𝑖 during year 𝑛 is

This expression equates to the transitional probability. The
exponent is 1 because this transitional probability is for the period/
step between states and not for the individual states themselves.
The transitional probability
1. represents the conditional probability that if the chain is
in state 𝑖 at the current year, it arrives at state 𝑗 in the next year
2. represents a one-step transition because it is the
probability of making a transition in one time period or step, in the
case, a year
3. is assumed to be steady over time, meaning it does not
change with time
The Markov property ensures that a transitional probability depends only on the present process,
𝑋𝑛. In other words, the history of the process occupied before the present state does not matter. Therefore,

where 𝑚 = 𝑛 + δ𝑛 and δ𝑛 is any increment of steps. In general, the starting year has a subscript 𝑖, and the subsequent year is 𝑗. To indicate a year range in which the conditional probability consists of, we use n, the starting year, and m, the ending year. The use of a hyphen indicates the inclusion of the years in between:

Variable 𝑗 signifies a different year, which is not necessarily the next year after the current.
The transitional probabilities for a Markov chain with 𝐶𝑅𝑖𝑗 states are in a 𝐶𝑅𝑗 × 𝐶𝑅𝑗 square matrix called a one-step Markov transitional probability matrix, or a Markov Transitional Matrix (MTM), which is denoted by 𝑃. Each row of 𝑃 represents the present state, 𝑋𝑛, of a given bridge or range of bridges, at a given year, n. Each column represents the next state at another year, 𝑋𝑚. Because the probability of transition conditions itself on its present state, the entries in every row of 𝑃 sum to 1. Also, all entries are nonnegative, and no entry can be greater than 1. Matrix 𝑃 is called a stochastic matrix. A Markov chain with six possible states is shown in Table 1 (Table 1).
The rows (𝐶𝑅𝑗) indicate the starting state, whereas the columns designate the subsequent state. For the element in the first row, second column, 𝑝12 represents the probability of going to state 2, starting at state 1. The initial-state probability for state Xm = CRj at the start of a process is defined in each row. An MTM contains a row vector of initial-state probabilities. These probabilities are in the corresponding row of the MTM. The designation is as follows:

A row matrix also serves as a designation denoted by 𝑋𝑛:

If we apply the law of total probability, we can express this initial-state probability vector in the following terms:

where 𝑖0 is the lower limit of the condition rating, and 𝑗 is the upper limit of the condition rating. Each row of the MTM indicates a different initial probability vector. Each vector also represents an initial probability distribution. Each term indicates the initial probability of a bridge receiving condition rating 𝐶𝑅𝑗 given that its initial rating was 𝐶𝑅i. Another formulation of this is in the form of a 𝐶𝑅𝑗 × 1 matrix, which signifies the probability of being rated 𝐶𝑅𝑗 for a bridge starting at 𝐶𝑅i.
This concept can be used to predict the probability of a bridge changing state at any given year, 𝑛. The initial probability matrix for another point in time can be found by raising the MTM to the desired number of years. For example, if an MTM comprises a year range of 1992 to 2011, the initial probability vector for 2015 can be found by raising the MTM to the fourth power and multiplying by a sparse initial probability row vector with a 1 in the index of the state that is desired to predict. For six states, the initial probability matrix is a 6 × 6 identity matrix:

Approximately 100,000 inspection records of all bridge structures and 1,800 inspection records of significant bridge structures in the State of Connecticut were used to calculate the MTM spanning from 1992 to 2011. These data are referred to as the “actual.” The remaining inspection records from 2011 to 2015 were used to create another MTM as a means of model prediction comparison versus the actual data to indicate the bridge conditions as inspected in the subsequent year.
Results
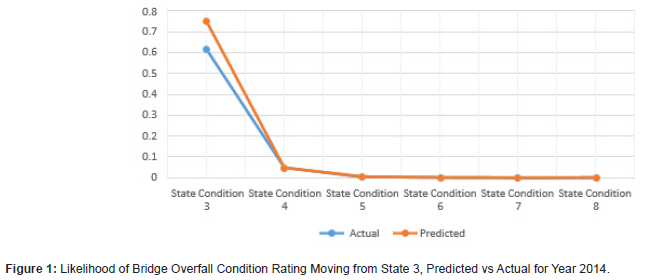
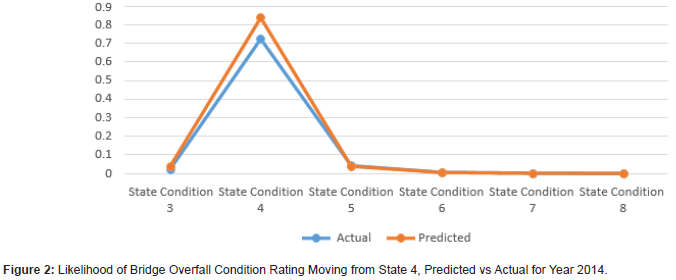
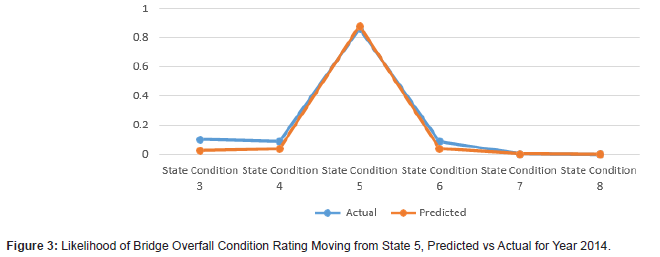
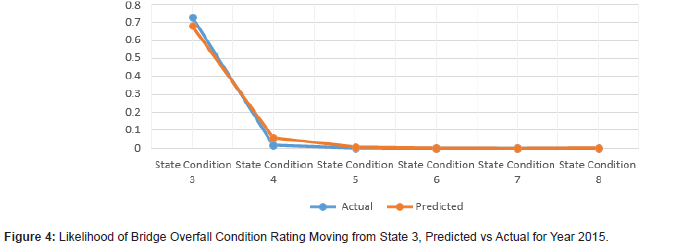
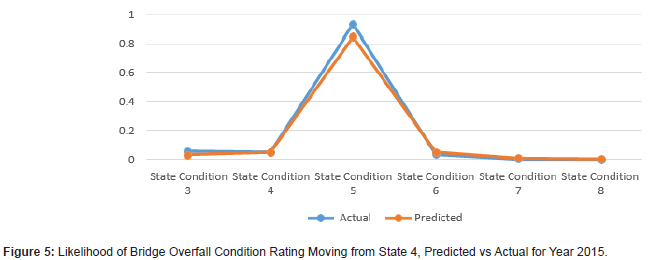
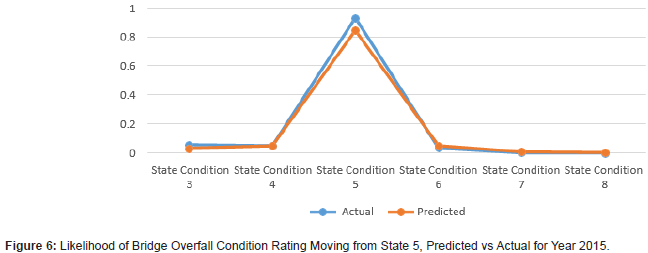
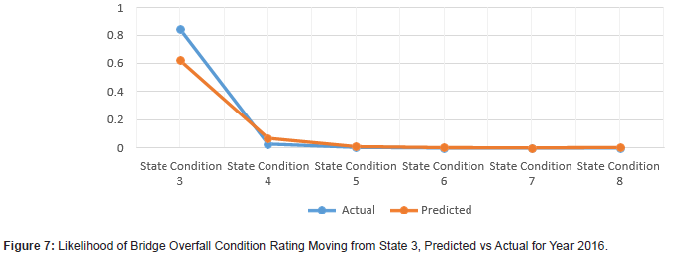
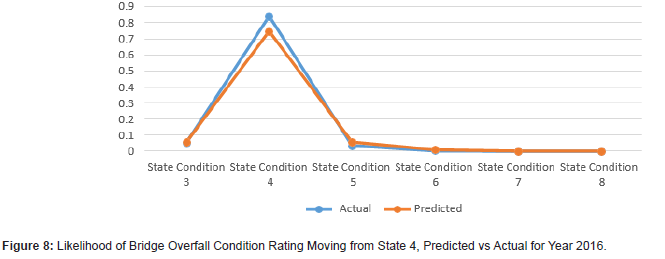
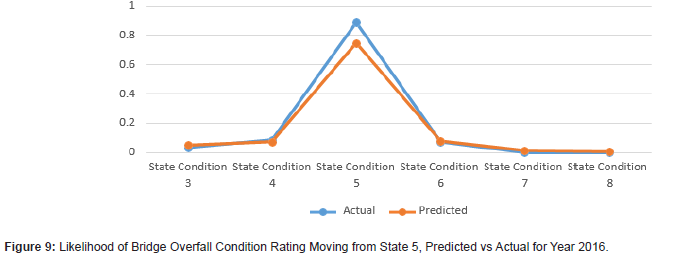
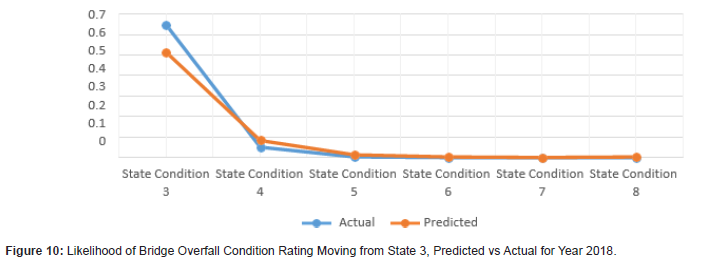
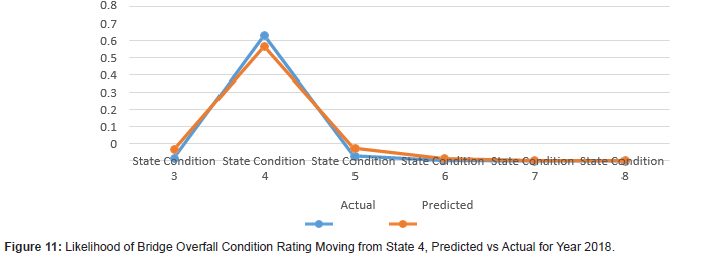
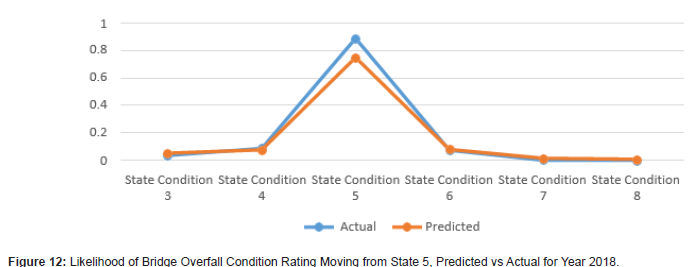
The results demonstrate that using Markov models for bridge condition prediction can prove to be useful (Figures 1 to 12). The results show the transitional probabilities of a bridge’s condition rating going to 3 through 5 (Table 2). The results also show the mean square error (MSE) and the mean absolute deviation (MAD) for each predicted year between 2014 and 2018. The prediction methodology works best for years closest to the last year in the actual data set. As the year range increases, so do the MSE and MAD until 2017. At that point, the MSE and MAD slightly decrease and then decline for the calculated following years. Overall, the error and deviation are under 10%, which is reasonable and within the acceptable margin, considering the size of the available data and the data’s stochastic nature. The prediction errors for states 3 and 8 are relatively large compared to the other states, suggesting that a bridge tends to move within one or two states. However, it is unlikely that a bridge degrades from an 8 to a 3 and vice versa. Even though this may be the case for this given data set, the Markov model can deal with any random data set because the transition probabilities update based on the amount of data. The developed Markov model can significantly improve the accuracy of the predicted future condition ratings of bridges, assisting agencies in their bridge program planning. These findings help to identify the most efficient maintenance activities and timing for an individual bridge or network of bridges. For future works, careful consideration of the condition rating limitations of the current study should be investigated, as well as individual characteristics of bridges, design types, data accuracy, and the intrinsic limitations of Markov models (Figures 1-12) (Tables 2,3).
Table 1:Probability of Transitions in Markov Chain.

Table 2:The error and deviation of the transitional probabilities for the predicted and actual data sets.

**Mean square error (below 10% is an acceptable model) ***Mean absolute deviation (below 10% is an acceptable model)
Table 13:The error and deviation of the transitional probabilities for all states.

Conclusions
For the current work, the State of Connecticut bridge condition data were analyzed over the past 22 years using a Markov chain model to forecast each bridge’s future condition. This forecasting allows owners of these structures to identify structural and financial requirements more accurately to maintain these major structures in an acceptable state. Any cost associated with repair, maintenance, or rehabilitation can be calculated more accurately from the bridge’s predicted condition. Further modeling processes can be conducted to establish future conservation and rehabilitation strategies by applying a Markov reward model to convert inspection condition data into a more practical cost-reliability analysis.
Acknowledgment
None.
Conflict of Interest
No conflict of interest.
References
- DOTFT Administration (2017) Condition Assessment Calculation.
- FHWA (2018) National Bridge Inventory - Bridge Inspection - Safety - Bridges & Structures - Federal Highway Administration.
- Wu D, Yuan C, Kumfer W, Liu H (2017) A life-cycle optimization model using semi- markov process for highway bridge maintenance. Appl. Math. Model.
- Wu SJ and Chu MT (2015) Constructing optimal transition matrix for Markov chain Monte Carlo. Linear Algebra Appl.
- (2013) LTBP Bridge Performance Primer.
-
Alireza Jamalipour* and Jeffrey Severino. Probabilistic Bridge Deterioration Prediction, Applied Analytics, and Predictive Modeling. Cur Trends Civil & Struct Eng. 9(3): 2022. CTCSE.MS.ID.000712.
-
Bridge condition, Bridge risk, Condition assessment, Bridge asset, Markov chain
-

This work is licensed under a Creative Commons Attribution-NonCommercial 4.0 International License.


