


 Research Article
Development of the Amplification Factor Fa and Fv map based on the Earthquake Acceleration Map on ground surface and in Base Rock and Seismic Code
Received Date:February 17, 2023; Published Date:March 09, 2023
Abstract
The great rocking of the building structure in general caused by an earthquake shaking. The earthquake wave produce by an earthquake was the main cause of the shaking. To show the effect of the rocking of the earthquake ground motion to structure response, so it’s needed the structural analysis and the artificial earthquake ground motion time history. The artificial time history can be developed based on spectral matching with the target spectrum generating by the probabilistic seismic hazard analysis. Therefore, the time history that found from the analysis can be called derived with the probabilistic procedure. The time history was used as a basis in the response structure analysis. The result of the analysis was displacement of the structure that can be used as a basis to call the structure of the Law Faculty building of the Islamic University of Indonesia save to the earthquake shaking design.
Keywords:The ground motion; Time history; Probabilistic; Structure response
Introduction
The amplification factor Fa and Fv were the two coefficients that can be utilized to change the earthquake acceleration in the base rock, result of computational probabilistically to be the earthquake acceleration design on the ground surface. Making the amplification map of Fa and Fv were needed to find the overview of how big the amplification value that can be occurred on a reviewed site. The maps were developed based on the earthquake acceleration value in base rock and in the ground surface. The Fa and Fv maps also can be developed through seismic code based on seismic hazard map in the base rock. Based on the topic that was discuss above so before the Fa and Fv map was obtained, should be developed the seismic hazard maps with the base rock and ground surface site. Development of the earthquake ground motion map in many forms and for many purposes had been carried out much by the experts. The earthquake ground motion was the motion caused by an earthquake. The motion commonly characterizes by acceleration, velocity or displacement of the motion. The earthquake ground motion in form of the acceleration can be obtained with measurement. Why the acceleration should be measured, because the acceleration can be converted to be a force based on the second Newton law. If it is needed an earthquake acceleration value with certain magnitude and distance of the site to the source, so the value it is not easy to be found in the measurement result catalog. In this case, it is needed the other model to obtain the earthquake acceleration. The model is do the computation deterministically based on the Ground Motion Prediction Equation (GMPE) model or can be computed probabilis- tically with Probabilistic Seismic Hazard Analysis (PSHA). Based on the above paragraph, that have been discussed, so in the research was developed seismic hazard map probabilistically in base rock and the ground surface for Bali and Lombok Islands Figure 1 as a case study (Figure 1).

Research that associated with the development of the seismic hazard map has been carried out by Petersen et al. [1]. Petersen et al developed seismic hazard map of Sumatra and Malaysian Peninsula PSHA. Petersen et al [2] developed seismic hazard map for the Southeast Asia with PSHA. Makrup et al [3] developed seismic hazard map of Sumatra with PSHA. Irsyam et al [4] developed seismic hazard map of Sumatra and Java islands with PSHA. Suhaimi et al [5] carried out microzonation for Sumatran fault. Supartoyo [6] developed seismic hazard map for West Java, Indonesia. Makrup [7] developed seismic hazard map as a basis to develop the disaggregation hazard map for Indonesia. Asrurrifak [8] developed acceleration spectra map for earthquake resistance structure design. Nicolaou [9] developed seismic hazard map for the United States of America with area seismic sources. Elvis [10] developed seismic hazard map in the ground surface and in base rock for Riau Provence. Irsyam et al. [11] developed seismic hazard map for planning of change of Indonesian seismic code. In the research will be developed two seismic hazard maps probabilistically, the first in base rock and the second on ground surface for Bali and Lombok Islands Indonesia. Base on both map data and seismic code will be developed two map of amplification factor Fa and Fv (ASCE 7-10, 2013). The first Fa and Fv map developed with seismic hazard map in base rock and ground surface and the second Fa and Fv map developed based on seismic hazard map in base rock and seismic code. The two Fa and Fv maps then is compared and discussed and take the conclusion as result of the research [12-28].
Probabilistic seismic hazard analysis
Probabilistic concept has allowed uncertainties in the site, location, and rate of recurrence of earthquake and in the variation of the ground motion characteristic with earthquake size and location to be explicitly considered in the evaluation of seismic hazards. Probabilistic seismic hazard analysis provides a framework in which these uncertainties can be identified, quantified, and combined in rational manner to provide more complete picture of seismic hazard. For a given earthquake occurrence [29], the probability of a ground motion parameter A will exceed a particular value a can be computed using total probability theorem Equation (1), that is,
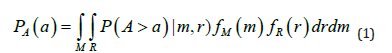
where P (A>a|m,r) is a probability distribution of a particular value a will be exceeded a ground motion parameter A (the distribution was a log normal), fM(m) is a probability distribution of earthquake magnitude that commonly used is an exponential distribution which developed firstly by Gutenberg-Richter [14], fR(r) is a relative probability distribution of distance. Equation (1) is very difficult to solve analytically, even it almost cannot be solved analytically. Therefore, the equation should be solved numerically.
Magnitude probability distribution
Magnitude distribution fM(m) is required in PSHA and the distribution developed originated with Gutenberg-Richter’s law [14], Equation (2).
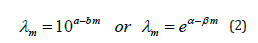
where λm is number of events per-year, a and b are regression constant that can be obtained by statistical procedure and the pa rameter α ≈2.303a, β ≈2.303b. A truncated-below magnitude m0 can be introduced to the preceding formulation (Equation 2) to exclude small magnitudes that can be ignored in engineering analysis. In mostly hazard analysis, m0 ranges between 3 and 5 (EPRI, 1986). So, from Equation (2) can be derived probability density function as:
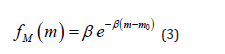
Equation (3) allows probabilities calculation even for very large magnitude (i.e. unrealistic magnitude). To overcome this problem, an upper bound magnitude mu is introduced. It is defined as the largest earthquake likely to occur along an active source [9]. Cornell & Vanmarcke propose a modification to the original Gutenberg- Richter curve, accounting for mu as well as what has already accounted for m0. The actual value of mu should be determined by geological investigation of the region that will provide information about maximum fault rupture and therefore the maximum energy and magnitude that can be produced. The complete probability density function fM(m) for the magnitude range are expressed by:
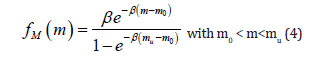
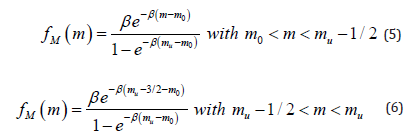
The equation (4) is known as a truncated exponential distribution function. Geologic and seismologic studies on a number of faults have shown that sources tend to repeat large earthquake that closes to their magnitude maximum, call characteristic earthquake. This was explained by observation that fault segment moves by the same distance in each earthquake (constant fault slip rate). The exponential model described in the previous paragraph is based on historical data solely and underestimate the rates of large earthquake as compare to geologic information. Youngs & Coppersmith [31] suggest an alternative recurrence law to account for the seismicity and rate of large event. Their model is called the characteristic earthquake recurrence law. By this approach, the cumulative distribution function flattens close to the maximum magnitude. The probability density function that results from this model is a combination of truncated exponential Gutenberg-Richter model at small magnitude and uniformed distribution close to the maximum magnitude (see Equation 5 and 6).
The recurrence laws both Gutenberg-Richter [14] and Youngs & Coppersmith [31] are used in the PSHA to describe the aleatory uncertainties in magnitude distribution.
Total probability theorem solution and distance probability distribution
A rupture and its magnitude can be occurred on different time and in everywhere on a fault plain. Therefore, probably occurrence of the rupture can be drawn as most of overlapped-rupture-area on whole of the fault plain. All equations related to the total probability theorem should be evaluated on fault plain (i.e. on each rupture area). Relative probability of a rupture that can be occurred on a fault will be the same as relative probability fR(r) of earthquake rupture- to-site distance (Equation 7).
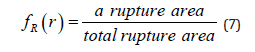
In PSHA the experts were commonly used the rupture width equal to rupture length (McGuire, 2005). Therefore, the same magnitude relates to Equation (7) the rupture length and width are obtained equal to L. Based on above paragraph, then all events that likely will be occurred in the future on a fault with a magnitude value give flatten distance probability distribution.
Probability of seismic parameter to be exceeded
Probability of a ground motion parameter A will exceed a particular value a, P(A>a|m,r), assuming log-normally distributed or logarithm of data are normally distributed (follow Gaussian distribution). According to probabilistic seismic hazard analysis, the standard normal deviate (z*) of the ground motion parameter is:
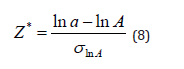
where A is a ground motion parameter will exceed a particular value a. Probability of ″A″ exceed ″a″ P(A>a|m,r) = p(z*) can be looked for in normal distribution table¸ see Figure 3.
Seismic hazard curve
Frequency of a seismic event λ (A>a) for n number of earthquake sources was accounted for by the function:
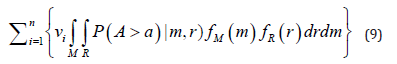
where R is distance rupture-to-site, and M is magnitude. Relation between acceleration a and l(A>a) called seismic hazard curve (Figure 2a). (Figure 2)
According to ground motion prediction relation and its period (the attenuation function) so based on Equation (9) and (10) can be accounted for a spectrum of ground motion parameter (e.g. acceleration ground motion) in probabilistic framework as a curve. The curve was called uniform hazard spectrum (Figure 2b).
Result of seismic hazard calculation
Computation of seismic hazard with PSHA procedure in the base rock and the ground surface has been done for Bali and Lombok Islands, Indonesia. The Ground Motion Prediction Equation (GMPE) that was used in this PSHA are Sadigh et. al. [15], Abrahamson- Silva [16]. Boor-Atkinson [19] for shallow crustal earthquake, and for subduction zone have been used Youngs et. al. [20], and Atkinson- Boore [22]. Calculation was carried out based on the seismic sources and parameters as in Table 1 and 2. The seismic hazard computation on the ground surface needed the data of soil shear wave velocity (VS) see Figure 3 (Figure 3).


Result of probabilistic seismic hazard analysis according to Equation 9 to develop spectra acceleration map can be seen in the Figure 4, 5, 6, 7 (Tables 1,2) (Figures 4-7).


Table:1Subduction source zones and parameters.

NTBT = west and east Nusa Tenggara
Table:2Fault sources and parameters.

Fa and Fv Amplification Factor Map
There are two procedures to calculate Fa and Fv amplification factor i.e. the first, based on the value of seismic hazard on the ground surface divided by the value of seismic hazard in base rock. The second, base on the value of seismic hazard in base rock combination with seismic code (Indonesian seismic code 2019).
Use the data of seismic hazard map on ground surface and in the base rock
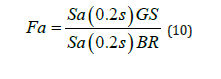
a. Use the data of spectra acceleration map for 0.2s period to calculate the Fa with the Equation (10).
b. Used data of spectra acceleration map for 1.0s period to calculate the Fv with the Equation (11).
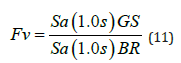
where Sa(0.2s)GS is the spectra acceleration map data for 0.2s period on the Ground Surface (GS), Figure 4, Sa(0.2s)BR is the spectra acceleration map data for 0.2s period on the Base Rock (BR) Figure 5, Sa(1.0s)GS is the spectra acceleration map data for 1.0s period on the ground surface, Figure 6, Sa(1.0s)BR is the spectra acceleration map data for 1.0s period on the base rock Figure 7. Result of generating the Fa map was in Figure 8 and Fv map was in Figure 9 (Figures 8,9).


Use the data of seismic hazard map in the base rock and Indonesian seismic code 2019 (SNI 2019)
c. Use the data of spectra acceleration map for 0.2s period to calculate the Fa with the Indonesian Seismic Code (ISC) 2019. ISC (2019) provide Table 3 to determine the Fa amplification factor, combine with the spectral acceleration map. Table 3 adopt from ASCE-7-10 code 2013 (Table 3).
Result of Fa map determination based on spectral acceleration
map for 0.2s period and ISC(2019) was in the Figure 10 (Figure 10).
d. Use the data of spectra acceleration map for 1.0s period
to calculate the Fv with the Indonesian Seismic Code (ISC) 2019.
ISC (2019) provide Table 4 to determine the Fv amplification factor,
combine with the spectral acceleration map for 1.0s period. Table 4
adopt from ASCE-7-10 code 2013 (Table 4).
Result of Fv map determination based on spectral acceleration map for 1.0s period and ISC(2019) was in the Figure 11 (Figure 11).


Table:3Amplification factor for short period (Fa).

Table:4Amplification factor for period 1.0 second (Fv).

a is a location that should be geotechnical investigation.
Review of the Fa map
Fa amplification factor map was showed in the Figure 12, From the figure can be seen that Fa amplification factor value based on ISC (2019) and spectral acceleration for 0.2s period (Figure 12a) has the Fa value from 0.8 to 1.5. The value smaller than the Fa value that was calculated based on the ratio between spectral acceleration value on the ground surface and spectral acceleration in base rock for 0.2s period. (Figure 12b) with Fa value 1.0-2.0 (Figure 12).

The calculation result of Fa map for Bali and Lombok islands based on ISC (2019) and spectral acceleration map data in base rock for 0.2s period (Figure 12a) was distributed irregular. Commonly in both islands amount of value of Fa calculation result was dominated by Fa value from 0.8 to 1.2. In the central of the map of both islands show the dark red spots with the Fa value range from 1.2 to 1.5. The calculation result of Fa map for Bali and Lombok islands based on the spektral acceleration map data on the ground surface and in base rock for 0.2s period (Figure 12b) was distributed more regular. For western muzzle of the Bali islands (Figure 12b) the Fa value was dominated by value from 1.5 to 2.0. A little to the east of the Bali Island Fa value was distributed north-south direction with range from 1.0 to 1.5. For Lombok Island the Fa value result of the computation was distributed north-south direction with range from 1.0 to 2.0 the pattern of event a little evenly. Therefore, from looking at this condition so can be stated that the computation of the Fa amplification values by the ISC(2019) and spectral acceleration map in base rock for 0.2s period (Figure 12a) have the result that little bit if compared with Fa that computed based on the ratio between spectral acceleration map data on the ground surface divided with spectral acceleration map data in the base rock for 0.2s period (Figure 12b) (Figure 13).

Review of the Fv map
Fa amplification factor map was showed in the Figure 13, From the figure can be noticed that Fv amplification factor value based on Indonesian Seismic Code (ISC) 2019 and the spectral acceleration map data for 1.0s (Figure 13a) has Fv value between 0.7 to 2.0. The Fv value Figure 13a the greater if is compared with Fv value that was computed based on the spectral acceleration map data on the ground surface divided with the spectral acceleration map data in the base rock for 1.0s (Figure 13b) with value range from 0.9 to 1.2. The Fv computation results for Bali and Lombok islands based on ISC (2019) and the spectral acceleration map data for 1.0s period (Figure 13a) is distributed north-south direction with distribution pattern less regular. Commonly in both islands amount of value Fv calculation result was dominated by Fv value range from 1.2 to 1.5. This Fv value, exist on the southern part of both islands. The Fv computation results for Bali and Lombok islands based on the spectral acceleration map data on the ground surface divided by the spectral acceleration map data in the base rock for 1.0s period (Figure 13b) was dominated by Fv value range from 1.0 to 1.2. For Fv value with range from 0.9 to 1.0 was occurred on approaching the north part of both islands. The Fv value in this range was distributed from west to east of the island. Therefore, from this conditions can be stated that the calculation of the Fv amplification factor value with ISC(2019) and spectral acceleration map data for 1.0s period have the Fv values which greater if is compared with Fv amplification factor value which was computed with the spectral acceleration map data on the ground surface divided by the spectral acceleration map data in base rock for 1.0s period [23-32].
Conclusion
The research has produced, the first Fa and Fv amplification factor map based on seismic code and seismic hazard map in the bas rock and the second Fa and Fv amplification factor map based on seismic hazard map on the ground surface divided by seismic hazard map in the base rock. The calculation result of the Fa amplification factor values based on Indonesian seismic code (2019) and the spectral acceleration map data in the base rock for 0.2s period have the result which smaller if is compared with Fa values that was computed based on the spectral acceleration map data on the ground surface divided by the spectral acceleration map data in based rock for 0.2s period. The computation result of the Fv amplification factor values based on Indonesian seismic code (2019) and the spectral acceleration map data in the base rock for 1.0s period have the result that greater if is compared with Fv values that was computed based on the spectral acceleration map data on the ground surface divided by the spectral acceleration map data in based rock for 1.0s period.
Recommendation
The research to develop a map according to the earthquake parameter map, still have opportunity to be carried out. As an example, development of spectral acceleration map and the Fa and Fv amplification factor map for the other locations still can be carried out. So, development of another earthquake parameter map than what was previously mentioned can be done. As an example, also can be developed hazard disaggregation map with the new earthquake data.
Acknowledgment
The author gratefully acknowledgement to head of Civil Engineering Department, Islamic University of Indonesia, that has supported this research in encouragement and funding.
Conflict of Interest
No conflict of interest.
References
- Petersen MD, Dewey J, Hartzell S, Mueller C, Harmsen S, et al. (2004) Probabilistic seismic hazard analysis for Sumatra, Indonesia and across the Southern Malaysian Peninsula. Elsevier.
- Petersen MD, Harmsen S, Mueller C, Haller K, Dewey J, et al. (2008) Probabilistic seismic hazard for Southeast Asia. International Conference of Earthquake Engineering and Disaster Mitigation, Jakarta.
- Makrup L, Irsyam M, Sengara IW, Hendriyawan (2015) Numerical Solution of the Total Probability Theorem in a Three Dimensional Earthquake Source Domain for Developing Seismic Hazard Map and Hazard Spectrum. American Journal of Civil Engineering and Architecture 3(5): 158-164.
- Irsyam M, Dangkua DT, Hendriyawan, Hoedajanto D, Hutapea BM, et al. (2008) The Proposed seismic hazard maps of Sumatra and Java islands and microzonation study of Jakarta city Indonesia. J Earth Syst Sci 117 S2: 865–878.
- Suhaimi A, Marjiono, Saputra SEA (2008) Seismic Zonation and Microzonation on the Great Sumatran fault, Indonesia, International Conference of Earthquake Engineering and Disaster Mitigation, Jakarta.
- Supartoyo, Surono, Solikhin A (2008) Earthquake Hazard Map of Sukabumi, West java Provence, Indonesia, International Conference of Earthquake Engineering and Disaster Mitigation, Jakarta.
- Makrup L (2009) Pengembangan Peta Deagregasi Hazard untuk Indonesia Melalui Pembuatan Software dengan Pemodelan Sumber Gempa Tiga Dimensi, Disertasi, Institut Teknologi Bandung, Indonesia.
- Asrurrifak M (2010) Peta Respon Spektra Indonesia untuk Perencanaan Struktur Bangunan Tahan Gempa dengan Model Sumber Gempa Tiga Dimensi dalam Analisis Probabilistik, Dissertation. Institut of Technology Bandung, Indonesia.
- Nicolaou AS (1998) A GIS Platform for Earthquake Risk Analysis. A dissertation submitted to the Faculty of the Graduate School of State University of New York at Buffalo USA in partial fulfillment of the requirement for the degree of Doctor of Philosophy, August.
- Elvis (2019) Perbandingan Peta Seismic Hazard Berdasarkan Hasil PSHA Batuan Teramplifikasi and PSHA Permukaan di Provinsi Riau, Tesis Master, Magister Teknik Sipil Univesitas Islam Indonesia Yogyakarta.
- Irsyam M, Dangkua DT, Hendriyawan, Hoedajanto D, Hutapea BM, et al. (2008) The Proposed seismic hazard maps of Sumatra and Java islands and microzonation study of Jakarta city, Indonesia.
- Cornell CA (1968) Engineering Seismic Risk Analysis. Bulletin of the Seismological Society of America, 58: 1583-1606.
- Merz HA, Cornell CA (1973) Seismic Risk Analysis Base on Quadratic Magnitude-Frequency Law. Bulletin of the Seismological Society of America, 63(6): 1999-2006.
- Gutenberg B, Richter CF (1944) Frequency of Earthquake in California. Bulletin of the Seismological Society of America, 34(4): 1985-1988.
- Sadigh K, Chang CY, Egan JA, Makdisi F, Young RR (1997) Attenuation Relationships for shallow Crustal Earthquake Based on California Strong Motion Data, Seismological Research Letters, Seismological Society of America.
- Abrahamson NA, Silva WJ (1997) Empirical Response Spectral Attenuation Relations for Shallow Crustal Earthquake. Seismological Research Letters. Seismological Society of America
- Boore DM, Joiner, Fumal (1997) Equations for Estimating Horizontal Response Spectra and Peak Acceleration from Western North American Earthquakes: A Summary of Recent Work, Seismological Research Letters, Seismological Society of America.
- NEHRP (1997) NEHRP Recommended Provisions for Seismic Regulations for New Buildings and Other Structures, Part 1 and Part 2, FEMA-302 and 303. Prepared by the Building Seismic Safety Council for FEMA, Washington DC, USA.
- Atkinson GM, Boore DM (2006) Ground motion prediction equations for earthquakes in eastern North America. Bulletin of the Seismological Society of America 96: 2181¬2205.
- Youngs RR, Chiou SJ, Silva WJ (1997) Strong Ground Motion Attenuation Relationships for Subduction Zone Earthquakes, Seismological Research Letters, Seismological Society of America.
- Atkinson GM, Boore DM (1997) Some Comparisons Between Recent Ground-Motion Relations, Seismological Research Letters, Seismological Society of America.
- Atkinson GM, Boore DM (2003) Empirical Ground Motion Relations for Subduction-Zone Earthquakes and Their Amplification to Cascadia and Other Region. Bulletin of the Seismological Society of America, 93(4): 1703-1729.
- Atkinson GM, Boore DM (1997) Some Comparisons Between Recent Ground-Motion Relations, Seismological Research Letters, Seismological Society of America.
- Crouse CB (1991) Ground-Motion Attenuation Equations for Earthquakes on the Cascadia Subduction Zone, Earthquake Spectra, 2(2): 201-236.
- Gregor NJ, Silva WJ, Wong IG, Youngs RR (2002) Ground Motion Attenuation Relationships for Cascadia Subduction Zone, Bulletin of the Seismological Society of America 92(5): 1923-1932.
- Gregor NJ (2006) Applied by Steve Harmsen in USGS Software Fortran Code.
- Zhao J, Zhang J, Asano A, Onho Y, Oouchi T, et al. (1997) Attenuation relations of strong motion in Japan using the classification based on predominant period. Bulletin of the Seismological Society of America, 96: 898.
- ASCE (2013) Minimum Design Loads for Buildings and Other Structures, Published by the American Society of Civil Engineers 1801 Alexander Bell Drive Reston, Virginia 20191-4400. (This second edition incorporates the corrections as shown in the errata found on www.seinstitute.org, Revision of ASCE 7-98).
- Kramer SL (1996) Geotechnical Earthquake Engineering. Prentice Hall: New Jersey.
- Stein S, Wysession M (2003) An Introduction to Seismology, Earthquakes, and Earth Structure, Geological Magazine. 140(6): 733-734.
- Youngs RR, Coppersmith KJ (1985) Implications of Fault Slip Rates and Earthquake Recurrence Models to probabilistic Seismic Hazard Estimates, Bulletin of the Seismological Society of America, 75(4): 939-964.
- SNI 1726:2019, Procedures for planning earthquake resistance for building and non-building structures, ICS 91.120.25; 91.080.01, National Standardization Agency (BSN).
-

This work is licensed under a Creative Commons Attribution-NonCommercial 4.0 International License.


