 Research Article
A Charge Transfer Determination of Paracetamol with Picric Acid
Nwanisobi Gloria*
Department of Chemical Engineering, Madonna University (Akpugo Campus) Enugu State, Nigeria
Nwanisobi Gloria, Department of Chemical Engineering, Faculty of Engineering and Technology, Madonna University (Akpugo Campus) Enugu State, Nigeria.
Received Date:September 13, 2018; Published Date: October 03, 2018
Abstract
A cost effective and sensitive spectrophotometric method has been developed for the assay of paracetamol in pure and commercial forms. The method employed was charge transfer complexation. Paracetamol formed a 1:2 stoichiometric ratio with picric acid. The complex was quantified at 500nm. Beer –Lambert’s law was obeyed within a concentration range of 5-10ug/ml with molar absorptivity of 2.6 x10⁴Lmol-1cm-1. The method was used for the determination paracetamol in pure and commercial forms with percentage mean recovery of 95%.
Keywords: Paracetamol; Picric acid; Charge transfer complex
Introduction
Paracetamol chemically known as N-acetyl-p-aminophenol and also known as acetaminophen is a widely used analgesic and antipyretic drug [1]. It is sometimes used in combination with caffeine, ibuprofen and diclofenac sodium [2]. Literature has reported the methods for analyzing paracetamol, they include; Spectrophotometry determination of paracetamol with microwave assisted alkaline hydrolysis [3], spectrophotometric determination of paracetamol with ammonium molybdate in strongly acidic medium to produce molybdenum blue [4]. Spectrophotometric Method Development and Validation of Assay of Paracetamol using methanol and water as a diluent [5]. Other reported methods include; Flow injection method [6], HPLC [7], Colorimetry [8] among others. Picric acid also known as 2, 4, 6-trinitrophenol is a pale yellow, odorless crystalline solid that has been used as a military explosive, as a yellow dye and antiseptic [9]. The term charge transfer has been defined to be a certain type of complex which results from reaction of an electron acceptor and an electron donor to form weak bonds [10]. Quantitatively, many pharmaceutical and other nitrogenous compounds using charge transfer methods have been reported in literature [11-13].
Material and Methods
Paracetamol was supplied by Cadila Pharmaceuticals, India. Picric acid was made by BDH Chemicals, England. All Spectroscopic measurements were carried out using a 752W UV-Vis Grating Spectrophotometer with 1cm quartz cell. The chemicals used were of analytical grade.
Absorption spectra
Weigh 0.02g of paracetamol into a beaker dissolving 10ml of ethanol to get a theoretical concentration of 0.002g/ml. Measure 0.02g of picric acid and dissolve it in 10ml of ethanol to get a theoretical concentration of 0.002g/ml. 3ml of paracetamol solution (0.002g/ml) in ethanol was scanned in a UV-Vis spectrophotometer between 200nm-400nm. 3ml of picric acid in ethanol solution was scanned in a UV-Vis spectrophometer between 200-400nm. Color was developed by mixing 2ml of paracetamol solution (0.002g/ml) with 2ml of picric acid solution (0.002g/ml) and scanned between 350-520nm against a blank.
Optimum condition for the formation of paracetamol - picric acid complex
The mole ratio method was adopted [14] for the determination of the stoichiometric ratio. Place 0.5ml each of paracetamol solution (0.002g/ml) in different test-tubes; add enough calculated volume of ethanol for 5ml calibration mark to these test-tubes. Add 2.5ml - 0.25ml in 0.5steps of picric acid solution (0.002g/ml) each into these test-tubes, allow the mixtures to stand for 30minutes at 10℃ before analysis at 500nm.
Calibration plot
The complex mixture of paracetamol (0.002g/ml) solution with picric acid solution (0.0002g/ml) was prepared based on their stoichiometric ratio. Different concentrations ranging from 5-10μg/ ml was prepared and mixed. It was allowed to stand for 30minutes at 10 ℃ before analyses were done at 500nm against a blank.
Quantitative assay
Two tablets of paracetamol were grounded; an amount equivalent to 0.02g was weighed and dissolved in some ethanol. The paracetamol solution was stirred in other to extract the active ingredient, filtered with what man filter paper and made up to 10ml to give a theoretical concentration of 0.002g/ml. 0.002g of picric acid was dissolved in 10ml of ethanol and mixed with paracetamol solution. Different concentrations similar to the one prepared in the standard plot were made, treated before analysis at 500nm against a blank.
Results and Discussions
Absorption spectra
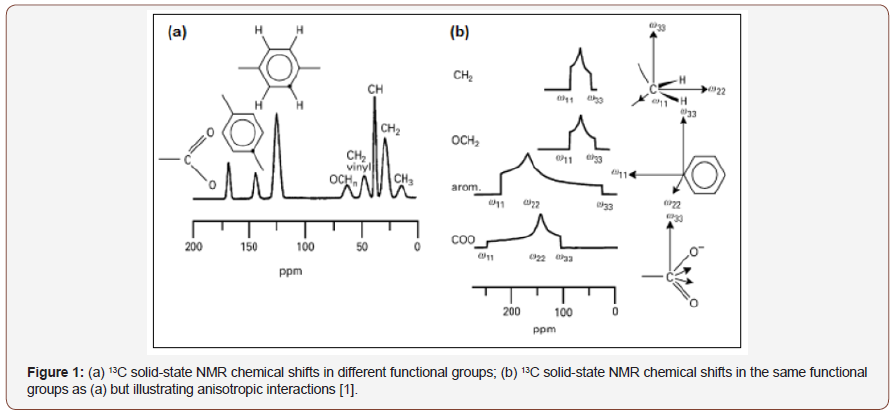
The absorption spectra of paracetamol in ethanol gave its maximum absorption at 250nm (Figure 1). This is similar to a reported work [15] (Figure 1).
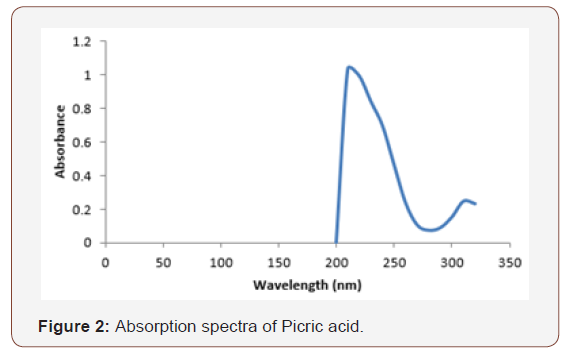
The absorption spectra of picric acid in ethanol gave an absorption peak at 310nm (Figure 2).
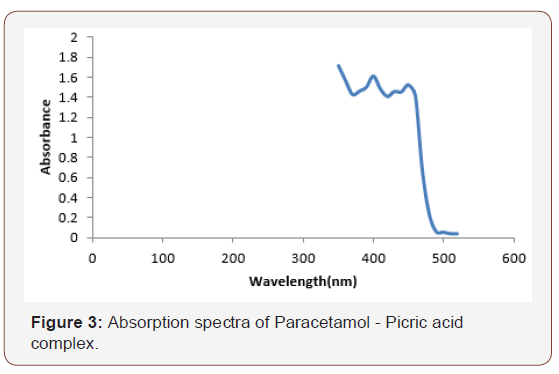
Mixing equimolar portions of paracetamol solution and picric acid solution caused a red shift with an absorption spectrum peaking at 500nm (Figure 3).
Optimum condition for the determination of paracetamol – picric acid complex
The stoichiometric ratio was found to be 1:2 for paracetamol and picric acid (Figure 4).
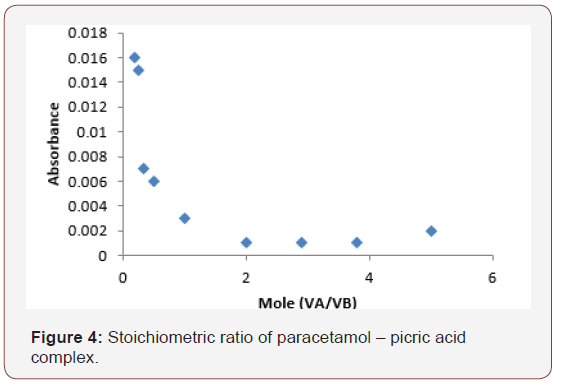
This shows that 1 mole of paracetamol reacted with 2moles of picric acid to form the paracetamol – picric acid complex which is shown in eq. (1).
2A + D→A2D……………………………………………… (1)
Where A represents Paracetamol and D represents Picric acid.
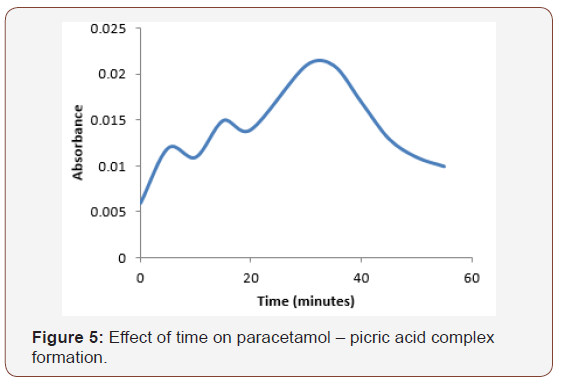
Although the reaction between paracetamol and picric acid was instantaneous (Figure 5), maximum time for the formation of paracetamol –picric acid complex was at 30minutes (Figure 5).
Also, Figure 6 represents the effect of temperature for the formation of paracetamol-picric acid complex. As absorbance is directly proportional to concentration, increase in absorbance has been known as an indication of increase in complex formation [16] (Figure 6).
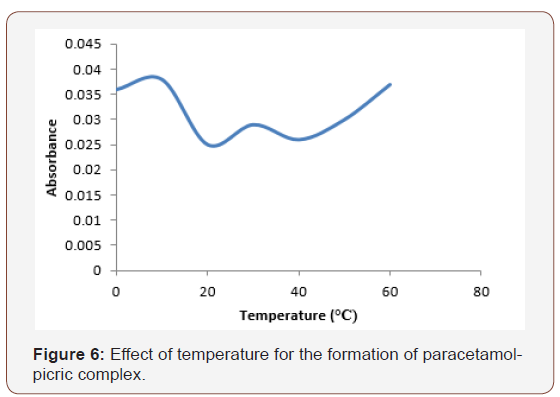
The increase in complex formation was observed from 0ᵒC - 10ᵒC. There was a decrease at 20ᵒC, this has been attributed to the unstable nature of the complex formation resulting from higher collision [16]. The formation of paracetamol –picric acid complex was found favorable at 10℃. This infers that the formation of paracetamol-picric acid complex would be achieved best at 10℃.
Calibration plot and quantitative assay
Beer’s plot for paracetamol-picric acid complex is represented in Figure 7.
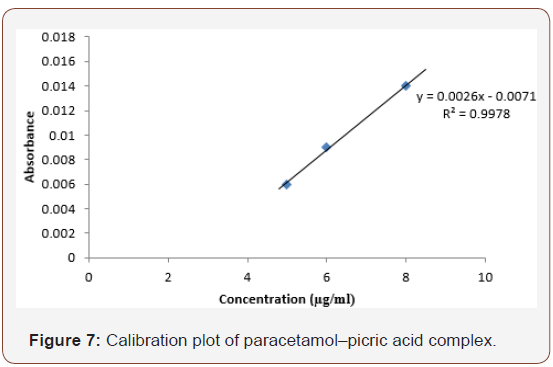
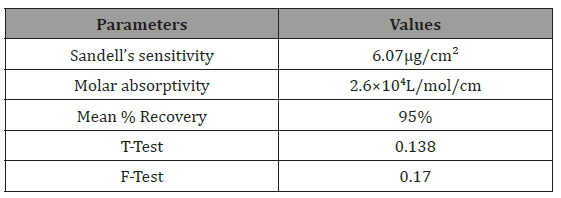
The plot was linear between 5-10μg/ml. This means that Beer’s law was obeyed within these concentrations and analysis can be carried out within these ranges. The mean percentage recovery (Table 1) was calculated from the linear range and was found to be 95%. This is similar to a reported method [17] (Table 1).
Table 1: Quantitative assay of Paracetamol.

The Sandell sensitivity was found to be 6.07μg/cm2 with molar absorptivity of 2.6 x10⁴ L /mol/cm which shows the sensitivity of the method. The T-test and F-test values were found to be 0.138 and 0.170 respectively (Table 2).
Table 2: Parameters for the analysis of Paracetamol complex.
Conclusion
The proposed method is cost effective, simple and sensitive with mean average percentage recovery of 95%. The proposed method was used successfully and can be used for the analysis of Paracetamol both in pure and commercial forms.
Considering studies by Chen [23] on honey samples heated at temperatures 45 °C for 8 h and a filtering process, it may be concluded that the amount of hydrogen peroxide is not indicator of antimicrobial activity but is related to the stability of hydrogen peroxide when honey is subjected to heating and filtration, but the researches shows that more observations should be made to corroborate this observation. In some cases, the antibacterial activity is due entirely to the non-peroxide components such as acidity, osmolarity, flavonoids, phenolic compounds and lysozyme [24]. An advantage of nonperoxide antibacterial activity is that it remains intact after storage of honey for long periods of time [25] and does not change with different conditions of heat and light [25,26]. In relation to non-peroxide and non-active compounds of honey, Yatsunami & Echigo [27] found that low pH honey, in addition to the high honey osmolarity, were responsible for the antibacterial activity.
Acknowledgement
None.
Conflict of Interest
No conflict of interest.
References
- Aghababian R (2010) Essentials of Emergency Medicine. Jones and Bartlett Pubishers, USA, p. 814.
- Nagendra P (2010) Spectrophotometric Estimation of Paracetamol in Bulk and Pharmaceutical Formulations. E-Journal of Chemistry 8(1): 149-152.
- Xu C, Li B (2004) Spectrophotometric Determination, Spectrochim. Acta A Mol Biomol Spectrosc 60(8-9): 1861- 1864.
- Morelli B (1989) Spectrophotometric determination of paracetamol in pure form and in tablets. J Pharm Biomed Anal 7(5): 577-584.
- Behera S, Ghanty S, Ahmad F, Santra S, Banerjee S (2012) UV-Visible Spectrophotometric Method Development and Validation of Assay of Paracetamol Tablet Formulation. J Anal Bioanal Tech 3(6): 151.
- Knochen M, Giglio J, Reis BF (2003) Flow injection spectrophotometric Determination of paracetamol in tablets and oral solutions 33 (2): 191- 197.
- Levent M (2002) HPLC Method for the analysis of paracetamol, caffeine and dipyrone. Turk J Chem 26: 521-528.
- Shihana F, Dissanayake D, Dargan P, Dawson A (2010) A modified low-cost colorimetric method for paracetamol (acetaminophen) measurement in plasma. Clin Toxicol (Phila) 48(1): 42-46.
- Hermann Sprengel (2000) ‘The Discovery of Picric acid as a powerful Explosive. (2nd edn), Eyre and Spottiswoode papers, London, pp. 20-25.
- Nwanisobi G, Ukoha PO (2016) Spectrophotometric determination of niacin using 2, 3-dichloro-5, 6-dicyano-1, 4-benzoquinone. Asian journal of chemistry 28(11): 2371-2374.
- Nwanisobi GC, Egbuna SO (2015) Colorimetric determination of nicotinamide with dichlorodicyano benzoquinone. International Journal of Chem Tech Research 8 (3): 1139-1141.
- Mohamad MA (2003) A spectrophotometric study of charge transfer complexes of thianthrene, Spectrochimica Acta Part A Molecular Spectroscopy 50(4):671-676.
- Gloria N, Pius U (2017) A charge transfer method for the determination of thiamine hydrochloride using 2, 3- dichloro-1, 4 - dicyano-5,6- benzoquinone. Asian journal of physical and chemical sciences 4(3): 1-7.
- Nwanisobi G, Ukoha P (2018) Spectrophotometric and determination of glibenclamide using 2, 3-dichloro-5,6-dicyano-1,4-benzoquinone. Der Pharma Chemica 10(3): 9-15.
- Ramesh LS, Raihan A, Ramdin SS, Darade RS (2012) Spectrophotometric estimation of paracetamol and promethazine in tablet dosage forms. Der Pharma Chemica 4(2): 714-719.
- Nwanisobi G, Ukoha P (2016) Spectrophotometric and determination of erythromycin using 2, 3-dichloro-5,6-dicyano-1,4-benzoquinone. Der Pharma Chemica 8(2): 59-66.
- Onah O, Datukus P (2004) Spectrophotometric determination of procainamide by the method of charge-transfer complexation with chloranilic acid. J Pharm Biores 1(1): 35-40.
-
Nwanisobi G. A Charge Transfer Determination of Paracetamol with Picric Acid. 1(2): 2018. APPR.MS.ID.000507.
-
Paracetamol, Picric acid, Charge transfer complex, Spectrophotometry, Alkaline hydrolysis, Trinitrophenol, Nitrogenous compounds, Pharmaceutical, Absorption spectra, Test-tubes, Calibration plot, Chemicals, Quartz cell, Grating spectrophotometer, Stoichiometric ratio
-

This work is licensed under a Creative Commons Attribution-NonCommercial 4.0 International License.


