 Case Report
Muscle Oxygenation Applications to Endurance Training
Christopher Myers*, Ph.D., CSCS, CISSN
Department of Human Performance, Radford University, USA
Dr. Christopher Myers, Radford University, 801 East Main Street, Radford, VA 24142, USA.
Received Date: June 05, 2020; Published Date: June 15, 2020
Abstract
Near infrared spectroscopy (NIRS) technology has been in use for several decades. NIRS technology provides very insightful data to the athlete and coach and has applications for endurance and strength training. This article presents the physiological concepts NIRS technology detects and works through several case studies on how to utilize and analyze athlete data to improve performance.
Introduction
Near-infrared spectroscopy (NIRS) technology has been in use for several decades. The term NIRS may sound a little intimidating, but it is a technology we have encountered. Many people have seen a physician for a medical appointment or checkup. During the check-in process, a nurse or physician places a sensor on the patient’s index finger and reads the patient’s heart rate and oxygen saturation levels. This device is termed a pulse oximeter; it utilizes NIRS technology. Now, this technology can be utilized in the field to measure changes in hemoglobin in real-time. NIRS technology provides very insightful data to the athlete and coach and has applications for endurance and strength training. This article will focus on NIRS can be used to tailor endurance training to the athlete’s specific needs. However, before starting the discussion on NIRS and its applications to endurance training, a brief review of some key concepts involved with cardiovascular and muscular physiology is warranted.
The Physiology – A Brief Overview
As we breathe ambient air, oxygen flows through the upper and lower respiratory tracts into the lungs. Oxygen passes through the alveoli, where it binds to hemoglobin in erythrocytes (red blood cells), which is governed by Fick’s Law of Diffusion and Dalton’s Law of Partial Pressures. The vascular system transports the erythrocytes to the target tissue. In the capillary beds, oxygen reversibly disassociates from its hemoglobin-oxygen bond and diffuses across the capillary membrane. This aspect of physiology is governed by the Bohr Effect and Fick’s Law of Diffusion [1]. The facet that makes oxygen transportation possible are the heme structures found on hemoglobin and myoglobin proteins.
Heme structure and function
A heme subunit contains 4 nitrogen atoms held together by methyl bridges forming a protoporphyrin IX ring [6,9] [2,3]. At the center of the protoporphyrin ring is an iron cation (Fe2+) [2,3]. The strong positive charge of this ferrous atom allows for oxygen, carbon dioxide, and carbon monoxide to reversible bond to a heme subunit. The special feature of heme subunits are they are found in many proteins within the human body, most significantly hemoglobin and myoglobin [2,3].
Hemoglobin structure and function
Hemoglobin is a protein found on the surface of red-blood cells [1]. Approximately 250 million of these proteins are found on a single red-blood cell [4] [5]. With an average of 5 liters of blood in an adult human, about 13-18 g of hemoglobin/100mL of blood in adult males and 12-16 g of hemoglobin/100dL of blood in adult females [4]. Each hemoglobin contains four subunits with each subunit consisting of a globulin peptide chain and a heme group [3]. The 4 heme subgroups create a ring. This allows for 4 oxygen molecules to covalently bond to the heme ring [3,4]. With this structure, each red-blood cell can carry up to 1 billion molecules of oxygen [5].
Myoglobin (Mb) structure and function
Mb is found within the myofibrils the skeletal muscle. Its structure is similar to Hb but is more simplified. Where Hb has 4 heme subunits, myoglobin has one [1,4,6]. The Mb heme structure consists of the 4 nitrogen protoporphyrin IX ring with the Fe2+ at the center [6,4]. The Mb structure can only transport 1 molecule of oxygen. Due to the high kinetic rate of Mb, its primary function is oxygen storage and transport to the mitochondria. These functions are not mutually exclusive; however, they work in conjunction to facilitate oxygen diffusion [7]. Ultimately, Mb transports the oxygen molecule to the mitochondria to facilitate ATP production in the working muscle.
Mb-Oxygen/Hb-Oxygen Binding Curves
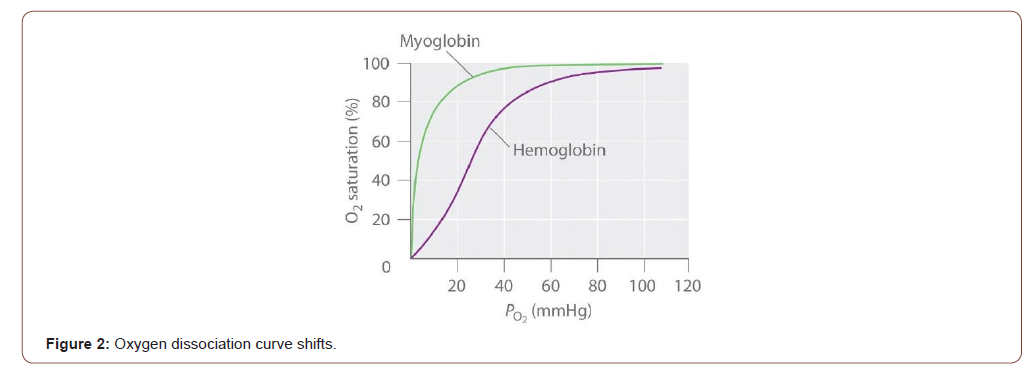
The structures of Mb and Hb dictate how oxygen binds to each protein. As shown in Figure 2, the Mb-Oxygen binding curve has an asymptotic curve [1,4]. As the pressure inside the body increases (X-axis), more oxygen binds to Mb (Y-axis). However, based on the asymptotic shape, the amount of oxygen attaches to Mb occurs quickly (i.e., maximal saturation). The affinity for Mb to bind to oxygen is at its highest in the lungs. The partial pressure is near 100torr in the lungs. As a cell moves away from the lungs, the internal pressure drops. In the relaxed state, the internal pressure is near 20torr [1,4]. Even with the reduced pressure, Mb still has a high affinity for oxygen (Figure 1). This characteristic is what makes this protein the perfect choice for oxygen storage in the tissues. The downside to this aspect is it makes Mb a lousy choice for systematic oxygen transport [4].
The 4-heme structure of Hb makes it a prime protein for systematic oxygen transport. As more and more oxygen binds to a single Hb protein, the Hb’s affinity for bonding with oxygen increases exponentially. This Hb characteristic is termed the hypertrophic effect [4]. This cooperative effect in Hb to find equilibrium give the binding curve as sigmoidal curve as shown in Figure 2 [3].
At the highest pressures, again which is 100 torr in the lungs, Hb is maximally saturated with oxygen molecules. However, as pressure drops, oxygen molecules begin to disassociate from the Hb protein. Looking at Figure 1, when the pressure is at 20torr (i.e. at the site of the muscle), oxygen association with Hb is very low. This means oxygen is released and can diffuse to the target muscle or tissue. This characteristic is what makes Hb a great systematic oxygen transporter [21].
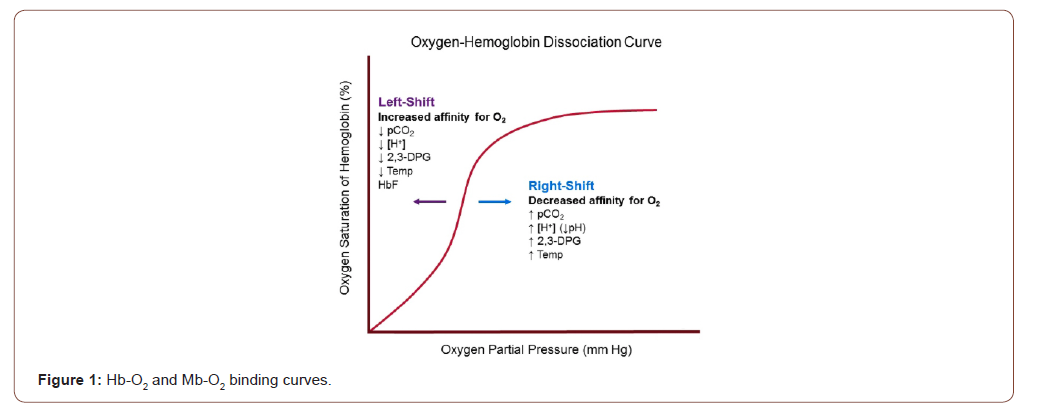
Effects of Exercise on the Hb-Oxygen Binding Curve
One of the side effects of exercise is the increase of carbon dioxide concentrations in the blood. This change, along with other metabolites, causes a decrease in the localized pH (metabolic acidosis) [1,4,8,9]. Furthermore, our body’s internal temperature begins to increase. The factors cause shift of the Hb-Oxygen binding curve to the right (Bohr Effect) [6,10-12] (Figure 2).
This right shift in the curve affects the oxygen’s ability to dissociate from Hb. As shown in Figure 2, the increased carbon dioxide production helps oxygen to be released at a lower pressure. This means oxygen can be easily delivered to the muscles and tissues during times of increased oxygen demand, such as exercise [1,6,11,12].
These last few sections briefly cover some of the main concepts involved with oxygen transport and utilization within the realm of physiology. With more respect to endurance exercise, there is one more key concept to be covered, the Fick’s Principle. This foundational physiology principle allows researchers and clinicians to measure oxygen utilization within tissue.
The Fick’s Principle
As an athlete exercises, the body uses oxygen to create energy or adenosine triphosphate (ATP). When exercise intensity increases, so does oxygen utilization. Oxygen consumption (V̇O2) is calculated through ventilatory methods in a laboratory and field settings. One’s V̇O2 is calculated using the Fick’s Principle which states:
Cardiac output x O2 (arterial-venous) difference = Oxygen consumption [1,4] Equation 1
Breaking up this principle into is subcomponents helps to better understand its complexity. The first of the Fick’s Principle utilizes cardiac output (Q). The equation for Q is as follows:
Q = Heart Rate x Left Ventricle Volume [1,4]
Equation 2
The second half of the equation, the arteriovenous oxygen difference, is the difference in oxygen concentration between the arteries and the veins. Normally, this content can only be measured by ventilatory methods and equipment. However, NIRS technology can indirectly measure the changes in oxygen content especially in the working muscle [12,13]. This aspect is what makes this technology so powerful.
Cardiac output can be estimated. The left ventricle size does not rapidly change; the changes are seen with chronic illness or chronic training. In those cases of chronic training (i.e. the athletic heart), the left ventricle chamber size will reach a maximum capacity. In either case, the only aspect that changes regularly is heart rate. Many endurance athletes know how to measure heart rate and how to utilize it for training. Now, with the advent of NIRS technology, athletes can measure oxygen consumption in real time. This powerful metric, combined with heart rate and other metrics such as pace and power, can give insight on how to better target training and race pacing.
What is NIRS Technology?
NIRS technology is a non-invasive electronic sensor that is capable of measuring in vivo oxidative metabolism in human skeletal muscle [11]. Near infrared (NIR) is a subset of the infrared (IR) light range with a wavelength range of 700-1300nm [11]. Much of the new NIRS technology depends on the physics principle of reflectance, which is outlined by the Beer-Lambert law. This law states that certain materials attenuate the transmission of light at certain wavelengths [11]. The equation has been adapted to match the properties of human muscle and tissue due to its high concentration of water, but the physics properties still apply.
These devices measure the changes in oxygen (HbO2) and deoxygenated hemoglobin (HHb) determines oxygen consumption. NIRS technology is able to measure hemoglobin changes due the way these proteins reflect NIR light. Typically, HHb and HbO2 reflect NIR at 760 and 850nm wavelengths, respectively [12,14,15].
The aspect that make new NIRS technology user friendly is the capability to put the data into a format that can be easily understood. This converted metric is properly named muscle oxygenation saturation (SmO2). This metric’s name denotes the current oxygen content of the working muscle measured at the location of the NIRS device.
What is Muscle Oxygenation Saturation (SmO2)
SmO2is defined as the percent of oxygen hemoglobin and myoglobin are carrying to the muscles. The measurement ranges from 0-100%. Since NIRS technology cannot distinguish between hemoglobin and myoglobin, they are considered in one measurement. SmO2is calculated by:

This metric is a localized measurement on a particular muscle and shows oxygen consumption. Changes in this measurement give direct insights to how much oxygen the target muscle is utilizing, if muscle oxygen demand outweighs oxygen supply, and insights into recovery rates.
Why is it Important to Monitor Smo2 during Training?
The harder the muscles work during exercise, the demand for oxygen increases. As a result, your heart rate is elevated and breathing increases to supply more oxygen to the working muscles. By measuring SmO2 , the athlete can see the oxygen utilization rate in real time. This data point shows if the athlete is pushing beyond the oxygen demands of the target muscle. If this situation occurs, the muscle may no longer be utilizing the aerobic energy pathway but utilizing anaerobic pathway to produce ATP. Eventually, depending on the intensity, the muscle will reach fatigue and reach task failure.
Providing an athlete with access to this information in real time can provide amazing insights. With the second half of this article, several examples are discussed on how to apply SmO2to running and cycling.
Equipment Used
For the following case studies, two (2) Moxy Monitor NIRS (Fortori Designs LLC, Hutchinson, MN) sensors were used. These sensors are capable of penetrating 17mm into the skin and muscle to read hemoglobin changes. One sensor was placed on the right and left quadricep of the athlete. Sensor placement was placed centrally on the belly of the rectus femoris. Skin thickness for each site was 4mm allowing for the Moxy sensors to penetrate 13mm of skeletal muscle tissue. All data was collected with either an Edge 520 or Fenix 3 (Garmin Ltd, Olathe, KS). The graphs were produced using WKO5 analysis software (Training Peaks LLC, Boulder, CO). Finally, each case study is taken directly from a male, short-course triathlete training program.
Case Study
Case study 1- Ramp test
In determining power-based training zones in cycling and running, a field test termed “Function Threshold Power (FTP)” test is performed. By definition, FTP is “the highest power that a rider can maintain in a quasi-steady state without fatiguing” for “approximately one hour” [16]. The concept of FTP was originally developed for cyclists but is now utilized for runners. The FTP allows the athlete or coach to create individual aerobic and anaerobic training zones. For Case Study 1, a FTP ramp test is examined.
This particular ramp test objective was to reach a maximum power output as quickly as possible while staying seated on the bike. The starting wattage is 120W and increases 20W every minute. The triathlete reaches fatigue at 380W (Figure 3).
The Warm-Up: The standard warm-up for this protocol is 5 minutes, as shown in Figure 3. An important aspect is a drop in the SmO2 for both legs (green and purple lines). The decline is showing that demand outweighs the supply. Simultaneously, the heart rate (red line) jumps significantly and then settles into a beautiful trend upward. This occurrence shows the oxygen deficit typically seen in the first 2-5 minutes of exercise [1]. At minute four (4), the SmO2 for the right and left legs were 80% and 85%. The typical SmO2 after vasodilatation is 75-95%. Based on this data, the measured muscles were ready for the ramp test.
For this ramp test, the warm-up is much shorter than typically suggested. The ramp test starts at 120W, which was lower than the ending warm-up wattage. The triathlete did not reach upper endurance zones (i.e., Zone 2/Endurance utilizing the Coggan Power Zones) (1) until minute 8 in Figure 3. Primarily, the ramp test uses the first few minutes to ensure the athlete is sufficiently prepared for the intensity without causing undue fatigue [17].
The Ramp Test: The right and left quadricep stays consistent for the first half of the test. Starting a minute 11:33, the SmO2 begins to drop. The wattage load was 220W. This deflection in the SmO2 shows that the quadriceps oxygen demand was beginning to outweigh the supply. Figure 3 shows the heart rate had a rate of increase of 54% throughout the entire test. The cardiovascular system was working to keep up with demand.
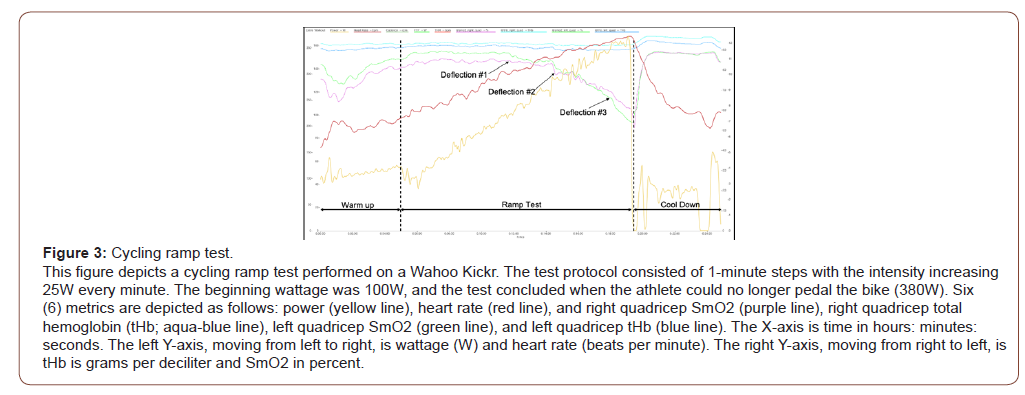
The ramp test has three significant deflection points, as shown in Figure 3, starting at minute 11:33. Each of these points signifies an increase in oxygen demand. The higher the slope of the SmO2 denotes an increase in demand by the working quadriceps muscles. The drops in SmO2 at deflection point 1 were 2% for the right quadriceps and 3% for the left quadriceps. The values are average for efforts near or at FTP; the typical values are 2-5% at this effort. At deflection point #2, the drops in SmO2 for the right and left quadriceps were 11.6% and 17.4%. These are the values that signify the effort has moved from aerobic to anaerobic. At deflection point #3, the drops in SmO2 for the right and left quadriceps were 6.6% and 8.2%. The ending SmO2 values for the right and left quadriceps were 61.1% and 55.7%.
The SmO2 results from this test give some excellent indicators and data that can be used to improve performance. These indicators are as follows:
1. The optimal SmO2 range for this triathlete is 55 – 85%.
2. The calculated FTP from this ramp test was 285W. This result falls within the deflection point #1 segment. The athlete can expect to see SmO2 rates of change near 2% at this wattage.
3. When the rates of change begin to near 11%, the demand is too high, and the triathlete will reach fatigue.
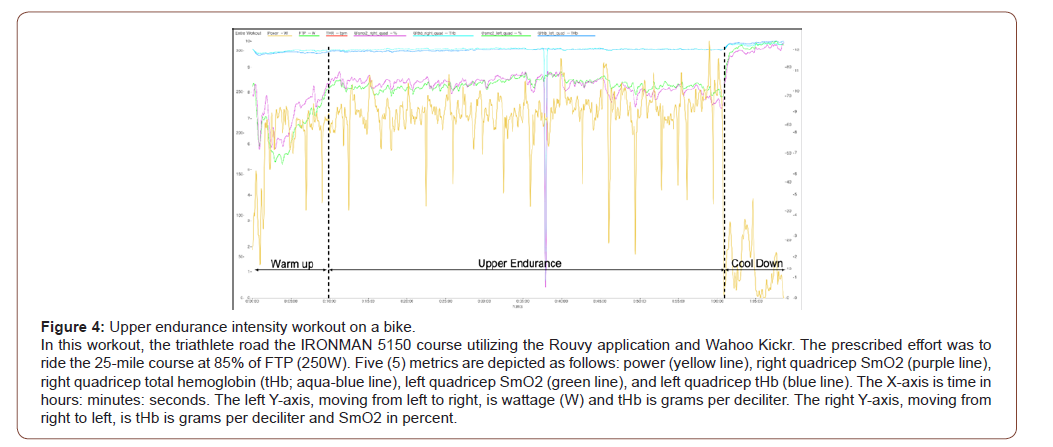
As shown in Figure 4, the triathlete completed a 25-mile ride that included a warm-up, main set, and a cool down. After the warm-up, the triathlete rode 22 miles of the course at Zone 3/ Tempo, according to the Coggan Power Zones [16].
The Warm-Up: The original workout was for the triathlete to warm-up for 15 minutes using a mixture of endurance and threshold efforts. The triathlete performed these types of efforts within the first 5 minutes of the warm-up. From minutes 2-4, the SmO2 drops lower than the initial readings. Similarly, to what was established in Case Study #1, this drop signifies an oxygen deficit. At minute 10, the SmO2 reached 75% for each quadricep. Since the triathlete knew this was within the optimal range, the warm-up was shortened.
The main set: Upper endurance: During the 22 miles of the main set, the triathlete targeted between 240-250W. The power output is reasonably consistent over the simulated terrain. More importantly, the changes in power output did not affect the SmO2. The SmO2 is consistent throughout the entire main set except for the last minute. The triathlete pushed harder during this time, as indicated by the increased power output, as shown in Figure 4.
The consistency of the SmO2 during this steady-state effort is very valuable. This aspect shows that an effort in a power range in the upper endurance range, but below sub threshold, does not outweigh the oxygen supply. This data shows the triathlete can hold this effort for sustained periods. Furthermore, the bike leg for an Olympic distance triathlon event is 25 miles. This data shows the triathlete can keep this race paced effort without consequence. Also, the next time the triathlete performs this workout, the prescribed power output should be 2-5% higher to see any changes to SmO2 occur.
Some of the insights from this case study are as follows:
1. The prescribed Tempo power zone did not cause fatigue to the triathlete.
2. This effort could be an effort the triathlete can sustain for race day and still have enough energy to complete the run leg.
3. The triathlete may only need 10 minutes of warm-up to be prepared for the main workout.

Case study 3 – Threshold intervals
The following case study focuses on efforts at or just below the threshold. In this particular workout, the triathlete performed 3x10 min efforts at Zone 4/Threshold, according to the Coggan Power Training Zones [16]. Before each interval, the triathlete completed a 30-second effort in Zone 5/VO2max, according to the Coggan Power Training Zones [16]. Two minutes of recovery was given in between each interval. This workout was the first time the triathlete performed this workout with the new FTP metric determined by the ramp test (Figure 5).
The threshold intervals: The goal of this threshold workout was to focus on race pace. For short course triathlons, the triathlete efforts are at threshold or just below. As shown in Figure 5, the triathlete was able to hold the threshold efforts until the last 2 minutes of interval #3. For interval #1, the SmO2 changes for the right and left quadriceps were 6.9% and 8.7%, respectively. The numbers are slightly higher than the normal range of 2-5%. However, this drop is negligible when compared to interval #2. The SmO2 changes for the right and left quadriceps in interval #2 were 0%. The starting SmO2 for both quadricepses at the beginning of both intervals were similar. This data shows the triathlete was performing well with the new threshold efforts. Furthermore, the tHb and heart rate were similar throughout both intervals. The SmO2, heart rate, and tHb data show the triathlete had the right oxygen balance to maintain the efforts.
In interval #3, the situation changed. At minute 5 of this interval, as shown in Figure 5, there was a 5% drop in SmO2. The SmO2 did not recover, and the triathlete reached muscle failure 1-minute later. In speaking with the triathlete after the workout, he knew he would not be able to maintain the effort too much longer after seeing the decrease in SmO2. The triathlete decided to spin for 90 seconds to recover. He saw his SmO2 recover to 72-75% during the 90 seconds; he proceeded with the rest of the interval.
With this workout, the triathlete and the coach were able to conclude the following items:
1. The new FTP metric from the ramp test was a valid result.
2. The SmO2 rates of decrease provided a reliable indicator if and when the triathlete would reach muscle failure.
3. Know his optimal SmO2 range allowed the triathlete to see if he should continue the interval or not after a short recovery period.
Case Study 4 – Anaerobic Capacity (AC) Intervals
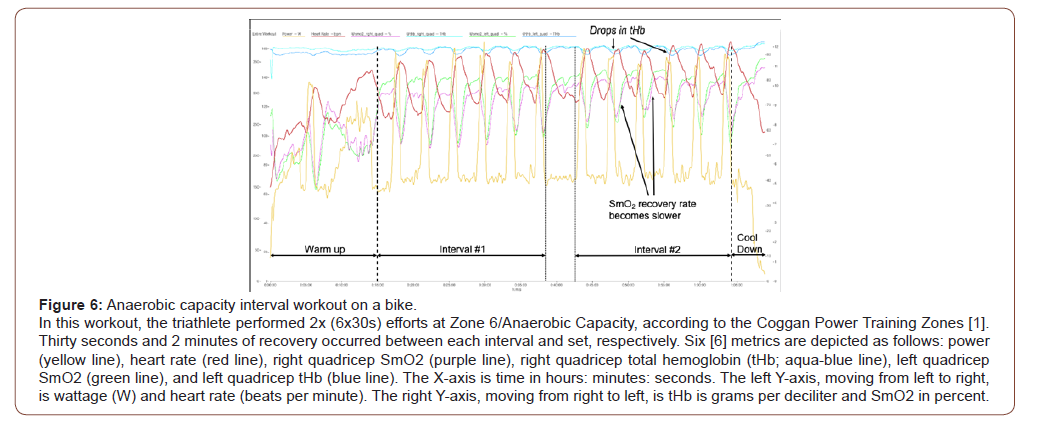
A central component to short course triathlon is the ability to surge. The bike leg of a triathlon is non-draft legal (except for professional triathlon). This aspect means the triathlete cannot follow another triathlete directly to gain a drafting advantage [18]. Avoiding drafting means the triathlete needs to surge several times in a race to outpace other triathlete. This workout was designed to work on this aspect of his training and to work repeatability of high-intensity efforts (Figure 6).
The main set – Anaerobic capacity intervals: Anaerobic capacity intervals are near-maximal efforts. The duration of these intervals range from 30 – 120 seconds and have an intensity of 121% - 150% of FTP (1).For this triathlete, these intervals were 122-125% of his FTP.
The aspect to notice in Figure 6 is the drops in tHb with each interval. The tHb for each quadricep drops with each AC effort; however, the left quadricep (blue line) is more affected than the right quadricep (light blue line). These drops in tHb are due to the near-maximal contractions of the quadriceps. These types of contraction occlude blood flow [11]. The pressure of the contraction will push some of the fluid into the interstitial space [12,14,19]. hese are the causalities in the drops in tHb during the AC intervals. These causalities may contribute to the changes in SmO2 but not to the extent to impair performance.
As shown in Figure 6, the SmO2 drops with each AC interval. This change in SmO2 shows that the working quadriceps’ oxygen demand is higher than the cardiovascular system can supply. This conclusion is further supported the continual increase in the heart rate with each successive interval. During the first set of intervals, the average recovery rate was 25% and 30% for the right and left quadriceps. In Figure 6, during interval #2 of the second set, the average recovery rate was 16% and 25.5% for the right and left quadriceps. The SmO2 recovery time took longer during each consecutive recovery period. This data shows the muscle was beginning to fatigue and not recovering as quickly as seen earlier in the workout. Even with these changes in SmO2, the performance was not affected. Ultimately, the workload was precise to meet the current condition of the triathlete. Based on the data gleaned from the second set of AC intervals, the triathlete would not be able to complete a third set.
This workout demonstrated the triathlete limitation in repeatability for this type of work. The data laid the benchmark on how to tailor future training. Research strongly suggests the SmO2 recovery rate can be trained to be improved [1,20,21]. Based on this premise, this AC interval workout was redesigned to try to improve the triathlete SmO2 recovery times.
Conclusion
NIRS technology allows coaches and athletes to see oxygen kinetics non-invasively and in real-time. Understanding how training changes the second half of the Fick’s Principle (Equation 1), the athlete or coach can better tailor training to enhance performance. The following are a summary of the key concepts laid out in this article.
Summary of key concepts
1. THb is an indicator of blood flow [21]. An increase or decrease in this metric during exercise denotes a change in blood flow. If this metric stays constant, then blood flow is constant. This aspect is important due to the effects of muscular contraction on blood flow. At roughly 30-50% of maximal muscular contraction, blood flow begins to become occluded. At 70% of maximal muscular contraction, blood flow is completely occluded [11]. This blood flow reduction will cause a significant drop in SmO2. This concept helps with analysis at intensities higher than FTP or during hill climbs.
2. SmO2 can be a good indicator for knowing how long a warmup should last. The typical SmO2 range is from 75-95% after vasodilatation has occurred in the working muscle. Seeing an athlete achieve this number after a warm-up is a good indicator, the target muscle is primed to perform work. Also, through information collected during FTP testing, the coach or athlete will be able to see the athlete’s maximal tHb. With THb being an indicator of blood flow [20], the maximal tHb equates to maximal blood flow. This is another indicator that vasodilatation has occurred in the target muscle, and it is primed for the workout.
3. At steady-state efforts during normal endurance exercise, the SmO2 rate should stay consistent. If heart rate increases, but no change in SmO2 and power/pace occurs, this is a normal heart rate response to the training stress. However, if a significant drop (5% or more) in SmO2 begins to occur, fatigue is beginning to become an issue and perform may begin to decrease.
4. Recovery times are an excellent indicator of phosphocreatine synthesis rate [11]. An increase in the steepness of the SmO2 slope indicates an increased rate of phosphocreatine resynthesis. If the slope becomes less steep, then the resynthesis rate has decreased.
5. Even though not discussed, altitude significantly affects SmO2 readings. At altitude, the partial pressure of oxygen is lower. The lower partial pressure lowers the oxygen concentration in the bloodstream causing a left shift in the oxygen dissociation curve [1,4]. SmO2 will be lower at altitude, initially. Over time, as the body adapts, the levels will increase. Understanding how Dalton’s Law of Partial Pressures affects the Fick’s Principle at altitude will assist in the utilization and analysis of the NIRS data.
6. Limb differences will occur similarly as shown in the case studies. These limb differences may be a natural occurrence within the athlete or may be due to fatigue. Having a good baseline taken during field testing will help the athlete or coach to understand the background behind this difference.
Limitations
Skin thickness can be a limitation to any NIRS sensor used to analyze hemoglobin. The NIR wavelength can only penetrate so deep. If the skin thickness is greater than the depth the NIR light can penetrate, the sensor is not reading myoglobin. If the sensor is mainly reading skin or adipose tissue blood characteristics, the oxygenated hemoglobin concentrations may be creating a false positive [10,12]. It is important to place the sensor on a target muscle with little skin thickness. For cyclists and runners, this can be over the vastus laterals or the rectus femoris. Other sites that can be utilized are the biceps brachia or the forearm flexors [12].
Acknowledgement
All co-authors contributed equally to the article.
Conflict of Interest
The authors declare no conflicts of interest.
References
-
Christopher M Myers. Muscle Oxygenation Applications to Endurance Training. Anat & Physiol Open Access J. 1(1): 2019. APOAJ. MS.ID.000501.
-
Muscle oxygenation, Near infrared spectroscopy, Sensor, Hemoglobin, Erythrocytes, Metabolic acidosis
-

This work is licensed under a Creative Commons Attribution-NonCommercial 4.0 International License.
- Abstract
- Introduction
- The Physiology – A Brief Overview
- Mb-Oxygen/Hb-Oxygen Binding Curves
- Effects of Exercise on the Hb-Oxygen Binding Curve
- The Fick’s Principle
- What is NIRS Technology?
- What is Muscle Oxygenation Saturation (SmO2)
- Why is it Important to Monitor Smo2 during Training?
- Equipment Used
- Case Study
- Conclusion
- Limitations
- Acknowledgement
- Conflict of Interest
- References


