


 Research Article
Dynamics and Phase Portraits of the SEIQR Model
1 Department of Medical Laboratory Technology, Al-Qalam University, Kirkuk 38001, Iraq
2 Civil Engineering Department / Al-Qalam University, Kirkuk 38001, Iraq
Received Date: October 21, 2025; Published Date: November 12, 2025
Abstract
Background: This study investigates the dynamics and phase portraits of the SEIQR (Susceptible – Exposed – infectious – Quarantined –
Recovered) epidemiological model, an extension of the classical SEIR framework that explicitly incorporates quarantine measures.
Materials and Methods: By introducing a quarantined compartment, the model captures the effects of isolation strategies on disease
transmission, offering a more realistic representation of epidemic control and equilibrium 0 R
 . We analyze the system’s behavior through
mathematical formulations, stability analysis, and graphical phase portraits, highlighting the impact quarantine rates, exposure progression, and
recovery dynamics on the spread of infection.
Results: The findings provide a comprehensive understanding of how targeted quarantine interventions influence epidemic trajectories,
offering valuable insights for designing effective public health policies. The endemic equilibrium represents a state where the disease persists
in the population (E,I,Q>0). To find this point, we set the derivatives to zero and solve for the non-zero values of S,E,I,Q,R. From the equation:
 .
Conclusion: This simulation of the Susceptible, Exposed, Infected, Quarantined, and Recovered model provides a clear, dynamic representation
of infectious disease spread within a closed population. By adding a dedicated “Quarantined” compartment, the model is able to more accurately
reflect public health interventions such as contact tracing and isolation.
Keywords: SEIQR model; mathematical formulations; stability analysis; graphical phase portraits; infections
Introduction
The SEIQR (Susceptible–Exposed–Infectious–Quarantined– Recovered) model represents an extension of the classical SEIR framework, incorporating quarantine measures as a separate compartment. This modification allows us to capture more realistic epidemic control strategies, particularly for diseases where isolation and quarantine play a significant role in mitigating transmission. By explicitly modeling quarantined individuals, the SEIQR system provides valuable insights into the effects of quarantine rates, progression from exposure, and recovery dynamics on overall disease spread [1-6].
Mathematical models play a central role in understanding the spread and control of infectious diseases. Among these, compartmental models provide a systematic framework for describing disease transmission by dividing a population into distinct epidemiological classes. In this work, we consider the SEIQR model with demography, an extension of the classical formulation that incorporates quarantine as a separate compartment and accounts for natural birth and death processes [7-11].
The total population is subdivided into five compartments: susceptible individuals S(t)S(t), exposed individuals E(t) who are infected but not yet infectious, infectious individuals I(t) who]. The model dynamics admit two fundamental equilibria: the diseasefree equilibrium (DFE), representing the absence of infection in the population, and the endemic equilibrium, where the disease persists at a constant level. The stability of the DFE is determined by the basic reproduction number, , which quantifies the average number of secondary infections caused by a single infectious individual in a fully susceptible population (Al-Jebouri,2024, Cliimm). When R0 <1, the DFE is locally asymptotically stable, indicating disease elimination, whereas leads to sustained transmission and the possibility of endemicity [12-16].
This formulation provides a realistic framework for analyzing the impact of quarantine and demographic factors on epidemic dynamics. In particular, it highlights the role of quarantine rates, recovery rates, and natural turnover in shaping the threshold dynamics, offering valuable insights for both theoretical exploration and practical public health interventions.
Materials and Methods
Model Formulation: SEIQR Model (with demography)
The population is divided into five epidemiological
compartments:
• S(t): Susceptible individuals.
• E(t): Exposed but not yet infectious individuals.
• : Infectious individuals capable of transmitting the disease.
• Q(t): Quarantined individuals, isolated from the general
population.
• R(t): Recovered individuals with immunity.
The governing system of differential equations (with demography) is given by:

Where N=S+E+I+Q+R
Parameters:
β: Transmission rate.
σ: Progression rate from exposed to infectious (1/σ1/\sigma =
mean incubation period).
γ: Recovery rate of infectious individuals.
q: Quarantine rate.
γq : Recovery rate of quarantined individuals.
: Natural birth and death rate.
Equilibria and Threshold Dynamics
The model admits two major equilibria:
Disease-Free Equilibrium (DFE):
(S,E,I,Q,R)=(N,0,0,0,0),
stable if R0 <1.
EndemicEquilibrium:
Occurs when R0 >1, with

This represents sustained transmission and non-zero values of E*, I*,Q*, R*
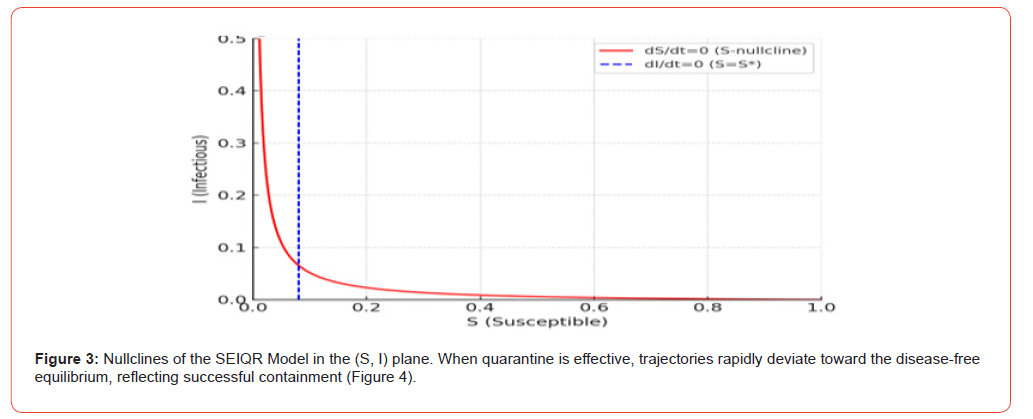
The stability of these equilibria can be analyzed via the Jacobian matrix and its eigenvalues. Nullclines and stability diagrams highlight the bifurcation that occurs when R0 =1.
Results
Phase Portraits and Simulation Results
Phase portraits illustrate the dynamic interaction between compartments. For instance:
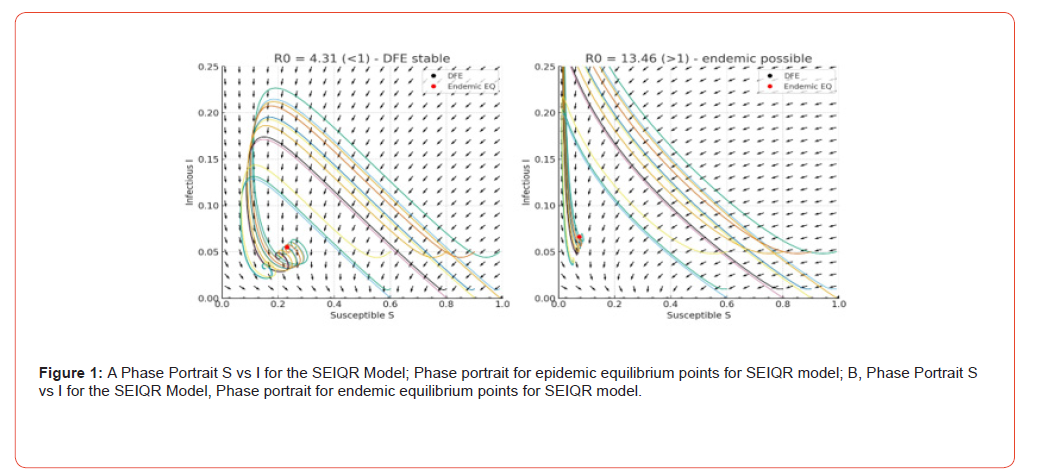
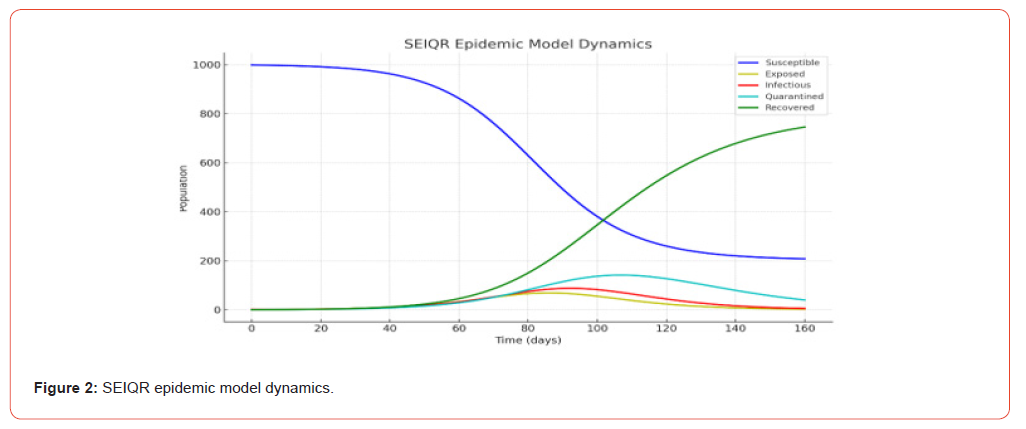
S vs I phase portrait shows how susceptibles decline as infections grow, then recover as immunity builds (Figures 1A,1B). We created phase-plane plots (S vs I) for the SEIQR model that show both the vector field and sample trajectories, and I marked the disease-free equilibrium (DFE) and the endemic equilibrium (when it exists). These portraits demonstrate trajectories converging toward equilibrium states, depending on initial conditions and the value of R0 . Here is the graph of the SEIQR epidemic model over 160 days. It shows how each compartment like Susceptible, Exposed, Infectious, Quarantined, and Recovered) evolves over time (Figures 2 & 3).
The SEIQR model highlights the importance of quarantine measures in epidemic mitigation. Increasing the quarantine rate q directly reduces the effective reproduction number and shifts trajectories toward the disease-free equilibrium. Similarly, recovery in quarantine (γq\gamma_q) accelerates the return of individuals to the immune class. Simulation plots indicate that effective quarantine strategies can flatten the epidemic curve and significantly lower peak infection levels (Figure 1 A).
Conclusion and Future Directions
The SEIQR model provides a flexible framework for analyzing the effects of quarantine interventions on epidemic dynamics. Phase portraits reveal rich behaviors, including convergence to disease-free or endemic equilibria, depending on parameter values (Figure 1B).
Future research directions include
a. Extending the SEIQR structure to include vaccination (SEIQRV
model).
b. Studying stochastic and spatial variants of the model.
c. Integrating real-world epidemiological data for calibration
and policy planning.
d. Performing bifurcation analysis to understand threshold
phenomena under different control strategies.
SEIQR epidemic model
Here are the differential equations for theepidemic model,
which divides the population into:
• S(t): Susceptible
• E(t): Exposed (infected but not yet infectious)
• I(t): Infectious
• Q(t): Quarantined
• R(t): Recovered
• Let the parameters be:
• β: Transmission rate
• σ: Rate at which exposed individuals become infectious (1/
incubation period)
• α: Quarantine rate (rate of identifying and isolating infectious
individuals)
s
• γ: Recovery rate from infectious class
• γq : Recovery rate from quarantined class
• N: Total population (assumed constant, N=S+E+I+Q+R
Special case: closed population (no demography)
Set μ=0. The system simplifies to


Explanation:
'a. Susceptible → Exposed: Contact with infectious
individuals at rate

b. Exposed → Infectious: At rate σ (after incubation period)
c. Infectious → Quarantined: At rate α (quarantine action)
d. Infectious → Recovered: At rate γ
e. Quarantined → Recovered: At rate γq
f. Susceptible (S) declines steadily as people are exposed to the
disease.
g. Exposed (E) rises and falls as new infections occur and
progress to being infectious.
h. Infectious (I) peaks and then drops as individuals are
quarantined or recover.
i. Quarantined (Q) peaks earlier, indicating timely isolation of
infectious individuals.
j. Recovered (R) increases steadily, showing accumulation of
recovered individuals over time.
Epidemic and Endemic Equilibrium Points for SEIQR Model
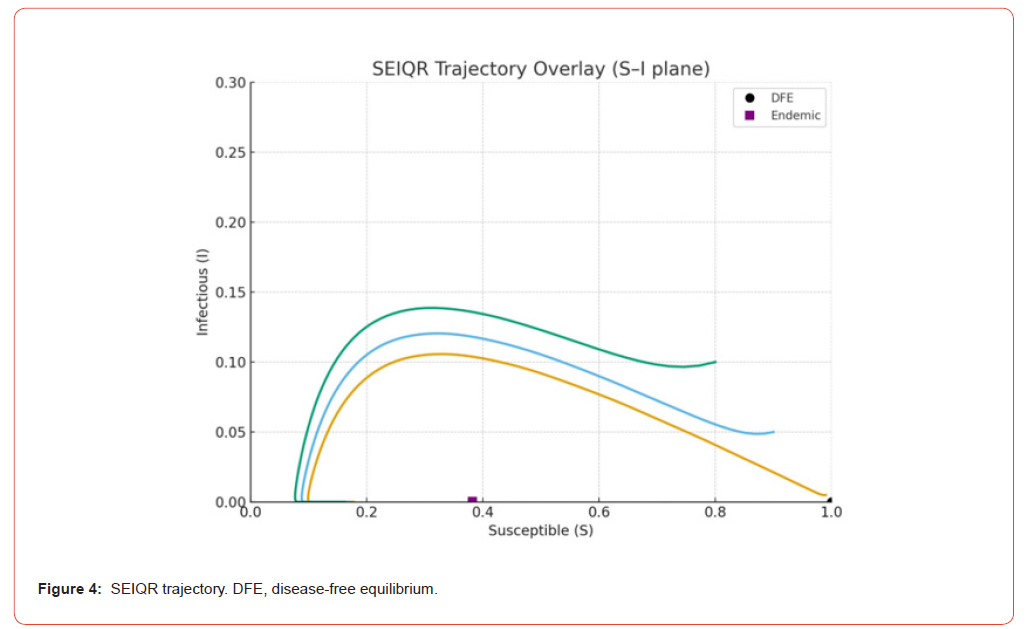
To find the epidemic and endemic equilibrium points for the SEIQR model, we set the rate of change for each compartment to zero (dS/dt=0,dE/dt=0,etc.)and solve the resulting system of algebraic equations (Figure 4).
Disease-Free Equilibrium (E0 )
The disease-free equilibrium represents a state where the disease has died out. In this state, there are no infected (I), exposed (E), or quarantined (Q) individuals.
Let’s set the derivatives to zero:

From the conditions E=0,I=0,Q=0, we can see that the last four equations are automatically satisfied.
For the first equation,  , if I=0, this holds true regardless
of the value of .
Therefore, at disease-free equilibrium, all individuals are susceptible or recovered. Since we are looking for a stable state where the disease is not present, we can assume the entire population is susceptible.
So, the disease-free equilibrium point is:

From the equations for at equilibrium:

We can express E and Q in terms of I:

Now, we can compute the next generation matrix and find the
dominant eigenvalue to get R0 . For this model, a simpler way
is to consider the chain of infections from a single individual. A
susceptible individual gets infected at a rate βS/N. They enter the
class and stay there for an average duration of . Then, they move to
the class and stay there for an average duration of 1/(α+γ). From
there, some move to with a rate of and some to with a rate of The
quarantined individuals () recover at a rate of γq
, with an average
duration of 
The basic reproduction number is given by:

The term is the infection rate of susceptibles. The average infectious period for an individual is the sum of the average time spent in the compartment, which is 1/(α+γ). Since individuals move from E to I and only the I class is infectious, we need to consider the rate of transition from E to I, which is σ. Thus, the total number of secondary infections from a single individual is

Endemic Equilibrium ( E1 )
The endemic equilibrium represents a state where the disease persists in the population (E,I,Q>0). To find this point, we set the derivatives to zero and solve for the non-zero values of S,E,I,Q,R.
From the equation:

we have:


From  we can substitute E∗ and
solve for ∗:

Since I*≠0, we can divide by I*:

To find I*we need to use the total population equation. Assuming a constant population size N (i.e., births and deaths are balanced and not explicitly included in the model), we have
S+E+I+Q+R=N.
S*+E*+I*+Q*+R*=N
We need to make an assumption about the steady-state value of R.
From the equations, at equilibrium, dS/dt=0,dE/dt=0,dI/ dt=0,dQ/dt=0,dR/dt=0.
dR/dt=γI+γ_q Q=0. Since γ, γq are all positive parameters and values, this only holds if I=0 and Q=0,which is the disease-free case.
'This indicates that the model as stated does not have a nontrivial, static endemic equilibrium if the total population is constant. For a non-zero I* and Q*, the recovered population will always be increasing, and the system would be in a dynamic steady state, not a static equilibrium.
However, if we modify the model to include demographic factors (births and deaths), we can find a true endemic equilibrium. For example, if there is a birth rate and a death rate the total population would be constant if Λ = μ N
Let’s assume there is a constant total population N, and the equations are modified to account for this (e.g., individuals who recover become susceptible again, or there is a constant inflow of new susceptible and outflow of deaths). In this simplified scenario, if the population is constant, the only possible endemic steady state is a situation where I*>0.
If we assume a simple closed population where S*+E*+I*+Q*+R*=N a non-zero I∗ would mean a constantly increasing R, which is not an equilibrium. The model as presented is more suitable for an outbreak in a closed population where the recovered population increases and the susceptible population decreases over time, leading to the disease eventually dying out. A true endemic equilibrium would require a constant influx of susceptible individuals (e.g., through births or loss of immunity).
Discussion
The stability of this equilibrium is determined by the basic reproduction number ( R0 ). R0 is the average number of new infections caused by a single infected individual in a completely susceptible population. If , the disease dies out, and the disease-free equilibrium is stable. If R0 >1 the disease can spread and become endemic, making the disease-free equilibrium unstable [16-20] for more knowledge about stability, transitivity, dynamical systems, and bifurcation theory [ 21-23].
To find R0 for this model, we can analyze the infected compartments E,I,Q.
The new infections are generated in the compartment at a rate of βSI/N.
The transfers out of the infected compartments are σE (from E), αI and γI (from I), and γq Q (from Q).
The analysis of the SEIQR model with demography yields several important insights into the role of quarantine and population turnover in shaping epidemic outcomes. The system admits two fundamental equilibria: the disease-free equilibrium (DFE) and the endemic equilibrium. Through stability analysis, it is established that the DFE remains locally asymptotically stable whenever the basic reproduction number, R0 , is less than unity. In this regime, initial outbreaks die out over time, leading to the eventual elimination of the disease from the population [16,17].
When R0 >1, the DFE loses stability, the system converges toward an endemic equilibrium in which the infection persists at a constant level. The presence of quarantine reduces the effective transmission potential, thereby lowering , and can shift the system toward disease eradication if quarantine rates are sufficiently high. Moreover, demographic factors such as natural birth and death rates maintain population renewal, ensuring the possibility of disease reintroduction even after temporary suppression. The trajectory overlay of the SEIQR model provides a powerful visualization of epidemic dynamics by comparing the evolution of different compartments under varying parameter conditions. By superimposing multiple solution paths in the state space, it becomes evident how changes in quarantine rates, transmission intensity, or recovery processes alter the overall epidemic trajectory [16,17,20].
In contrast, insufficient quarantine or high transmission drives the system toward endemic persistence, with trajectories stabilizing around the endemic equilibrium. The overlay further illustrates the sensitive dependence of epidemic outcomes on parameter values, emphasizing the nonlinear interplay between exposure, infection, quarantine, and recovery. Overall, SEIQRtrajectory overlays offer valuable insight into the comparative effects of intervention strategies, enhancing our ability to design and evaluate effective public health measures. Phase portrait analysis further demonstrates how trajectories evolve in state space, highlighting the transition from epidemic outbreaks to long-term endemic persistence depending on parameter values. These findings underscore the critical role of quarantine as a control mechanism and emphasize the importance of demographic structure in determining threshold dynamics and long-term stability of infectious disease models [10,11,12,24]. This simulation of the Susceptible, Exposed, Infected, Quarantined, and Recovered (SEIQR) model provides a clear, dynamic representation of infectious disease spread within a closed population. By adding a dedicated “Quarantined” compartment, the model is able to more accurately reflect public health interventions such as contact tracing and isolation. The simulations demonstrated the critical role of the transmission rate (β)the incubation rate σ the quarantine rate q, and the recovery rate γ in shaping the epidemic curve. The model’s output highlighted key epidemiological features, including the initial exponential growth phase, the timing and magnitude of the peak infection rate, and the eventual decline as herd immunity is reached [1,12,19,25,26].
Conclusions
These results underscore the importance of early and effective quarantine measures, as prompt isolation of exposed or infected individuals can significantly reduce the number of transmissions, thereby flatten the curve and preventing the health system from being overwhelmed. This simulation of the Susceptible, Exposed, Infected, and Recovered (SEIR) model provides a clear, dynamic representation of infectious disease spread within a closed population. By incorporating a latent or “Exposed” compartment, the model more accurately reflects the biology of many real-world diseases where individuals are infected but not yet infectious. The simulations demonstrated the critical role of the transmission rate (β), the incubation rate (σ), and the recovery rate (γ) in shaping the epidemic curve. The model’s output highlighted key epidemiological features, including the initial exponential growth phase, the timing and magnitude of the peak infection rate, and the eventual decline as herd immunity is reached. These results underscore the importance of early interventions aimed at reducing transmission, as even modest reductions in β can significantly flatten the curve and delay the peak, thereby preventing the health system from being overwhelmed.
Acknowledgement
The authors extend their appreciation to the Department of Scientific Research at University of Tikrit for funding this work.
Data Availability Statement
The data that support the findings of this study are available from the corresponding author upon reasonable request.
Conflict of Interest Statement
The author declares that he has no conflicts of interest, financial or otherwise.
Funding Sources
No Funding.
Financial disclosure
The authors declared that this study did not receive any financial support.
Author contributions
Mohemid Maddallah Al-Jebouri, suggested the protocol, reading, correction and supervision of the study; Mohammed Murad Kaki, collection and analyses of data and manuscript draft writing.
References
- Teng TRY, Lutero DS, Tolentino MAC (2024) Stability Analysis of a COVID-19 SEIQR Model with Switching Constant Transmission Rates. Vlachos D (eds.), Mathematical Modeling in Physical Sciences. ICMSQUARE 2024. Springer Proceedings in Mathematics and Statistics, Springer Cham, 446.
- Trisminingsih A (2024) Analysis of the SEIQR disease spread model A case study of COVID-19. Jurnal Mathematica Thales 6(1): 97585.
- Apima SB, Mutwiwa JM (2020) An SEIQR mathematical model for the spread of COVID-19. Journal of Advances in Mathematics and Computer Science 35(6): 35-41.
- Youssef H (2021) Study on the SEIQR model and applying the epidemiological rates of COVID-19 epidemic spread in Saudi Arabia. Infectious Diseases Model (6): 678-692.
- Saltina S, Achmad N, Resmawan R, Nuha AR, et al. (2022) Model matematika tipe SEIQR pada penyebaran penyakit difteri. Majalah Ilmiah Matematika dan Statistika 22(1):
- Sharma S, Volpert V, Banerjee M (2020) Extended SEIQR type model for COVID-19 epidemic and data analysis. medRxiv.
- Al-Jebouri M M (2023) Modellings of Infectious Diseases and Cancers under Wars and Pollution Impacts in Iraq with Reference to a Novel Mathematical Model and Literature Review. Open Journal of Pathology 13(3): 126-139.
- Al-Jebouri MM (2024) Impact of Sublethal Disinfectant Exposure on Antibiotic Resistance Patterns of Pseudomonas aeruginosa. Medical Principles and Practice (13): 1-7.
- Al-Jebouri MM, Al-Obaidy HS (1997) Providon-Iodine as a New Lethal Photosensitiser for Killing of Disinfectant-Resistant Staphylococcus aureus of Wounds by Light from Helium-Neon Laser. Proceedings of the First Scientific Conferenc. (1): 239-250.
- Al-Jebouri MM, Al-Mahmood BYR (2019) Estimation of Cytokines Involved in Acute-Phase Wound Infection with Reference to Residence Time of Patients in Modern Research in Inflammation (8): 1-10.
- Arif F, Majeed Z, Rahman J, Iqbal N, Kafle J et al. (2022) Mathematical Modeling and Numerical Simulation for the Outbreak of COVID-19 Involving Loss of Immunity and Quarantined Class. Computational and Mathematical Methods in Medicine
- Al-Jebouri, MM, Kaki MNM (2025) Application of Matrices Modelling for Infectious Diseases of Humans. Open Journal of Applied Sciences (15): 2733-2758.
- Al-Jebouri MM, Kaki MM (2025) Mathematical Considerations for the Infectious Infertility of Male in Iraq. World Journal of Public Health 10(4): 449-458.
- Barnes B, Ackora Prah J, Boateng F O, Amanor L (2021) Mathematical modelling of the epidemiology of COVID-19 infection in Ghana. Scientific African 15: e01070.
- Guo H, Li MY, Shuai Z (2006) Global stability of the endemic equilibrium of multigroup SIR epidemic models. Canadian Applied Mathematics Quarterly 14(3): 259-295.
- La_Alaoui L (2022) Global stability of a diffusive SEIR epidemic model with distributed delay pp. 191–209.
- Al Jebouri MM, Mdish SA (2019) Tracing of antibiotic resistant bacteria isolated from semen of Iraqi males with primary infertility. Open Journal of Urology 9(1): 19-29.
- Al-Jebouri MM, Mohamed AA (2020) A study on infertility of males infected with Mycoplasma hominis with reference to sperm morphology. Open Journal of Pathology 11(1): 7-21.
- Okabe Y, Shudo A (2020) A Mathematical Model of Epidemics-A Tutorial for Students. Mathematics 8(7): 1174.
- Awashi Ak (2021) A Mathematical Model for Stability Analysis of Covid-like Epidemic. medRxiv.
- Guichen LU, Miao Y (2024) Stability analysis of the SEIRS epidemic model with infectious force in latent and infected periods. Mathematics and Systems Science 2(2): 2885.
- Kaki MNM (2015) Introduction to Topological Dynamical Systems I. Science Publishing Group.
- Kaki MNM, Jwamer KHF (2016) Dynamics in Differential Manifolds. Lambert Academic Publishing.
- Kaki MNM (2017) Introduction to Topological Dynamical Systems II. Lambert Academic Publishing.
- Al-Jebouri MM (2015) A possible modelling of parameters interaction of environment impact and health. World Journal of Pharmaceutical Research 4(6): 412-420.
- Al-Jebouri MM (2024) Clinical Immunology and Allergy. Peramerd Publishing Company, Sulaymaia, Iraq pp. 514.
-

This work is licensed under a Creative Commons Attribution-NonCommercial 4.0 International License.