 Research Article
Differences in Fish Assemblage Structure Between Taking and No-Taking Protected Areas: The Case of Cayar And Joal-Fadiouth Marine Protected Areas in Senegal
Ousmane Diankha*, Mamadou Ndiaye, Fatima Ba, Aïssatou Niasse, Mamadou Diop, Binta Ba and Momar Sow
1"Université Cheikh Anta Diop (UCAD), Ecole supérieure polytechnique, Laboratoire de Physique de l’Atmosphère et de l’Océan Siméon Fongang, Senegal
2Direction des Aires Marines Communautaire Protégées, Ministère de l’Environnement et du Développement Durable, Senegal
Ousmane Diankha, Université Cheikh Anta Diop (UCAD), Ecole supérieure polytechnique, Laboratoire de Physique de l’Atmosphère et de l’Océan Siméon Fongang, Senegal.
Received Date: Jaunary 21, 2019; Published Date: February 07, 2019
Abstract
This work is a preliminary comparative study of fish assemblage between a marine protected area where fishing is banned in Joal-Fadiouth (JFMPA) and a fishing authorized marine protected in Cayar (CMPA). It consisted of seasonal sampling between 2015 and 2016. Trophic classification based on food regime was performed in order to describe the fish fauna of these MPA. Multivariate analysis like factorial correspondence analysis and hierarchical classification analysis were carried out to study the spatial differences of fish assemblages. Both MPA had similar number of species, 103 fish species belonging to 45 families. However, a fundamental difference in terms of fish composition, abundance and biomass were noted. Only 38 fish species were shared by these MPA. In other words, among the 103 fish species found in CMPA 65 were not encountered in JFMPA. The total number of individuals in JFMPA was six time higher, and the biomass in JFMPA was triple of that in CMPA. The fish assemblage of CMPA was dominated in terms of abundance by two second-level predators Pagellus bellottii and Galeoides decadactylus (12.4%), while in JFMPA the pelagic herbivores Ethmalosa fimbriata (34%) dominated the fish assemblage. Our results suggest that management strategy in JFMPA seem to be more efficient than that of CMPA. Therefore, fishing activities in CMPA, even controlled seem to have negative effect on fish abundance.
Keywords: Bio-ecological indicators; Grande côte; Multivariate analysis; Petite côte
Introduction
Aware that marine biodiversity is threatened by overfishing and climate change, the implementation of marine protected areas (MPA) has been proposed as alternative solution [1-6] The government of Senegal committed to implement a network of marine protected areas, with a goal of encompassing 10% of its seas and coastal areas within an effectively managed, ecologically representative and well-connected system of MPA by 2020. Therefore, five MPA (Saint-Louis, Cayar, Joal-Fadiouth, Bamboung and Abene MPA) were implemented in 2004 and two in 2014 (Sangomar and Gandoule MPA). In addition, two new MPA were created, Niamone-Kalounaye and Casa-Balantakounda in 2015 and 2016, respectively.
The implementation of MPA network requires a regular monitoring of the fish assemblage over time and space, is essential to assess their performance as tools for conservation and fishery management [7,8] Excepted Bamboung MPA which benefited of a regular monitoring of its fish assemblage from the closing off of the area until 2012 [9] the other MPA established in 2004 were suffering from a lack of information about their fish assemblage composition, structure and dynamic. Therefore, a seasonal monitoring protocol was set by the directorate responsible for the management of this MPA network in collaboration with technical partners such as CRODT (Centre de Recherche Océanographique de Dakar-Thiaroye) and IUPA (Aquaculture and Fisheries Institute of the University of Dakar). This protocol seeks to describe and follow the dynamic of the fish assemblage in the Senegal MPA. The finality of this protocol is to dispose sufficient and reliable information to be able to orientate decision making for effective and sustainable management of marine and coastal resources.
The present study aims to compare fish assemblage during the 2015-2016 period between Cayar MPA where fishing activities are authorized but regulated, and Joal-Fadiouth MPA where the extraction of any type of fish species is prohibited. In comparative studies, the management strategy effect on fish assemblages through the creation of an MPA is measured using bio-ecological indicators, which are compared between fished and unfished areas. These bio-ecological indicators are species richness, abundance and biomass, mean size and mean trophic level were used. In this study, multivariate analysis techniques such as factorial correspondence analysis and hierarchical classification methods that allow to resume the spatial organization of fish assemblage were used.
Material and Methods
Study area
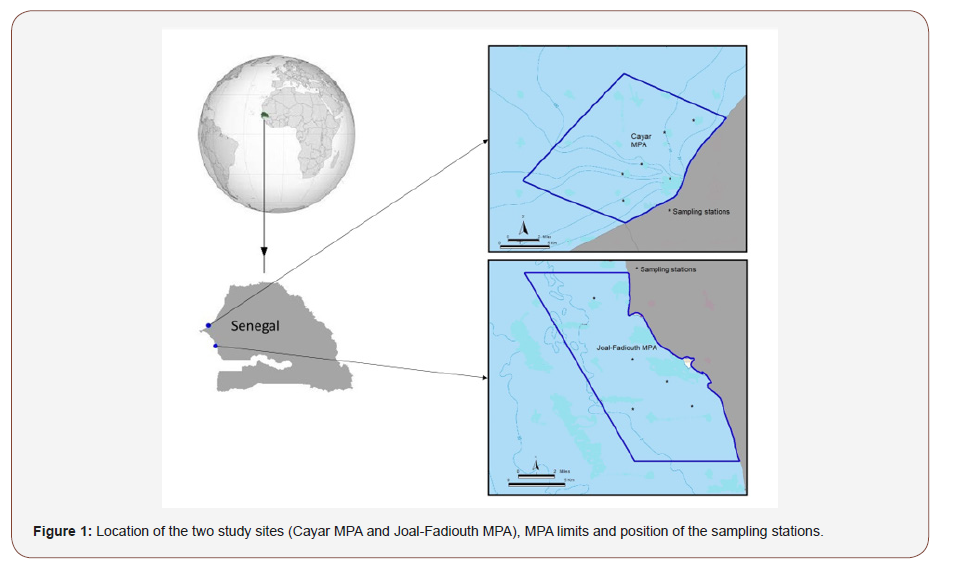
The Cayar Marine Protected Area (CMPA) is located 58km North of Dakar in the Grande Côte, between 14°55’6 and 15°01’6 N and 17°10’8 and 17°16’5 W (Figure 1a). It covers an area of 17km2 and belongs to the maritime domain. It consists of a fishing- MPA where fishing activities are authorized and regulated. Fishing activities with long line and gillnets are prohibited in the MPA. The other specificity of the CMPA is the presence of a deep canyon (the Canyon of Cayar) playing an important ecological role, the diversity of habitats and the seasonal upwelling which enriches the subsurface waters [10-12].
The Joal-Fadiouth Marine Protected Area (JFMPA) is located 144 km South of Dakar in the Petite Côte, 14°06’ and 13°13’ N and 16°47’ et 16°53’ W (Figure 1b). The JFMPA boasts a rich succession of marine, coastal, estuarine, lagoon and savanna ecosystems (the Botanic reserve of Ngazobil). This gives it various and varied habitats including seagrasses, sand beaches, mangroves, bolongs, and sandy and rocky islets [13]. It covers fish spawning and nursery areas, the habitat of manatees and areas important for sea turtle nesting. In addition to this diversity of natural habitats, the favorable hydrodynamic conditions and the presence of upwelling is a favorable environment for resources.
Sampling Protocol
Samples were collected every season between April 2015 and December 2016 at six sampling stations in CMPA and at five in JFMPA (Figure 1ab). The seasons correspond to the four main hydro-climatic periods in Senegal: Cold Season (CS) between January to May, transition Cold to Warm season (CW) in June, Warm Season (WS) between July to October and transition Warm to Cold season (CW) between November to December. Sampling was done during daylight hours. In CMPA, a purse seine (length 350m, height 40m, 14mm mesh size) and a bottom long line (length 100 m, height 38 m, with several types of fishhooks). Purse seine was applied at stations where seabed is muddy, sandy-muddy, and sandy, while bottom long line was used at rocky stations. These two devices were used to ensure exhaustive fish sampling because of the diversity of habitat types (rocky and sandy areas). In JFMPA, the depth is less than 10m, therefore only a purse seine of 250m length, 20m height and 14 mm mesh size were used. The fishing haul was considered as the fishing unit in this study, with 88 hauls from 2015 to 2016.
After each fishing haul, fish were identified to the species level, counted, sized and weighed by species. In the case of large number of individuals, a sub-sample of 30 individuals per species was analyzed.
Data Analysis
The relative abundance indices (AI) and the biomass indices (BI) were calculated as followed:

The logarithm function was applied to stabilize the variance. Species richness (the total number of species caught in each station or during each season) was calculated. Species were classified according to their feeding regimes. Concerning their feeding behavior, eight categories were identified: Scavenger or grazer herbivores (he-de), Herbivores mainly feeding on phytoplankton or micro-phytoplankton (he-ph), Omnivorous (Om), First level predators mainly feeding on zooplankton (p1-zo), First level predators mainly benthophageous (p1-bt), First level generalist predators mainly feeding on macro-crustaceans or insects (p1-mc), Second level generalist predators mainly feeding on fish, shrimps and crabs (p2-ge) and Second level piscivorous predators mainly feeding on fish (p2-pi) [14].
Statistical Analysis
Multivariate analysis techniques such as factorial and automatic classification analysis methods that allow to resume the spatial and temporal organization of data from a complex picture whose structure is difficult to pin down clearly [15] were applied here. Factorial correspondence analysis (FCA) was carried out using fish abundance indices to investigate the pattern of species assemblage among seasons and space. The Hierarchical Classification Analysis (HCA) was also used to group species according to their spatial and seasonal affinity or similarity [16,17]. The dendrograms were performed using the Euclidean distance and the Ward minimum variance clustering method [18] These statistical analyses were carried out using R software (R Core Team 2014), the ade4, Factoclass libraries [19].
Results
Fish assemblage composition, structure, abundance and biomass.
Table 1:List of the 103 fish species with their abundance and biomass (express in %) sorted trophic and ecological categories in CMPA.
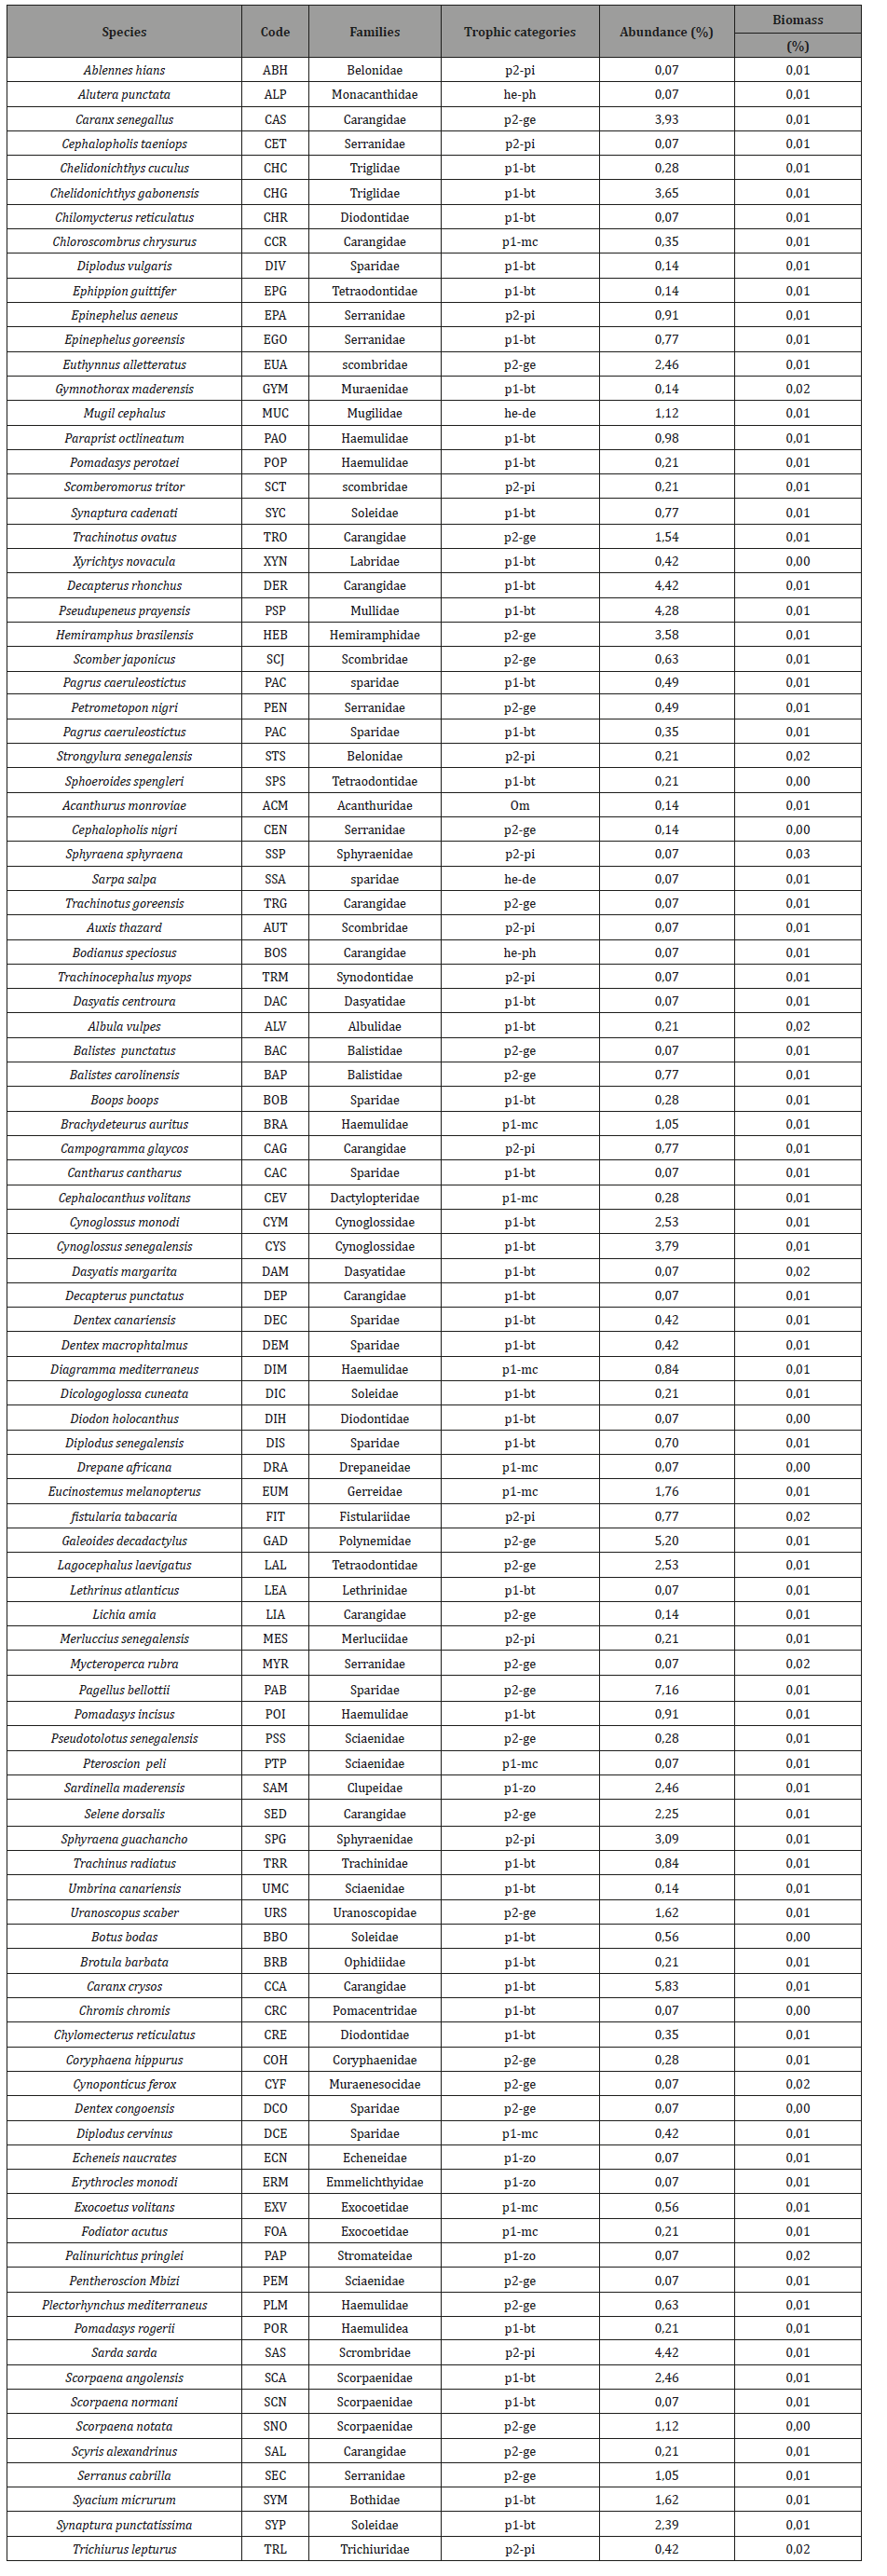
Table 2:List of the 105 fish species with their abundance and biomass (express in %) sorted trophic categories in JFMPA.
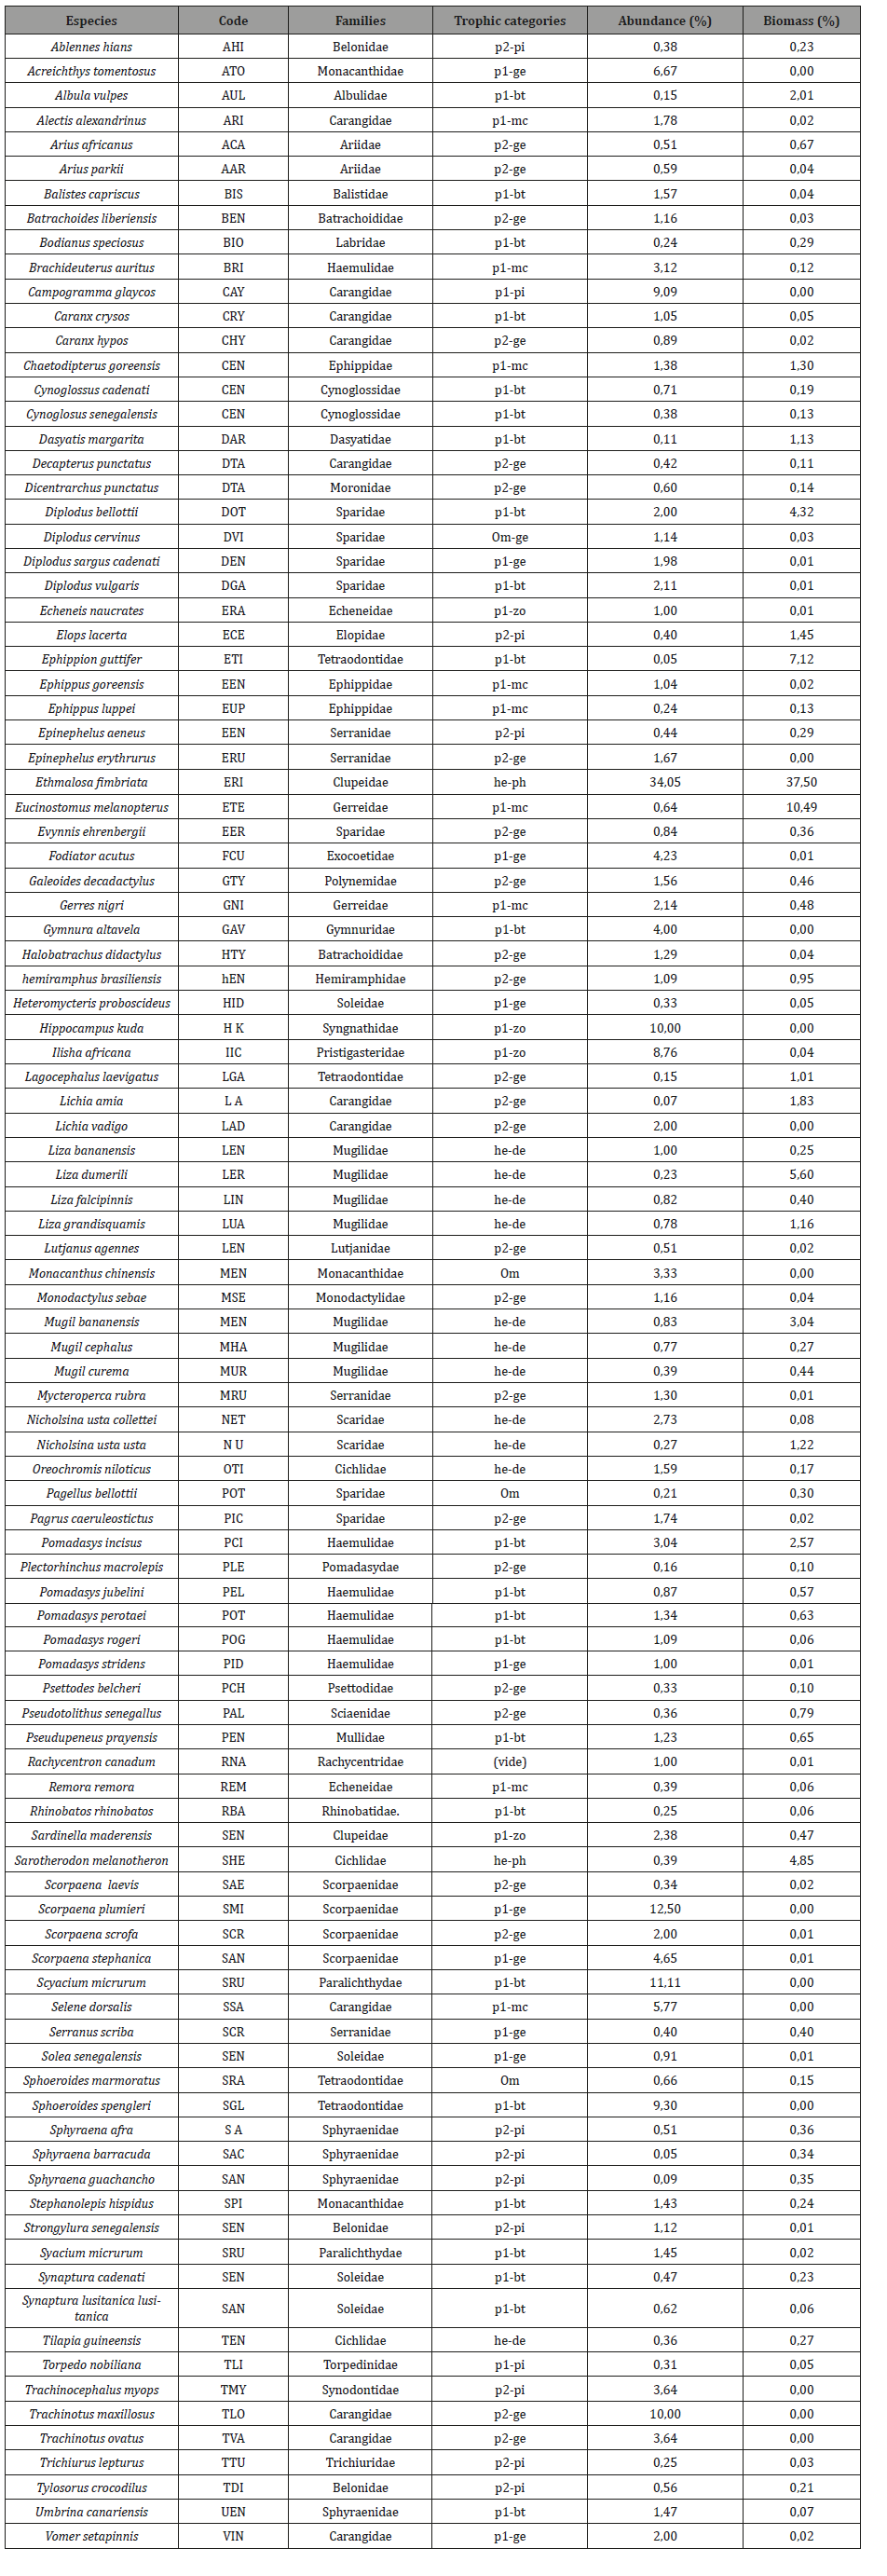
A total of 1424 individuals weighting 378.5kg composed of 103 fish species which belong to 45 families were recorded in the CMPA (Table 1). In JFMPA 8780 individuals with 1268.5kg composed of 103 fish species classified in 45 families were sampled (Table 2). Of the 103 species identified in CMPA, 65 were not encountered in JFMPA. Both MPA had only 38 species in common.
The most abundance species in CMPA were Pagellus bellottii (7.2%), Caranx crysos (5.8%), Galeoides decadactylus (5.2%) and Sarda sarda (4.4%), while in JFMPA Ethmalosa fimbriata, Diplodus bellottii, Pomadasys incisus and Eucinostomus melanopterus with 34%, 12%, 11% and 9% were the most represented species. In terms of families the Carangidae (13 species), followed by the Sparidae (12 species) and the Serranidae (7 species) were the most represented in CMPA. In JFMPA, the Carangidae, Haemulidae, Mugilidae, Sparidae with 11, 7, 7 and 7 species respectively, were the richest in terms of species diversity.
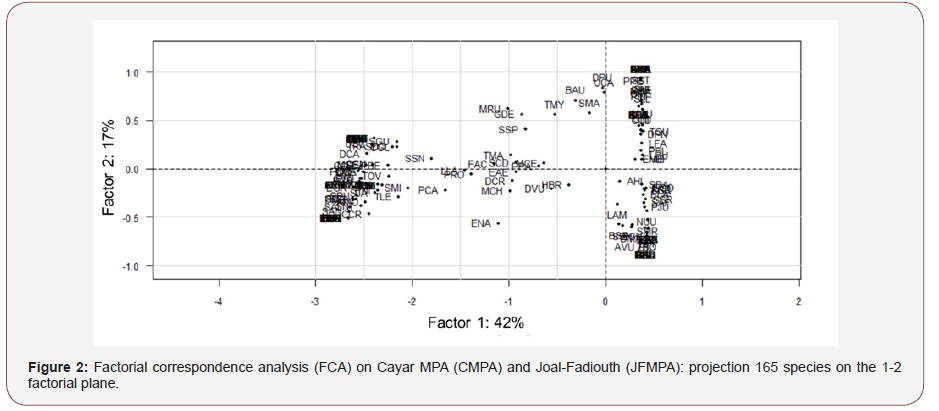
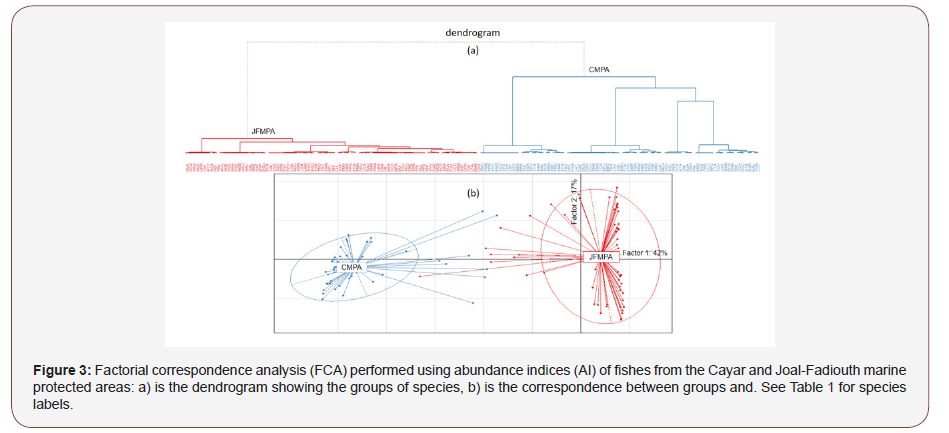
The FCA analysis based on seasonal species abundance showed that the 1-2 factorial plan support 59.0% of the total variance (42.0% for axis 1 and 17.0% for axis 2). The projection of mean points showed a clear spatial and temporal difference in fish assemblage of both MPA (Figure 2). This observation was confirmed by the HCA method allowing to classify species in two groups relative to their seasonal abundance (Figure 3a). The projection of these groups on the factorial plan 1-2 showed that these groups were clearly distinct (Figure 3b). The first group (blue color) consisted of the most abundant species in CMPA and the second group (red color) gathered most abundant species in JFMPA.
Trophic Structures
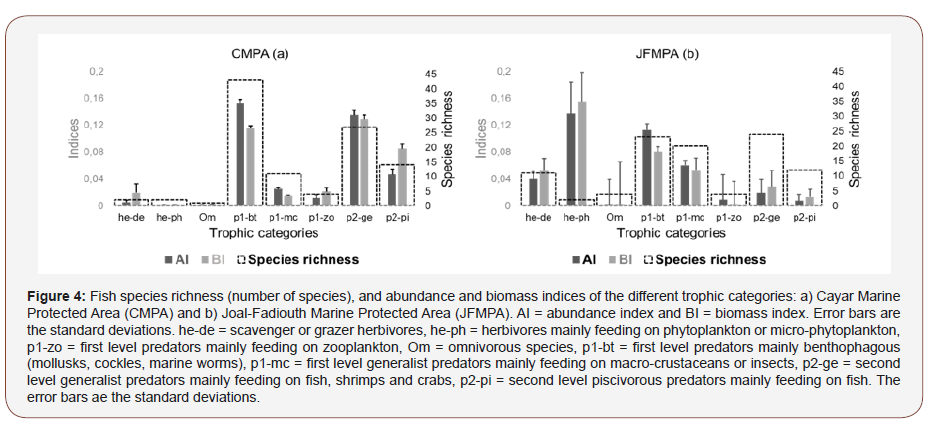
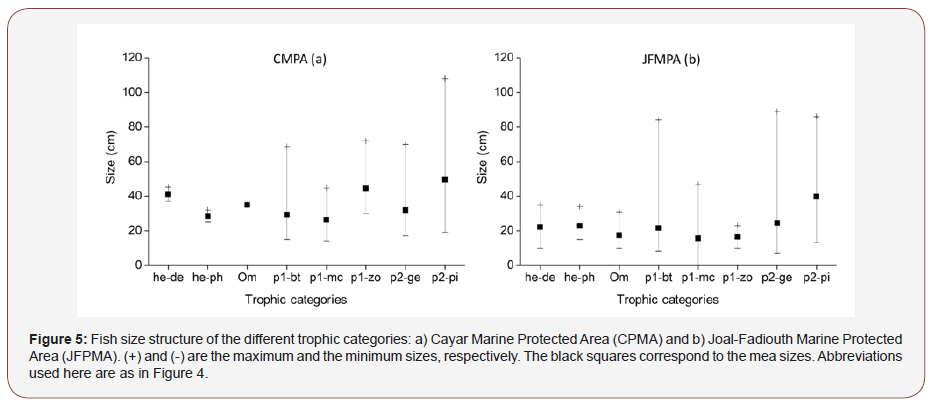
In both MPA the same trophic categories were observed (Figure 4ab). As for species richness, p1-bt (43 species), p2-ge (27 species) and p2-pi (14 species) were the most encountered species in the CMPA (Figure 4a). In JFMPA, the predator p2-ge, p1-bt and p1-mc with 24, 23 and 20 taxa were the represented in terms of species diversity (Figure 4b). As regards to abundance, in CMPA the trophic categories p1-bt, p2-ge and p2-pi represented 89.8% of the total number of individuals with 41.9%, 36.5% and 11.4% of the total number of individuals. In JFMPA the he-ph (36.8% of the total number of individuals), p1-bt (29.5% of total individuals) and p1- mc (14.8%) were the most abundant. Concerning biomass, the trio p1-bt, p2-ge and p2-pi accounted for 85.8% of the total biomass in CMPA, while in JFMPA he-ph, p1-bt and p1-mc were responsible for 75.7% of the total biomass. The size structure of the different encountered trophic categories in both MPA is presented (Figure 5ab). Mean and minimum sizes of predators, herbivorous and omnivorous species were higher in CMPA. However, maximum sizes of species belonging to p1-bt, p1-mc and p2-ge were lesser in CMPA. In CMPA the most abundant categories, p1-bt and p2-ge had the largest size classes varying between 15-66 cm and 17-70 cm, respectively (Figure 5a). Concerning JFMPA, the most important category in terms of abundance (he-ph) consisted of species whose sizes ranged from 15 to 34cm (Figure 5b). As for predator species with the highest species richness such as p1-bt, p1-mc and p2-ge, size classes varied between 8-84cm, 5-47cm and 8-89 cm, respectively.
Discussion
Comparative analysis of fish composition
Patterns in spatial composition and fish assemblage structure depend on the taxonomic identity or functional group [20] In this preliminary study, patterns derived from taxonomic and trophic analyses were driven by species’ spatial distribution. Unexpectedly, results from study suggested that fish assemblages of CMPA and JFMPA were almost identical in terms of species number. However, in terms of species composition dramatic difference was noted, more than 50% of encountered species in CMPA were absent in JFMPA, and vice versa. It’s worth highlighting that caution is needed when comparing fish composition in distinct ecosystems because several factors must be considered [21] Even if both MPA are enriched by a seasonal upwelling which favors the development of phytoplankton ensuring almost all the primary production and the functioning of the trophic network [22] their ecosystems are different. High fish diversity in CMPA might be due to the canyon which contributes to high fish diversity by limiting the intensity of migration of several demersal species [23] In JFMPA, high species richness, could be attributed to the large mangrove network which is a nursery area for many species [24] and to the favorable oceanographic conditions (high retention associated with high productivity) [25].
Comparative Analysis of Fish Abundance and Biomass
In terms of abundance and biomass notable differences were observed between these MPA. In JFMPA, abundance and biomass were six and three times higher. Similar results were found in several studies from other areas [26,27]. This high abundance and biomass in JFMPA were partially due to high presence of Ehtmalosa fimbriata which accounted for 34% of the total number of individuals and 37% of the total biomass. This species only is twice higher than total number of individuals caught in CMPA. The fact that any type of fish extraction is prohibited in JFMPA explains this difference in terms of abundance and biomass between these conservation areas. Fishery activities are very intense within CMPA, especially that of purse seine. Therefore, this human extraction, although controlled seems to reduce fish abundance in CMPA.
Comparative Analysis of Trophic Categories
The fish assemblage of CMPA were dominated, in terms of species richness and abundance, by first level predators mainly feeding in benthophageous, while generalist predators were more dominant in biomass. The dominance of p1-bt is primary due to the high catch of Cynoglossus senegalensis and Pseudupeneus prayensis accounting for 7.4% of the total number of individuals. In JFPMA, second level generalist predators dominated in species richness, while herbivore species mainly feeding on phytoplankton or micro-phytoplankton were more important as well as in terms of abundance and biomass. The higher abundance and biomass of herbivore species is due to the high proportion of the clupeid Ethmalosa fimbriata. Similar results were found by [12] comparing the fish assemblage between a protected area and an exploited site in Sine Saloum estuarine. They showed that even if same trophic groups were identified in both sites, difference in species richness, abundance and biomass was observed between the two sites. In terms of size structures, notable differences were observed between trophic categories in both MPA. Mean sizes of all trophic categories were highest in CMPA. This dichotomy in size structure could be explained by the fact that JFMPA is located in nurseries areas [19]. [25] This may explain the abundance of small fish sizes in this MPA.
Conclusion
Overall this study shows fundamental differences between CMPA and JFMPA in terms of species composition, abundance and biomass. Although both MPA have similar number of species and families, the highest fish abundance and biomass was recorded in JFMPA. These results seem to reflect the positive effect of fishing ban within JFMPA, even if fish extraction is regulated in CMPA. As prohibiting fishing activities within CMPA might be unfeasible, reducing total fishing effort, especially that of purse seine, through conventional fisheries management measures is necessary. Otherwise, small-scale no-take area should be set within CMPA.
Acknowledgement
We are thankful to the members of the Management Comity of the Cayar and Joal-Fadiouth MPA and Fishermen for their active collaboration. We are also thankful to the research institutions such as CRODT (Centre de Recherche Océanographique de Dakar- Thiaroye) and IUPA (Aquaculture and Fisheries Institute of the University of Dakar) for their technical support in the elaboration and the setting of this monitoring program.
Conflict of Interest
No conflict of interest.
References
- Teisson C (1982) Application de la théorie et Ekman àiétude des courants et des remontées d’eaux profondes le long des côtes sénégalaises. Document scientifique Centre de Recherche Océanographique Dakar- Thiaroye 106: p79.
- Faye D (2015) Assessment of the recovering effects of protected areas using a multiple functional approaches: The bamboung Model (Senegal, West Africa). International Journal of Biology 7 (3): 37-58.
- Abesamis RA, Russ GR, Alcala AC (2006) Gradients of abundance of fish across no-take marine reserve boundaries: evidence from Philippine coral reefs. Aquatic Conservation Marine Freshwater Ecosystem 16(4): 349-371.
- Ochwada-Doyle FA, McLeod J, Barrett G, Clark G, Gray C (2014) Assessment of recreational fishing in three recreational fishing havens in New South Wales. Fisheries Final Report Series No 139. Mosman, Australia; NSW Department of Primary Industries p.1-29.
- Gerber LR, Botsford LW, Hastings A, Possingham HP, Gaines SD et al. (2003) Population models for marine reserve design: a retrospective and prospective synthesis. Ecological Applications 13(1): 47-64.
- Harmelin-Vivien M, Le Direach L, Bayle-Sempere J, Charbonnel E, García- Charton JA et al. (2008) Gradients of abundance and biomass across reserve boundaries in six Mediterranean marine protected areas: evidence of fish spillover? Biology and Conservation 141(7): 1829-1839.
- Mbaye BC, Brocher T, Echevin V, Lazar A, Levy M et al. (2015) Do Sardinella aurita spawning seasons match local retention cycles in the Senegalese-Mauritanian upwelling region? Fish. Oceanogr. 24(1): 69-89.
- Escoffier B and Pagès J (1998) Analyses factorielles simples et multiples. Objectifs, méthodes et interprétation, 3rd edn . Paris: Dunod.
- Manson F J, Die DJ (2001) Incorporating commercial fishery information into the design of marine protected areas. Ocean and Coastal Management 44(7-8): 517-530.
- Jaafour S, Yahyaoui A, Sadak A, Bacha M, Amara R (2015) Fish assemblages of a shallow Mediterranean lagoon (Nador, Morocco): An analysis based on species and functional guilds. Acta Ichthyologica et Piscatoria 45 (2): 115-124.
- Auger P-A, Gorgues T, Machu E, Aumont O, Brehmer P (2016) What drives the spatial variability of primary productivity and matter fluxes in the North-West African upwelling system? A modelling approach and box analysis, Biogeoscience Discussion 13(23): 6419-6440.
- Babcock RC, Kelly S, Shears NT, Walker JW, Willis TJ (1999) Changes in community structure in temperate marine reserves. Marine Ecology Progress Series 189: 125-134.
- Morineau A , Lebart L (1986) Specific Clustering Algorithms for Large Data Sets and Implementation in SPAD Software. In: Gaul, W, Schader M Eds, Classification as a Tool of Research, North Holland, Amsterdam 321-329.
- Hoeinghaus DJ, Winemiller KO, Birnbaum JS (2007) Local and regional determinants of streamfish assemblage structure: inferences based on taxonomic vs functional groups. J Biogeogr. 34(2): 324-338.
- Willis TJ, Millar RB, Babcock RC (2000) Detection of spatial variability in relative density of fishes: comparison of visual census, angling, and baited underwater video. Marine Ecology Progress Series 198: 249-260.
- Legendre P and Legendre L (1998) Numerical ecology, second English edition. Developments in Environmental Modelling, 20: Elsivier, Amsterdam. p852.
- Ecoutin JM, Béhagle N, Brochier T, Guillard J, La€e R et al. (2013) Laire marine protégée communautaire de Bamboung (Sine Saloum) : synthèse 2003-2011. IRD, Dakar, p170.
- Bakun A (1996) Patterns in the Ocean: Ocean Processes and Marine Population Dynamics. University of California Sea Grant, San Diego, California, USA, in cooperation with Centro de Investigaciones Biologicas de Noroeste, La Paz, Baja California Sur, Mexico. ISBN 1-888696-018. p323.
- Sadio O, Simier M, Ecoutin JM, Raffray J, Lae R et al. (2015) Effect of a marine protected area on tropical estuarine fish assemblages: Comparison between protected and unprotected sites in Senegal. Ocean and Coastal Management 116: 257-269.
- Kamukuru AT, Mgaya YD, Ohman MC (2004) Evaluating a marine protected area in a developing country: Mafia Island Marine Park, Tanzania. Ocean. Coast. Manag. 47 (7-8): 321-337.
- Murphy HM, Jenkins GP (2010) Observational methods used in marine spatial monitoring of fishes and associated habitats: a review. Marine and Freshwater Research 61: 236-252.
- Dray S, Dufour A (2007) The ade4 package: implementing the duality diagram for ecologists. Journal of Statistical Software 22 (4) : 1-20.
- Champagnat C, Domain F (1978) Migrations des poissons démersaux le long des côtes ouest-africaines de 10° à 24° de latitude nord. Cah. ORSTOM, séries Océanographiques 16: 239-261.
- Diouf PS (2004) Les Aires Marines Protégées: un outil de gestion des pêcheries. DIISO n°2, p10-11.
- Halpern B (2003) The impact of marine reserves: do reserves work and does reserve size matter? Ecological Applications 13(1): 117-137.
- Russ GR, Alcala AC (1996) Do marine reserves export adult fish biomass? Evidence from Apo Island, central Philippines. Marine Ecology Progress Serie 132: 1-9.
- Russ GR, Alcala AC (1996) Marine reserves: long-term protection is requited for full recovery of predatory fish populations. Oecologia, 138(4): 622-627.
-
Ousmane Diankha, Mamadou Ndiaye, Fatima Ba, Aïssatou Niasse, Mamadou Diop, et al. Differences in Fish Assemblage Structure Between Taking and No-Taking Protected Areas: The Case of Cayar And Joal-Fadiouth Marine Protected Areas in Senegal. Ad Oceanogr & Marine Biol. 1(2): 2019. AOMB.MS.ID.000510.
-
Bioecological, Grande Côte, Multivariate, Petite, Assemblage, Multivariate, Hierarchical, Seagrasses, Zooplankton, Piscivorous, Dendrograms, Preliminary.
-

This work is licensed under a Creative Commons Attribution-NonCommercial 4.0 International License.


