 Review article
On The Correlation of IODP347-M0060 of An Integrated High-Resolution PSV, RPI and 14C Study (Anholt Loch, Baltic Sea) and An Age–Depth Model Based on An Ultra-High-Resolution, 80-m-thick Sedimentary Succession from A Marine Continental Shelf Basin, The Kattegat
Emilio Herrero Bervera*
School of Ocean Earth Science and Technology (SOEST), Hawaii Institute of Geophysics and Planetology (HIGP), Magnetic Materials, Paleomagnetics and Petrofabrics Laboratory, 1680 East West Road, Honolulu, Hawaii, USA
Emilio Herrero-Bervera, School of Ocean Earth Science and Technology (SOEST), Hawaii Institute of Geophysics and Planetology (HIGP), Magnetic Materials, Paleomagnetics and Petrofabrics Laboratory, 1680 East West Road, Honolulu, Hawaii, USA
Received Date:April 05, 2025; Published Date:April 15, 2025
Abstract
This is a study of the rock and paleomagnetic properties and 14C dating of a c. 205 m core from Site M0060 (Anholt Loch, BSB1 at Kattegat), recovering clays, (silty) sands and sandy clays and the very important correlation to the age-depth model based on an “ultra-high” resolution, 80-meter-thick sedimentary succession from a marine continental shelf basin in the Kattegat Baltic Sea. There were 297 8cc samples at c. 50 cm intervals down-core. χ was measured along with AF demagnetization of the NRM up to 80 mT. ChRM was isolated between 0 and 25 mT. A weak VRM was removed at 5 mT. The intensity shows a positive relationship with χ. At Site M0060 the upper lithologic units (i.e. 0–100 mcd) show inclinations that vary within 10° on either side of the GAD prediction (i.e. +72°). Curie points indicate minerals with temperatures of 360–400, 520, 575 and 610°C. We obtained calibrated 14C determinations for 15 levels, with the oldest age from 78.87 mbsf to c. 17 940 cal BP. The J, inclination, χ, ARM, SIRM, SIRM/χ and ARM/χ paleomagnetic (i.e. inclination) wave forms results from the top c. 100 mcd correlate well to the deglacial inclination wave forms master curve for Fennoscandia. The best correlation to this curve shows four oscillations of the inclination record of Site M0060 from 11 to 14 ka BP. Shallow negative inclinations are characteristic of the deeper coarse-grained sediments deposited during the rapid wasting of the Fennoscandian ice-sheet.
Keywords:Integrated ocean drilling program; paleosecular variation; relative paleo intensity; potential geomagnetic field oscillation
Introduction
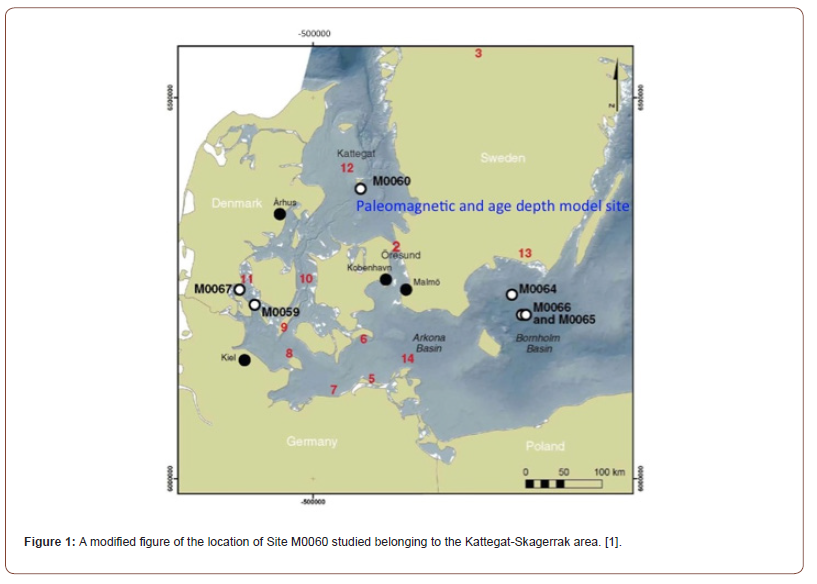
One of the main objectives of Integrated Ocean Drilling Program (IODP) Expedition 347, The Baltic Sea Experiment, from the paleomagnetic/geomagnetic, rock magnetic, paleosecular variation (PSV) and relative paleo intensity (RPI) view point is to determine the presence of potential geomagnetic field oscillation (i.e. centennial, millennial, geomagnetic jerks, Cryptochrons, Chron and Subchrons etc etc). In reality the oceanic sediments are archives of such records and if the sedimentation rates are high to very high (>than 1 m per thousand years) they represent high resolution records of the short-and-long term behavior of the geomagnetic field in the past. The drilling of several planned sites was achieved from the 12th of September until the 1st of November of 2013 of the platform operations and the subsequent Onshore Science Party (OSP) took place from the 22 of January until the 20th of February of 2014. Also, one of main objectives of such drilling experiment among other goals was produce and age-depth model for IODP site M0060 using calibrated radiocarbon years (14C) to calendar years before present and plot such results against depth and combined them with the determined sedimentation rates for such drilled site located at Site M0060 (Anholt Loch, BSB1 at Kattegat) see Figure 1. Both objectives were met and here we present of combined results to understand further the early response of the Fennoscandian Ice Sheet behavior with respect to the atmospheric and oceanic warming.
Rock Magnetic, Paleomagnetic and Relative Paleo Intensity (RPI) And Paleosecular Variation (PSV) Results
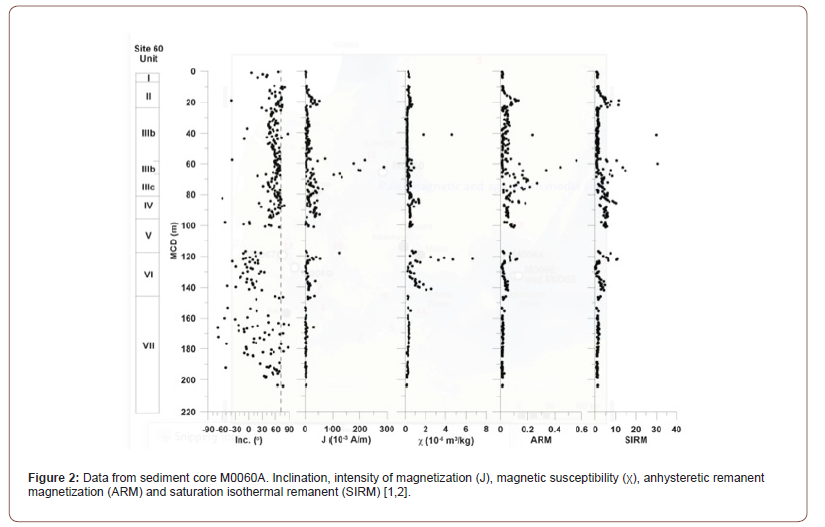
Paleomagnetic, rock magnetism properties, RPI and PSV results have been already published [1,2] and here is a summary of those results. Figure 2 shows a good summary of the results of the paleomagnetic findings. The Natural Remanent Magnetization (NRM) was determined by isolating the Characteristic Remanent Magnetization (ChRM) component by using stepwise alternating field (a.f.) demagnetization techniques from NRM up to 80mT at every 5 to 10 mT. The results of the pilot sample demagnetization indicated that an a.f. of 5 mT was sufficient to remove a weak viscous remanent magnetization (VRM) see the inclination results displayed on Figure 2. Low field susceptibility versus temperature (k-T) were conducted to characterize the magnetic mineralogy of the M0060 sediments and additional Transmission Electron Microscope experiments (TEM) to detect the presence of Greigite as well as First Order Reversal Curves (FORC’s). These experiments showed the presence of Titanomagnetite (Fe3-xTiSO4) as well as secondary Greigite (Fe++Fe+++2S4).
Induced Magnetization Experiments-Results
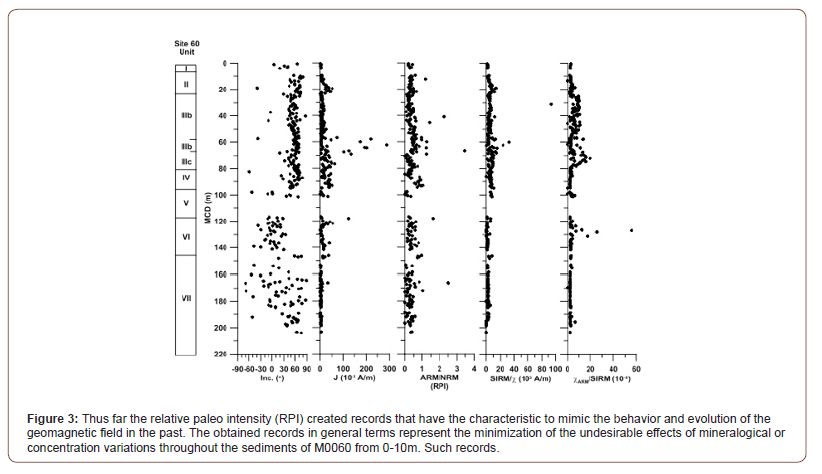
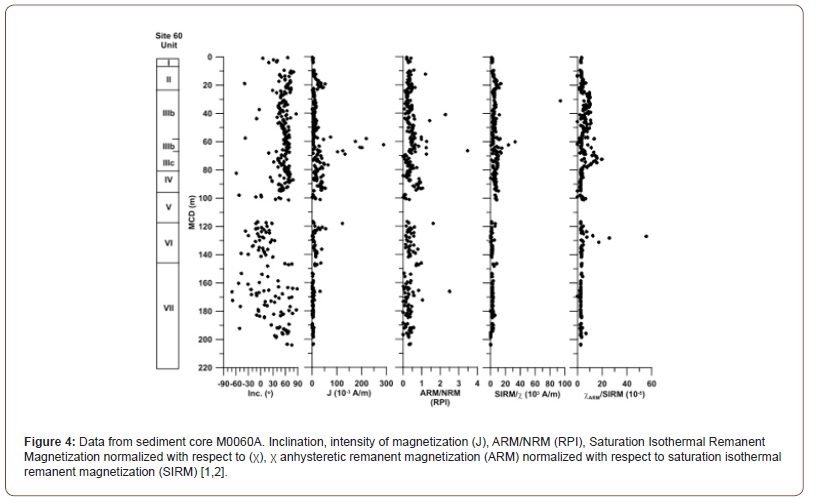
In addition to the NRM and rock magnetic properties of the M0060 sediments a study of the Relative Paleo Intensity (RPI) was conducted to investigate to potential oscillations of the top of the sediment core down to about 100m that straddle the boundaries of sedimentary Units IV and V which is the most paleomagnetic (i.e. Inclination record) reliable behavior that correlates well with the Geomagnetic Axial Dipole hypothesis (i.e. GDA=+72 degrees) see Figure 3. In order to obtain a Relative Paleo Intensity proxy for the sediments of M0060A there was induced an Anhysteretic Remanent Magnetization (ARM) and Saturation Isothermal Remanent Magnetization (SRIM) fields to 297 discrete c. 8 cc cubes from the 1.5 m sections targeted for the sampling studies. Laboratory analyses for paleomagnetic and rock magnetic characterizations were performed at the Magnetic Materials Paleomagnetics and Petrofabrics Laboratory of the SOEST-Hawaii Institute of Geophysics and Planetology of the University of Hawaii at Manoa. After we applied an AF field stepwise, we imparted an ARM at 0.5 Gauss DC field using a Helmholtz coil and superposed on an alternating field of 70 mT applied by a Schonstedt AC demagnetizer model GSD-1 to all the samples. In addition, and after demagnetizing the same samples at high AF fields there was imparted an SIRM field of 1.0 T using an ASC Scientific Model IM-10 impulse magnetizer. All these induced experiments on the specimens under question were measured on a JR5 Spinner magnetometer built by AGICO (Brno, Czech Republic). The results are shown in Figure 4. The results of the induced magnetization experiments (Figure 4) showed that for the most reliable part of the record (i.e. inclination and J), mainly from 10 m to about 100 m down-core, represented by Units II to IV, agrees well with the GAD prediction of 72°, (i.e. inclination record of the top 100 m of the core.
Relative Paleo-Intensity (RPI) Experiment Results
To understand and evaluate the strength of the geomagnetic field in this case fine laminated and rapidly deposited sediments (.0.02 m per year, from Unit III) of SiteM0060 that have successfully recorded inclination and intensity (i.e. J) changes during geomagnetic jerks and excursions, it was necessary to performed normalization of the NRM/ARM, SIRM/χ and χARM/SIRM as depicted in Figure 4. The normalized signals (i.e. SIRM/χ and χARM/SIRM) are very similar to the ARM/NRM trend and the oscillation of the top 100 m (i.e. Units I–III) that represent geomagnetic field behavior attest for the success of the relative paleo intensity results of the experiment (Figure 4).
Discussion of The Rock Magnetic and Paleomagnetic Results
The paleomagnetic data presented here, which were obtained during the OSP, as well as at the SOEST-HIGP Paleo magnetics Laboratory of the University of Hawaii, enabled to use the regional PSV deglacial master curve of Lougheed et al. [3] to identify the period of steep inclinations for the past 14 ka. A combination of such deglacial PSV curve with Fennostack led the authors of the work to assess the general patterns in inclination for the past 14 ka, and compare these to a general prediction of regional inclination for the last 14 ka, based on an extrapolation of the latitudinal and longitudinal NGP periodicity noted by Nilsson et al. [4]. These results suggest that the Fennoscandian PSV of the last 14 ka should reveal at least four recurring intervals of generally steeper inclination due to a dominant NGP longitudinal band in Europe. The recent geomagnetic field intensity changes in Sweden between c. 13.5 and c. 11.7 cal ka BP indicate that the high-resolution sedimentary data were that significant century-scale increases and decreases in relative field intensity between 14 and 11 cal ka BP and were associated with abrupt changes (i.e. spikes) in the direction of the geomagnetic field of the Earth’s magnetic vector.
Archaeomagnetic spikes younger than 14 ka were not reproduced in these multiple sediment cores study since the work of Snowball & Sandgren [5] and does not extend beyond 9 ka. A preliminary age–depth relationship based on interpolation between the inclination tie points is shown in the right side of Figure 5. The positions of four 14C determinations obtained from foraminifera (Exp. 347 scientists) are also shown for a rough comparison, and these are all older than the paleomagnetically inferred ages. The paleomagnetic results from Sweden, the Baltic Sea and NW Russia [3] on the other hand, similarly to the pseudo-thellier (PT) and RPI of Kruiver et al. [6] and Snowball & Sandgren [5] results, show century- to millennial-scale trends between 14 and 11 cal ka BP that are coherent with archaeomagnetic datasets from western Europe and Central Asia [7]. This agreement indicates that paleo intensity may be used as a relative dating technique across this region. The paleomagnetic (i.e. declination and inclination results of the Fennostack record, Lougheed et al. [3]) correlation to this curve (Figure 5) shows four oscillations of the inclination record from 11 back to 14 ka BP.
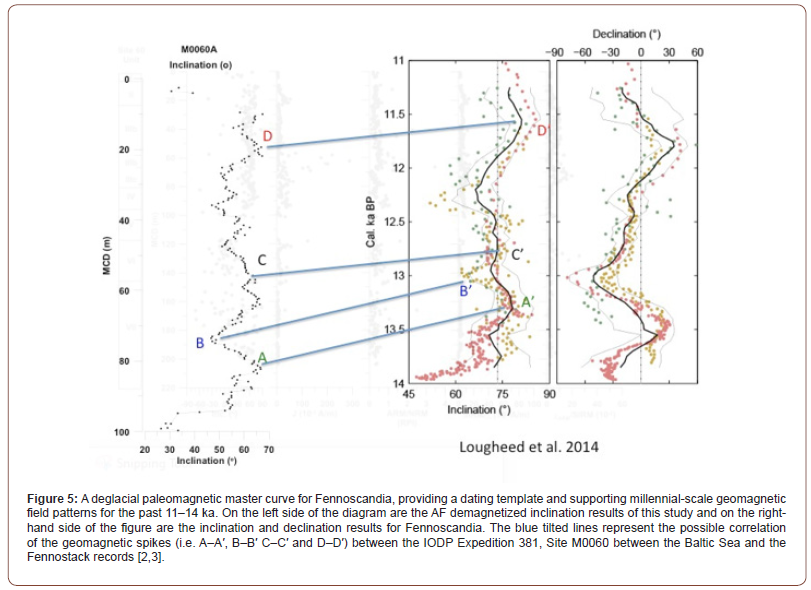
One important observation is that the inclination dataset includes positive and negative inclinations. Relatively shallow inclinations, including negative values are characteristic of the deeper, relatively coarse-grained sediments that were probably deposited during the rapid wasting of the Fennoscandian ice-sheet (FIS). Finally, these deglacial PSV master curve findings indicate a strong correlation to the hypothesis of millennial-scale trends in geomagnetic pole motions motions in the region reported by Loughheed et al., [3]. In any case, the M0060 paleomagnetic dataset contains one of the highest resolution (i.e. .20 cm ka−1 sedimentation rates) Holocene PSV datasets ever recovered from the marine realm [2].
The Age Model and Sedimentation Rates
In order generate an age model, 31 samples were measured (24 mollusk samples and seven benthic foraminifera samples) for radiocarbon (14C). The samples were analyzed at the Poznan Radiocarbon Laboratory (Poland), Lund Radiocarbon Dating Laboratory and at the Zurich, Radiocarbon Dating Laboratory (ETH) in Switzerland, led by scientists of the University of Helsinki, and the Geologian tutkimuskeskus, Environmental Solutions group led by Dr Aarno Kotilainen, Finland. The interval 6 to 10 mcd was not recovered from Hole M0060A, so three samples from Hole M0060B were measured to increase resolution. They assumed the sediment surface to be modern (i.e. 2013, the year of coring). Calibrated radiocarbon (14C) years to calendar years before present (cal BP, BP = AD 1950) using OxCal 4.2 software [8] and the MARINE13 calibration dataset [9] without deviation from the Marine13 reservoir age. To justify this choice, they explored alternative reservoir ages. All subsequent ages discussed refer to calibrated ages in the years before 1950 BP.
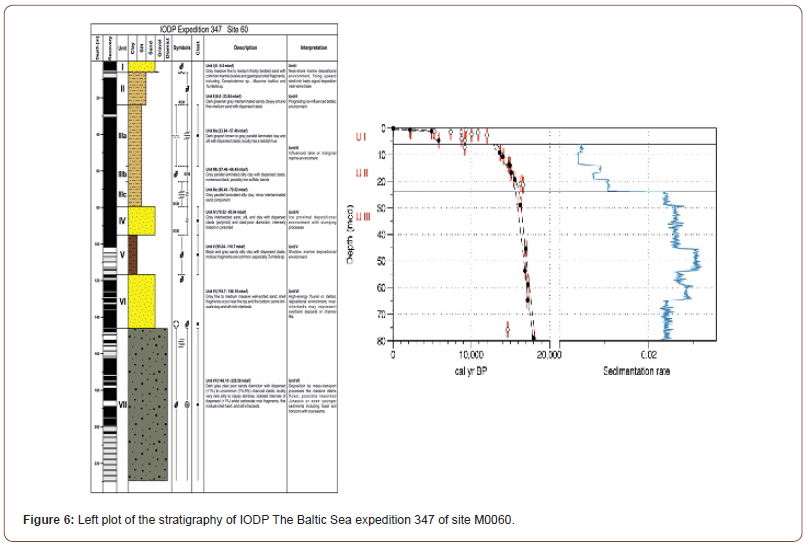
The sedimentation rates were calculated and will be published in the literature. The mean sedimentation rate in Unit III (Hole A: 79.52–23.84 mcd) is 2.95 cm a−1; the mean sedimentation rate in Unit II (Hole A: 23.84–6 mcd) is 0.53 cm a−1, and the sedimentation rate within these units is generally steady, with no evidence of abrupt changes in the sedimentation rate. In their age–depth model, Unit III top (23.84 mcd) was given an age of 15.9 ka. Their interpolation was based on the average sedimentation rate within Unit III. In a similar way, Unit II top (6.0 mcd) was estimated to be an age of 13.0 ka (+/−100 years). This estimation gives the minimum mean sedimentation rate for Unit I as 0.05 cm a−1 (or more). If this minimum rate is applied, the lower boundary of Unit I will be 8.4 ka. This coincides relatively well with the discarded age of c. 9.2 ka from Hole B (7.21 mcd), which was interpreted to come from Unit I. These sedimentation rates results have been published already in the in the literature [10-15]
Correlation between Paleomagnetic Magnetostatigraphy, Rock Magnetic, Relative Paleo intensity (RPI), Paleo-Secular Variation (PSV) and Age-Depth Model for IODP Site M0060
It has been reported relatively recently a manuscript with the latest and most updated age-depth model coupled with the sedimentation rates of IODP 347 Site M0060 [16-19]. Here, it is displayed a composite figure including the detailed stratigraphic units and the age-depth model combined with the obtained sedimentation rates. Right: age–depth model for IODP site M0060. Radiocarbon age results are plotted against depth (m c.d.) and ages used in the model are indicated by black dots. F indicates that radiocarbon dates are obtained on foraminifera. Samples marked with a white/open diamond were omitted from the depth model. The age scale is given in years before present (cal. a BP). The dashed lines indicate the95.4% likelihood age range and the solid horizontal lines show the boundaries between Units I, II and III. Right: sedimentation rates (centimetres/year) for Units II and III based on the dated samples [20-26]. Samples gave scattered age estimates for Unit I and the unit shows indications of sedimentary reworking and redeposition, and depositional rates were therefore not calculated for this unit. Modified from Andren et al. [1] and Hyttinen et al [10].
Overall Conclusions
One important observation of the combined results is that relatively shallow inclinations were obtained from analyses of the deeper, relatively coarse-grained sediments that were probably deposited during the rapid wasting of the Fennoscandian ice-sheet, which may have implications for the interpretation of paleomagnetic data derived from glacial deposits [27-33]. The paleomagnetic (i.e. Inclination), relative paleo intensity (RPI) and Paleosecular variations (PSV) are restricted to the high paleomagnetic stability interval between ~9 meters corresponding to Unit 1 down to ~95 meters corresponding to Unit 4 of the magnetostratigraphic record, See Figures 4-6. The most prominent archaeomagnetic jerks (i.e. oscillations) derived from these studies have occurred in Fennoscandia, with significant peaks in geomagnetic field intensity that have occurred at c. 11.7, c. 12.8, c. 13.2 and c. 13.5 cal ka BP [3]. The maximum field at 12.8 cal ka BP was associated with the most rapid change in the direction of the geomagnetic vector [34,35]. The recent geomagnetic field intensity changes in Sweden between c. 13.5 and c. 11.7 cal ka BP indicate that the high-resolution sedimentary data were that significant century-scale increases and decreases in relative field intensity between 14 and 11 cal ka BP and were associated with abrupt changes (i.e. spikes) in the direction of the geomagnetic field of the Earth’s magnetic vector [36-47].
Acknowledgements
Emilio Herrero-Bervera, as well as IODP Expedition 347 Scientists gratefully acknowledge the support of ECCORD/IODP during both the off-shore and the onshore sampling party (OSP) to make this study possible. We thank Mr. James Lau for his assistance with the magnetic measurements performed during the length of the experiment at the SOEST-HIGP Laboratory. We also thank two anonymous referees for the very constructive comments.
These are SOEST
SOEST#11935 and HIGP #2507 publication contributions. Funding Salary support to EHB was provided by SOEST-HIGP of the University of Hawaii at Manoa as well as NSF grants NSF-EARGeophysics 1719733 and NSF-IF Grant number 0710571. This paper is dedicated to the memory of Dr Jean-Pierre Valet and Mr James King Sun Lau.
References
- Andrén T, Jørgensen BB, Cotterill C, Green S (2015) Baltic Sea Paleoenvironment. Proceedings of the IODP. Integrated Ocean Drilling Program.
- Herrero-Bervera E, Snowball I (2020) Integrated high-resolution PSV, RPI and 14C study of IODP-347 Site M0060 (Anholt Loch, Baltic Sea) for the last c. 14 ka. Geological Society London Special Publications.
- Lougheed BC, Nilsson A, Björck S, Muscheler R, Snowball I (2014) A deglacial paleomagnetic master curve for Fennoscandia providing a dating template and supporting millennial-scale geomagnetic field patterns for the past 14 ka. Quaternary Science Reviews 106: 155-166.
- Nilsson A, Holme R, Korte M, Suttie N, Hill M (2014) Reconstructing Holocene geomagnetic field variation: anew methods, models and implications. Geophysical Journal International 198(1): 229-248.
- Snowball I, Sandgren P (2004) Geomagnetic field intensity changes in Sweden between 9000 and 450 cal BP: extending the record of archaeomagnetic jerks by means of lake sediments and the pseudo-Thellier technique. Earth and Planetary Science Letters 227(3-4): 361-376.
- Kruiver PP, Kok YS, Dekkers MJ, Langereis CG, Laj C (1999) A pseudo-Thellier relative palaeointensity record, and rock magnetic and geochemical parameters in relation to climate during the last 276 kyr. In the Azores region. Geophysical Journal International 136(3): 757-770.
- Xiaoqiang Yang, Qingsong Liu, Kefu Yu, Wenya Huang, Liyan Zhu, et al. (2016) Paleosecular variations of the geomagnetic field during the Holocene from Eastern Asia. Physics Earth and Planetary Interiors 254: 25-36.
- Bronk Ramsey C (2009) Bayesian analysis of radiocarbon dates. Radiocarbon 51(1): 337-360.
- Reimer PJ, Bard E, Bayliss A, Beck JW, Blackwell PG, et al. (2013) IntCal13 and Marine13 radiocarbon age calibration curves 0-50,000 years cal BP. Radiocarbon 55(4): 1869-1887.
- Hyttinen O, Quintana Krupinski, Bennike O, Wacker L, Filipsson HL, et al. (2020) Deglaciation dynamics of the Fennoscandian Ice Sheet in the Kattegat, the gateway between the North Sea and the Baltic Sea Basin. Boreas 50(2): 351-368.
- Banerjee SK, King J, Marvin J (1981) A rapid method for magnetic granulometry with applications to environmental studies. Geophyical 309 Research Letters 8(4): 333-336.
- Brachfeld SA, Banerjee SA (2000) A new high-resolution geomagnetic relative paleointensity record for the North American Holocene: A comparison of sedimentary and absolute intensity data. J Geophys Res 105(B1): 821-834.
- Brachfeld SA, Domack E, Kissel C, Laj C, Leventer A, et al (2003) Holocene history of the Larsen-A Ice Shelf constrained by geomagnetic palaeointensity dating. Geology 31(9): 749-752.
- Korte M, Constable CG (2015) GEOMAGIA50 v3: 2. A new paleomagnetic database for lake and marine sediments. Earth Planets and Space PP. 67-70.
- Channell JET, Stoner JS, Hodell DA, Charles CD (2000) Geomagnetic paleointensity for the last 100 kyr from the sub-Antarctic South Atlantic: A tool for inter-hemispheric correlation. Earth and Planetary Science Letters 175(1-2): 145-160.
- Channell JET, Mazaud A, Sullivan P, Turner S, Raymo ME (2002) Geomagnetic excursions and paleointensities in the Matuyama Chron at Ocean Drilling Program Sites 983 and 984 (Iceland Basin). Journal of Geophysical Research 107(B6): 1-14.
- Clement BM, Kent DV (1984) A detailed record of the Jaramillo polarity transition from a southern hemisphere, deep-sea sediment core. Journal of Geophysical Research 89(B2): 1049-1058.
- Constable CG, McElhinny MW (1985) Holocene geomagnetic secular variation record from north- eastern Australian lake sediments. Geophysical Journal Royal Astronomical Society 81(1): 103-120.
- Gogorza CSG, Sinito AM, Lirio JM, Nunez H, Chaparro MAE, et al. (2002) Paleosecular Variations 0–19,000 years recorded by sediments from Escondido Lake (Argentina), Physics of Earth and Planetary Interiors 133(1): 35-55.
- Gogorza CSG, Lirio JM, Nunez H, Chaparro MAE, Bertorello HR, et al. (2004) Palaeointensity studies on Holocene-Pleistocene sediments from Lake Escondido, Argentina. Physics of Earth and Planetary Interiors 145(1-4): 219-238.
- Gogorza CSG, Irurzun MA, Chaparro MAE, Lirio JM, Nunez H, et al. (2006) Relative paleointensity of the geomagnetic field over the last 21,000 years BP from sediment cores, Lake El Trebol (Patagonia, Argentina). Earth Planets Space 58(10): 1323-1332.
- Hyttinen O, Kotilainen A T, Virtasalo JJ, Kekäläinen P, Snowball I, et al. (2017) Holocene stratigraphy of the Ångermanälven river estuary, Bothnian Sea. Geo-Marine Letters 37(3): 273-288.
- Hrouda F (1994) A technique for the measurement of thermal changes of magnetic susceptibility of weakly magnetic rocks by the CS-2 apparatus and KLY-2 Kappabridge. Geophys J Int 118(3): 604-612.
- Hrouda F, Jelinek V, Zapletal K (1997) Refined technique for susceptibility resolution into ferrimagnetic and paramagnetic components based on susceptibility temperature variation measurements. Geophys J Int 129(3): 715-719.
- King JW, Banerjee SK, Marvin J (1983) A New Rock Magnetic Approach to Selecting Sediments for Geomagnetic Paleointensity Studies: Application to Paleointensity for the Last 4000 Years. Journal of Geophysical Research 88(B7): 5911-5921.
- Kirschvink JL (1980) The least-square line and plane and the analysis of paleomagnetic data. Geophysical Journal Royal Astronomical Society 62(3): 699-718.
- Korte M, Donadini F, Constable CG (2009) Geomagnetic field for 0-3 ka: 2. A new series of time varying global models. Geochemistry Geophysics and Geosystems 10(6).
- Korte M, Constable C, Donadini F, Holme R (2011) Reconstructing the Holocene geomagnetic field. Earth Planetar Science Letters 312(3): 497-505.
- Laj C, Kissel C, Mazaud A, Channell JET, Beer J (2000) North Atlantic palaeointensity stack since 75 ka (NAPIS-75) and the duration of the Laschamp event. Transanctions Royal Society of London Ser A 358(1768): 1009-1025.
- Levi S, Banerjee SK (1976) On the Possibility of Obtaining Relative Paleointensities from Lake Sediments. Earth and Planetary Science Letters 29(1): 219-226.
- Lougheed BC, Filipsson HL, Snowball I (2013) Large spatial variations in coastal 14C reservoir age-a case study from the Baltic Sea. Climate of the Past 9(3): 1015-1028.
- Lund SP (2018) A New View of Long-Term Geomagnetic Field Secular Variation. Front Earth Sci 6: 40.
- Meynadier L, Valet JP, Weeks R, Shackleton NJ, Hagee VL (1992) Relative geomagnetic intensity of the field during the last 140 ka. Earth and Planetary Science Letters 114(1): 39-57.
- Nowaczyk NR, Harwart S, Melles M (2001) Impact of early diagenesis and bulk particle grain size distribution on estimates of relative geomagnetic paleointensity variations in sediments from Lama Lake, northern Central Siberia. Geophysical Journal International 145(1): 300-306.
- Pan Y, Zhu R, Shaw J, Liu Q, Guo B (2001) Can relative paleointensities be determined from the normalized magnetization of the wind-blown loess of China?. Journal of Geophysical Research 106(B9): 19221-19232.
- Peck JA, King JW, Colman SM, Kravchinsky VA (1996) An 84-kyr Paleomagnetic record from the sediments of Lake Baikal, Siberia. Journal of Geophysical Research 101(B5): 11365-11385.
- Roberts AP, Lehman B, Weeks R, Verosub K, Laj C (1997) Relative palaeointensity of the geomagnetic field over the last 200,000 years from ODP Sites 883 and 884, North Pacific Ocean. Earth and Planetary Science Letters 152(1-4): 11-23.
- Roberts AP, CR Pike, KL Verosub (2000) First-order reversal curve diagrams: A new tool for characterizing the magnetic properties of natural samples. J Geophys Res 105(B12): 28461-28475.
- Roberts AP, Heslop D, Zhao X, Pike CR (2014) Understanding fine magnetic particle systems through use of first-order reversal curve diagrams. Rev Geophys 52(4): 557-602.
- Snowball IF (1997) Gyroremanent magnetization and the magnetic properties of greigite bearing clays in southern Sweden. Geophysical Journal International 129(3): 624-636.
- Snowball I, Zillén L, Ojala A, Saarinen T, Sandgren P (2007) FENNOSTACK and FENNORPIS: varve dated Holocene palaeomagnetic secular variation and relative palaeointensity stacks for Fennoscandia. Earth and Planetary Science Letters 255(1-2): 106-116.
- Tauxe L (1993) Sedimentary records of relative paleointensities of the geomagneticfield: theory and practice. Reviews Geophysics 31(3): 319-354.
- Tauxe L, Pick T, Kok YS (1995) Relative paleointensity in sediments: a pseudo-Thellier approach. Geophysical Research Letters 22(21): 2285-2888.
- Usapkar A, Dewangan P, Badesab F, Mazumdar A, Ramprasad T, et al. (2016) High resolution Holocene palaeomagnetic secular variation records from Bay of Bengal. Physics Earth and Planetary Interiors 252: 49-76.
- Verosub KL, Herrero-Bervera E, Roberts AP (1996) Relative Geomagnetic Paleointensity across the Jaramillo Subchron and the Matuyama/Brunhes Boundary. Geophysical Research Letters 23(5): 467-470.
- Valet JP (2003) Time variations in geomagnetic intensity. Rev Geophys 41(1): 1004.
- Yang S, Odah H, Shaw J (2000) Variations in the geomagnetic dipole moment over the last 12,000 years. Geophysical Journal International 140(1): 158-162.
-
Emilio Herrero Bervera*. On The Correlation of IODP347-M0060 of An Integrated High-Resolution PSV, RPI and 14C Study (Anholt Loch, Baltic Sea) and An Age–Depth Model Based on An Ultra-High-Resolution, 80-m-thick Sedimentary Succession from A Marine Continental Shelf Basin, The Kattegat. Ad Oceanogr & Marine Biol. 4(1): 2025. AOMB.MS.ID.000587.
-
Integrated ocean drilling program; paleosecular variation; relative paleo intensity; potential geomagnetic field oscillation; iris publishers; iris publisher’s group
-

This work is licensed under a Creative Commons Attribution-NonCommercial 4.0 International License.


