 Research Article
The Role of Three-Dimensional Magnetic Resonance Spectroscopy in Diagnosing and Grading of Gliomas
Irakli Gakhokidze1,2*, Ketevan Tavadze1, Mirza Khinikadze 1,2,3, Nikoloz Sainishvili3 and Koka Gogichashvili2,3
1Aversi Clinic, Tbilisi, Georgia
2NewVision University, Tbilisi, Georgia
3Caucasus Medical Centre, Tbilisi, Georgia
Irakli Gakhokidze, Radiologist, NewVision University, Tbilisi, Georgia.
Received Date: February 25, 2023; Published Date: March 07,2023
Abstract
In patients with suspected cerebral glioma, non-invasive preoperative evaluation of brain tumor grading is important for planning treatment and prognostication. Conventional MRI is an established and useful tool in brain tumor grading, but MRI-based tumor grading may lead to low-grade or high-grade misclassification in some cases. Three-dimensional magnetic resonance spectroscopy (MRS) has been proposed as an alternative modality for grading cerebral glioma. It is a noninvasive functional imaging method based on metabolite detection by measurement of a spectrum for specific isotopes in tissues, providing additional information to anatomical imaging. MRS can identify several metabolites, but currently only a few of them have a role in diagnosis of gliomas. Among them are N-acetylaspartate, choline, creatine, lactate and lipids. [1-5]. Multivoxel magnetic resonance spectroscopy is becoming available for clinical applications and can distinguish normal tissue morphology from abnormal based on their metabolic composition. The aim of our study was to determine the role of multivoxel MRS in diagnosing and treatment planning of gliomas. According to our data obtained the MRS seem to provide unique information that when combined with high-quality anatomical MR images has implications for defining tumor type and grade, directing biopsy or surgical resection, planning focal radiation and understanding the mechanisms of success and failure of new treatments [6-10].
Introduction
Gliomas are the most common primary brain tumors in adults, with high incidence of poor prognosis due to persisting challenges in treatment. Gliomas are characterized by invasive growth into normal brain tissue, making complete surgical resection and radiotherapy planning very difficult [1]. According to the World Health Organization (WHO), gliomas are categorized into four grades. Grade 1 and 2 (low-grade glioma), grade 3 and 4 (high-grade glioma). Recently, an updated classification model was proposed by the World Health Organization (WHO) for brain tumors which, diversly from the previous one, includes not only histology but also isocitrate dehydrogenase status and related genetic parameters [10]. Since Georgia currently doesn’t have access to all molecular tests necessary for precise grading, a new term - NOS (not otherwise specified) is used [10]. This fact once again underlines the importance of additionally more precise diagnostic imaging methods.
Low-grade gliomas exhibit benign tendencies and provide a better prognosis for the patient. High-grade gliomas tend to grow rapidly and spread faster and thus they carry a worse prognosis.
Materials and Methods
We performed a prospective cohort study obtaining MR spectroscopy examinations during 3 years at our center. We investigated a total of 110 patients that addressed the Aversi clinic (Tbilisi, Georgia), with their age ranging from 21 to 70.
Inclusion criteria:
1. patients referred to the Department of Radiodiagnosis.
2. MRI evaluation of brain tumors with diagnosis of gliomas by standard MRI.
3. Patient agrees to participate in the study and has signed the informed consent form.
Exclusion criteria:
1. Patients not willing to participate in the study.
2. Patients with pacemakers, cochlear implants, metallic clips or metallic foreign bodies.
3. Patients with radiological or histopathological diagnosis of other cerebral pathologies.
The study was approved by the New Vision University (Tbilisi, Georgia). All participants submitted their consent in a written form.
According to the above-mentioned criteria, 10 patients were excluded from the study, due to cerebral hemorrhage or calcified nodules. Eighty patients (46 male and 34 female; 30– 50 years old; mean age - 44 years) with a diagnosis of glioma (on standard MRI) and a control group of 20 healthy patients underwent 3D MRS examinations. Metabolite ratios choline (Cho)/ creatine (Cr), N-acetylaspartate (NAA)/creatine (Cr) and Cho/ NAA were measured. Tumor grade was determined by using the histopathologic grading. characteristic analysis of metabolite ratios was performed, and optimum thresholds for tumor grading were determined.
Principle metabolites studied:
N-acetylaspartate
The MR spectrum of the adult central nervous system shows a very high peak at 2.0 ppm that corresponds to the total N-acetyl-containing compounds (tNAA) consisting mainly of N-acetylaspartate (NAA) and therefore this peak is usually labeled only as NAA [11-15]. The peak contains also a smaller amount of N-acetylaspartylglutamate (NAAG).
NAA is a derivative of aspartic acid produced in the mitochondria of neurons and transported into the neuronal cytoplasm and along axons [15-22].
Choline
Choline (Cho) is often referred to as a metabolic marker of cell membrane density and integrity. Its spectral peak is at 3.2 ppm and its signal is crucial for glioma examination by MRS. MRS detects total Cho (tCho) which comprises several choline-containing compounds not incorporated into the large macromolecules of the cell membrane: phosphocholine (PCh), glycerophosphocholine (GPCho) and free choline (fCho) [22-30].
Creatine
(Cr) is also known as an energy metabolism marker that is synthesized from amino acids primarily in the kidneys and liver and transported to the peripheral tissues/organs by blood [17,31]. It’s a relatively stable element and is used for the calcutation of metabolic ratios. Total Cr, which represents the quantity of phosphocreatine (PCr) and Cr contained in neurons and glial cells, is visualized in the MR spectrum mainly as the high peak located at 3.0 ppm [32]. Cr is not a primary metabolite of the intracranial space, its brain concentration measured by MRS may be affected by other factors [33].
Lactate and lipid
Lactate (Lac) and lipids (Lip) are markers of anaerobic metabolism. Lac is not detected in healthy brain tissue and there is a direct correlation between Lac levels, presented as a double peak in the MR spectra at 1.31 ppm, and glioma grade. (18). Malignant transformation of the glial tumors is accompanied by an increase in cell density causing relative cellular ischemia and thus resulting in higher levels of Lac. We performed the study at our center. 2D MRS was performed on a small region of the brain, which doesn’t analyse the entire structure of the tumor. Informative capacity of 3D MRS isn’t fully known. Furthermore, the characteristics of the visually unchanged brain structures aren’t well understood. The purpose of the study was to elaborate protocol for 3D MRS, analyse metabolic profile of the healthy brain structures in patients with glioma and compare it to a healthy control group.
The Study was performed on a Philips Ingenia 3-Tesla MRI scanner using the head coil (DS Head coil). The study includes several phases. Firstly, all patients underwent brain screen protocol, non-contrast with basic MRI sequences : T1, T2, Flair, DWI, axial, sagittal, coronal planes. After that 3D MRS was performed. The protocol of 3D MRS included following sequences: 3D T1 axial (for choosing the region to study), s3D_PRESS_144. On reconstruction images a voxel frame was placed, including the area of interest. Additionally, factors like poor shimming and lipid contamination, due to skull-based fat, were controlled to avoid a low-quality spectrum. Signals from fat and CSF (primary shimming) were supressed by saturation bands. with this technique we used not only primary shimming (correction of magnetic field homogeneity), but also second order shimming. In the area of interest magnetic fields were as homogenous as possible (Table 1).
Table 1:Main metabolite peak correlation between gray and white matter of healthy brain.

Results
> NAA/Cr correlation in white matter was 40% more than in gray matter
> In white matter NAA was slightly elevated
> In white matter Cr is stable (p>0.05)
> In gray matter Cr was more than in white matter
> Gender or hemispheric differences was not found
> Cho capacity in gray matter was less than in white matter
Conclusion
The results of our study correspond to the results obtained by other researchers.
✔ The results obtained with 3D MRS are more informative.
✔ Examination was not time consuming and duration can be justified by the information obtained (Table 2).
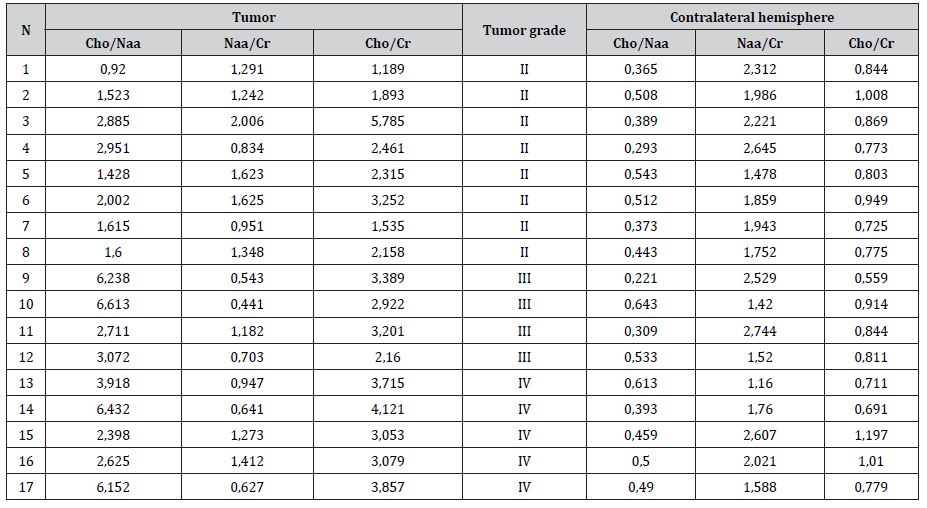
Table 2:Patients with different grade of tumor and contralateral unchanged hemisphere metabolite ratio.
Results
✔ NAA/Cr ratio measurement hasn’t revealed significand difference between the healthy hemisphere of glioma patients and healthy volunteers.
✔ Although Cho/NAA ratio is substantially same between the two groups, slight increase of Cho and decrease of NAA is seen in the healthy hemisphere of glioma patients due to the characteristic metabolic changes.
✔ Cho/Cr ratio is slightly increased in the healthy hemisphere of glioma patients as compared to the healthy volunteers. (p< 0,001).
Diffuse astrocytoma (WHO grade II)
WHO grade II diffuse astrocytoma and main metabolites ratio Cho/Cr 2.34±1.22; Cho/NAA 1.7±0.67; NAA/Cr 1.33±0.51 (Table 3).
Table 3:Main metabolites ratio in patients with diffuse cerebral astrocytoma (WHO grade II) and statistical parameters, 3D MRS shows increase of Cho and decrease of NAA. Cr is stable.

Anaplastic astrocytoma (WHO grade III)
WHO III grade anaplastic astrocytoma metabolites index : Cho/ Cr 2,61±1,37, Cho/NAA 3,68±2,62, NAA/Cr 0,78±2,47 (Table 4).
Anaplastic oligodendroglioma (WHO grade III)
WHO III grade anaplastic oligodendroglioma metabolites index: Cho/Cr 2.78±0.85, Cho/NAA 2.06±0.76, NAA/Cr 1.33±0.31 (Table 5).
Table 4:Main metabolite relations in patients with anaplastic astrocytoma (WHO grade III ) and statistical parameters. 3D MRS shows increase of Cho and NAA was more pronounced decreased. Cho/Cr ratio was significantly higher in contrast enhanced region, where the highly anaplastic focus is located.

Table 5:main metabolite relations in patients with anaplastic oligodendroglioma (WHO grade III ) and statistical parameters. 3D MRS specificity of NAA/Cr ratio in differential diagnosis of grade III anaplastic gliomas and grade III anaplastic oligodendroglioma was 85,7%. Sensitivity 75%.

Table 6:main metabolite relations in patients with glioblastoma (WHO grade IV ) and statistical parameters. 3D MRS shows Choline elevation, reduced NAA and noticeable Lac/Lip peak which indicates on more aggressive, high grade glioma.

Glioblastoma (WHO grade IV)
WHO grade IV glioblastoma metabolites index: Cho/Cr 2.9±0.98, Cho/NAA 4.2±2.3, NAA/Cr 0.88±0.54 (Table 6).
3D MRS of healthy hemisphere of glioma patients
In our study we compared main metabolic ratios of healthy volunteers to the healthy hemisphere of glioma patients.
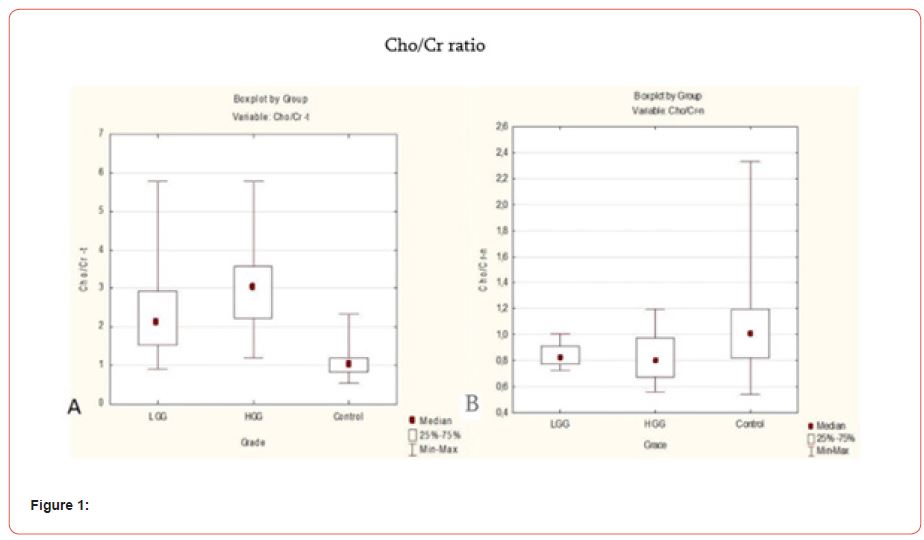
In our study we observed small difference in Cho/Cr ratio, between healthy volunteers and the healthy hemisphere of different grade glioma patients. (p<0.03). In comparison to healthy volunteers, Cho/Cr ratio is slightly elevated in the healthy hemisphere of glioma patient, especially with II-IV grade (Figures 1-2).
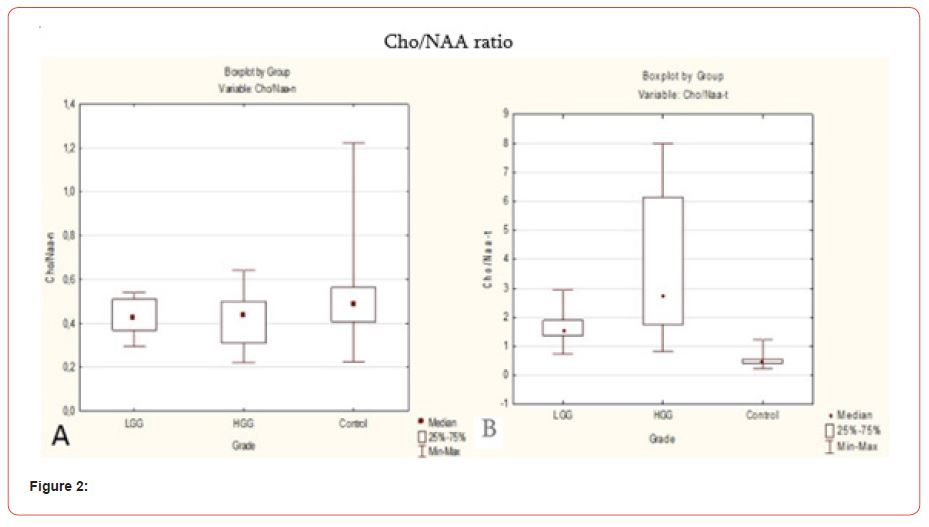
Cho/NAA ratio was slightly higher in the healthy hemisphere of glioma patients rather than in healthy volunteers (p<0.07). We can suppose that Cho is slightly elevated in the healthy hemisphere of glioma patients (Figure 3).
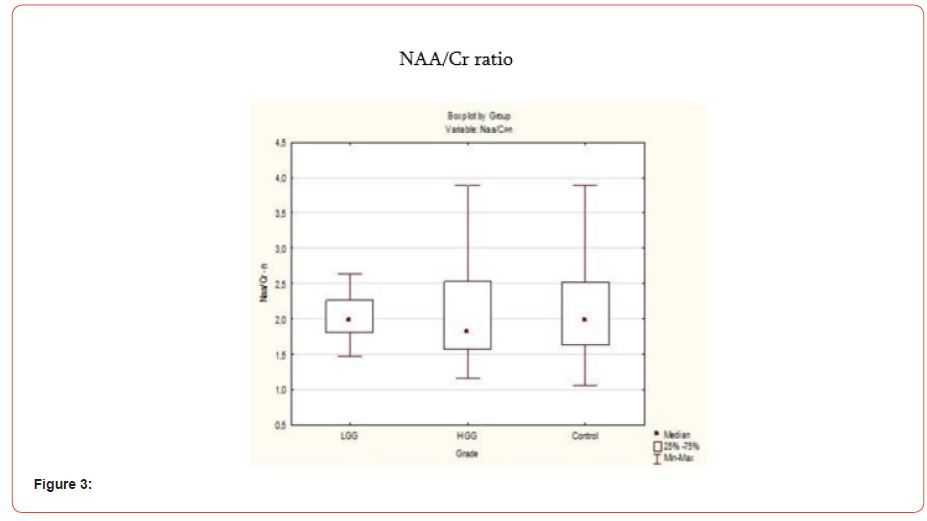
In our study we suppose that NAA/Cr ratio in the healthy hemisphere of glioma patient is not dependent on the grade of the glioma (p=0.67). Study did not show significant difference in NAA/ Cr ratio between healthy hemisphere of glioma patient and healthy volunteer. To sum up, 3D MRS shows metabolic changes not only in the tumoral and the peritumoral region but also in the healthy hemisphere of glioma patient.
Discussion
1. shimming plays an important role during 3D MRS imaging, because it allows the area of interest to be homogenous and removes any artifacts caused by hemorrhage, air and cerebrospinal fluid. Factors like poor shimming and lipid contamination due to skull-based fat must be controlled to avoid a low-quality spectrum.
2. Imaging a large area of interest, while taking a voxel frame (FOV 8x8x8) into account, plays a key role in precise diagnosis.
3. To insure a high quality MR spectroscopy the area of interest should not include bone structures, areas of pooled blood and calcified areas.
4. An MR spectroscopic analysis from the healthy hemisphere of the brain should be performed and used as reference to Images obtained from pathological areas.
5. spectroscopic analysis consists of not only visual changes on MR spectra, but of main metabolites (NAA/Cr, NAA/Cho, Cho/Cr) indexes.
6. 3D MRS spectroscopy should be performed before contrast administration to avoid false positive results.
Conclusion
1. 1.3D MRS has high sensitivity (87.5% (Cho/NAA), 76.5 (Cho/Cr), 82.4% (NAA/Cr)) and specificity (75.0% (Cho/ NAA), 72.3% (Cho/Cr).), 82.4% (NAA/Cr) for anaplastic cells of cerebral gliomas (I-II and III-IV ) in differential diagnosis.
2. Glioblastoma (grade IV) presented with the highest main metabolic ratio.
3. 3D MRS showed a high NAA/Cr correletion - sensitivity (85.7%) and specificity (75%) for anaplastic astrocytoma (grade III) and anaplastic oligodendroglioma (grade III) in differential diagnosis.
4. 3D MR spectroscopy showed low values of sensitivity and specificity for grade III and IV malignant gliomas in differential diagnosis.
5. Insignificant increase in the Cho/Cr ratio in healthy hemispheres of patients with both low grade and high grade malignant cerebral gliomas.
Acknowledgement
None.
Conflict of Interest
No Conflict of interest.
References
- David N Louis, Hiroko Ohgaki, Otmar D Wiestler, Webster K Cavenee, Peter C Burger, et al. (2007) The 2007 WHO classification of tumours of the central nervous system. Acta Neuropathologica 114(2): 97-109.
- V N Kornienko, IN Pronin (2009) Tonoyan V.N. Diagnostic neuroradiology. M IP T M Andreeva 3: 233.
- Podoprigora A (2002) Proton magnetic resonance spectroscopy in the diagnosis of volumetric diseases of the brain: autoref. dis. ... cand. med Nauk: 14.00.19. Podoprigora Aleksey Evgenievich. - M: 51p.
- Tonoyan A S (2018) Diffusion-coated magnetic resonance imaging: application in the diagnosis of glial brain tumors: autoref. dis. ... cand. honey Nauk: 14.01.13 / Tonoyan Aram Sergeevich- M: 41 p.
- A M Turkin, E L Pogosbekyan, A S Tonoyan (2017) Diffusion curtosis MRI in the assessment of peritumoral edema of glioblastomas and metastases to the brain. Problems of neurosurgery named after N. N. Burdenko 21(4) :97-112.
- A V Dalechina, M G Belyaev, A N Tyurina (2019) Methods of machine learning in the segmentation of gliomas for planning stereotactic radiation therapy. Radiation diagnostics and therapy 2: 24-31
- Khoruzhik S A (2007) Magnetic resonance spectroscopy in brain tumors (review of literature). Oncological Journal 3: 51-62.
- M B Dolgushin, I N Pronin, L M Fadeeva (2007) MB Method of CT-perfusion in the differential diagnosis of secondary tumor lesions of the brain. Med visualization 4: 100-106.
- V N Kornienko, I N Pronin (2008) Diagnostic neuroradiology. M IP T M Andreeva 1: 54 p.
- Bai James, Jerrin Varghese, and Rajan Jain (2020) "Adult glioma WHO classification update, genomics, and imaging: what the radiologists need to know." Topics in Magnetic Resonance Imaging 29(2): 71-82.
- W Moller-Hartmann, S. Herminghaus, T Krings (1961) W. L-aspartic acid formation prom N-acetyl-aspartic acid in the brain. Psychiatry Clin Neurosci 15(1): 4-9.
- Meng Law, Soonmee Cha, Edmond A Knopp, Glyn Johnson, John Arnett, et al. (2002) High-grade gliomas and solitary metastases: differentiation by using perfusion and proton spectroscopic MR imaging. Radiology 222(3): 715-721.
- D L Arnold, E A Shoubridge, J G Villemure, W Feindel (1990) Proton and phosphorus magnetic resonance spectroscopy of human astrocytomas in vivo. Preliminary observations on tumor grading. NMR Biomed 3(4): 184-189.
- P B Barker, J D Glickson, R N Bryan (1993) In vivo magnetic resonance spectroscopy of human brain tumors. Top Magn Reson Imaging 5(1): 32-45.
- P J Pouwels, J Frahm (1998) Regional metabolite concentrations in human brain as determined by quantitative localized proton MRS. Magn Reson Med 39(1): 53-60.
- N A Sibtain, F A Howe, D E Saunders (2007) The clinical value of proton magnetic resonance pectroscopy in adult brain tumours. Clinical Radiol 62(2): 109-119.
- R A Komoroski, C Heimberg, D Cardwell, C N Karson (1999) Effects of gender and region on proton MRS of normal human brain. Magnetic Resonance Imaging 17(3): 427-433.
- Gaurav Verma, Sanjeev Chawla, Suyash Mohan, Sumei Wang, MacLean Nasrallah, et al. (2019) "Three‐dimensional echo planar spectroscopic imaging for differentiation of true progression from pseudoprogression in patients with glioblastoma." NMR in Biomedicine 32(2): e4042.
- Belinda S Y Li, Hao Wang, Oded Gonen (2003) Metabolite ratios to assumed stable creatine level may confound the quantification of proton brain MR spectroscopy. Magnetic Resonance Imaging 21(8): 923-928.
- Chikkathur N Madhavarao, Aryan M A Namboodiri (2006) NAA synthesis and functional roles. New York: Springer Science + Business Media 60: 49-66.
- John R Moffett, Brian Ross, Peethambaran Arun, Chikkathur N Madhavarao, Aryan M A Namboodiri (2007) N-acetylaspartate in the CNS: from neurodiagnostics to neurobiology. Progress in Neurobiology 81(2): 89-131.
- J H Neale, T Bzdega, B Wroblewska (2000) N-acetylaspartylglutamate: the most abundant peptide neurotransmitter in the mammalian central nervous system. Journal of Neurochemistry 75(2): 443- 452.
- W Moller Hartmann, S Herminghaus, T Krings, H Lanfermann, U Pilatus, et al. (2002) Clinical application of proton magnetic resonance spectroscopy in the diagnosis of intracranial mass lesions. Neuroradiology 44(5): 371-81.
- K E Warren, J A Frank, J L Black, R S Hill, J H Duyn, et al. (2000) Proton magnetic resonance spectroscopic imaging in children with recurrent primary brain tumors. Journal of Clinical Oncology: Official Journal of the American Society of Clinical Oncology 18(5): 1020-1026.
- D P Soares, M Law (2009) Magnetic resonance spectroscopy of the brain: review of metabolites and clinical applications. Clinical Radiology 64(1): 12-21.
- R Hernandez-Alcoceba, L Saniger, J Campos, M C Nunez, F Khaless, et al. (1997) Choline kinase inhibitors as a novel approach for antiproliferative drug design. Oncogene 15(19): 2289-2301.
- Y Wang, S J Li (1998) Differentiation of metabolic concentrations between gray matter and white matter of human brain by in vivo 1H magnetic resonance spectroscopy. Magnetic Resonance in Medicine 39(1): 28-33.
- T Scholzen, J Gerdes (2000) The Ki-67 protein: from the known and the unknown. Journal of Cellular Physiology 182(3): 311- 322.
- H Shimizu, T Kumabe, R Shirane, T Yoshimoto (2000) Correlation between choline level measured by proton MR spectroscopy and Ki-67 labeling index in gliomas. AJNR: American Journal of Neuroradiology 21(4): 659-665.
- Bowen B C (2003) Glial neoplasms without elevated choline-creatine ratios. AJNR: American Journal of Neuroradiology 24(5): 782-784.
- M Wyss, R Kaddurah-Daouk (2000) Creatine and creatinine metabolism. Physiological Reviews 80(3): 1107-1213.
- J Urenjak, S R Williams, D G Gadian, M Noble (1992) Specific expression of N-acetylaspartate in neurons, oligodendrocyte-type-2 astrocyte progenitors, and immature oligodendrocytes in vitro. Journal of Neurochemistry 59(1): 55-61.
- O H Lowry, S J Berger, J G Carter, M M Chi, J K Manchester, et al. (1983) Diversity of metabolic patterns in human brain tumors: enzymes of energy metabolism and related metabolites and cofactors. Journal of Neurochemistry 41(4): 994-1010.
-
Irakli Gakhokidze*, Ketevan Tavadze, Mirza Khinikadze, Nikoloz Sainishvili and Koka Gogichashvili. The Role of Three-Dimensional Magnetic Resonance Spectroscopy in Diagnosing and Grading of Gliomas. 14(4): 2023. ANN.MS.ID.000842.
-
Spectroscopy, Gliomas, Neurosurgeon, Radiologist, Radiology, brain tumor, Radiodiagnosis.
-

This work is licensed under a Creative Commons Attribution-NonCommercial 4.0 International License.


