 Research Article
Simulation On Effect of Blast-Induced Ground Vibrations for Overburden Dump Stability
M Ajay Kumar1, Bhanwar Singh Choudhary2 and Mohammed Sazid 3*
1Department of Mining Engineering, IIT(ISM) Dhanbad, India
2Department of Mining Engineering, IIT(ISM) Dhanbad, India
3Department of Mining Engineering, King Abdulaziz University, Saudi Arabia
Mohammed Sazid, Department of Mining Engineering, King Abdulaziz University, Saudi Arabia.
Received Date: March 14, 2023; Published Date: April 03, 2023
Abstract
Blasting is a typical practice in opencast coal mines that causes substantial ground vibration around the blasting region. The effect of vibration must be considered primarily if the waste dump is located close to the seismic loading source. The objective of this research is to analyze the influence of blast-induced vibrations on dump slope stability using Finite Element (FE) method in order to suggest economical and safe dump designs in the studied region. In the bench blasting, maximum vibration observed near the overburden dump was 30mm/s with a prominent peak frequency of 60Hz for a duration of 0.5 seconds. All the collected field data was used in the Rocscience software to determine the stability of dump slope. Initially, the factor of safety of dump slope was observed at 34° and above, which has shown unstable even in the static condition. In the dynamic condition analysis, the maximum displacement has been seen at crest and mid-point of the slope as compared to toe of the slope due to angle of slope and duration of vibration. After using the same blast vibration data for an assumed one-year duration. The maximum displacement observed at slope angle of 34° and least displacement at 29°. Also, mine management has been recommended to keep away HEMM from the dump slope edges and maintain slope angle at 29° or below for safety of the mine.
Keywords: Ground vibration; Dump slope stability; Factor of safety; Finite element method; Dynamic analysis
Introduction
The demand for coal has increased in recent years, both for industrial and domestic purposes. According to the Coal India Limited [1] the production of coal in the year 2018 was 567.36Mt which increased to 622.6Mt in year 2022, approx. 9% increase in last four years. It shows that the percentage of coal production from opencast mining is increasing day by day. The volume of overburden material in and near mining zones has also increased, which directly creates risk for dump slopes. The disposal of large volumes of overburden material is one of the key difficulties in opencast mining. The storage of overburden material should be done keeping in mind the risk of failures and associated injuries to people and machines. The unplanned dumping of overburden material has caused watercourse disruption, stream contamination, slope stability challenges, and other problems [2- 4]. In India, dump failure has happened on a few instances, causing significant damage to mining assets, fatality, and production halting as a result of ground vibration caused by improper blasting [5]. A recent dump failure happened at the Bharatpur OCP (MCL) 2019, Odisha. The incident was presumably triggered by blast-induced ground vibration; causing the overburden dump failure and buried numerous workers and equipment, which killed four miners and ten were injured [6].
This research describes the analysis of the dynamic response of the overburden dump caused by the blasting operation. Surface mines need blasting to break medium to hard rocks. Approximately 20–30% of the explosive energy employed in a blasting operation is utilized for rock fragmentation. The rest energy is converted into ground and air vibration and, flyrock, noise, and back-break [7].
Ground vibration is a serious ill effect of blasting activities, and additional safeguards have been put in place to protect surrounding structures. The peak particle velocity determines the majority of these principles. The maximum amount of explosive per delay and distance from the explosion site are the two important properties in limiting the ground vibration. Using a dynamic analytical method, this research investigates the influence of frequent explosions in a normal mining operation on the stability of a typical mine slope. Several research have shown the significance of mine slope in dynamic analysis [8-12]. Terzaghi [8] was a pioneer in the study of the effects of seismic motion on slope stability, and numerous methods for measuring slope stability under seismic loading have since been presented. Pseudo-static analysis, Newmark displacement analysis [13], and dynamic numerical analysis are the principal methodologies for examining slope stability under seismic conditions [14-15]. Ground vibrations are an unavoidable yet unpleasant by-product of opencast blasting operations. The vibration energy that extends beyond the zone of rock breaking is wasted and may cause damage to the waste dump as well as irritation to residents near the mines [16-18]. Etiz [19] reported the impact of heavy rain on the slope stability with 2D-LEM, 2D-FEM and 3D-FEM. For large mining slopes subjected to complex seismic stresses, dynamic numerical analysis is recommended. The aim of this study is to look at the stability of a dump slope under dynamic load in Gondudih Khas Kusunda Colliery (BCCL). Finite difference or finite element method is widely used for this type of study [20- 22].
In this research, the slope has been modelled using twodimensional Finite Element Method (FEM) under static loading conditions to investigate the FOS for different dump slope angles for similar material parameters. Possible adverse effects due to blasting seismic events on the slope were analysed by twodimensional model (FEM) through Stress-deformation analysis. In FEM, the earth materials continuum is divided into discrete pieces known as “finite elements,” as seen [Figure 1].
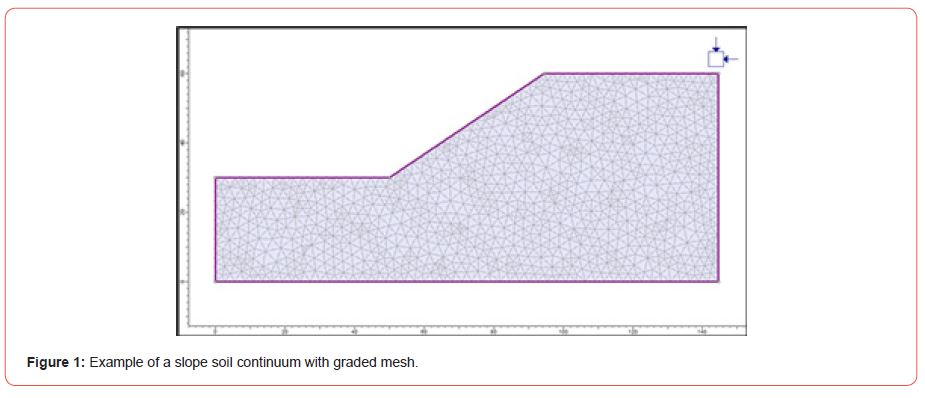
For Finite Element rock/soil slope stability program, following data required [23]:
• An appropriate constitutive model.
• Availability of different types of meshes.
• Material qualities relevant to field and laboratory testing.
RS2 creates finite element meshes in the modelling. All different materials boundaries should defined at the first stages, like external boundaries, material and groundwater boundaries. Define and assign the different materials with mechanical properties. The mesh size and types should be followed after that. External load and restraints and support should applied in external and internal nodes of the model, respectively. The output results of stresses and displacement of model can be obtained through run the program by applying shear strength reduction (SSR) technique. This component equals the factor of safety of the slope [24].
Locality And Monitoring Details
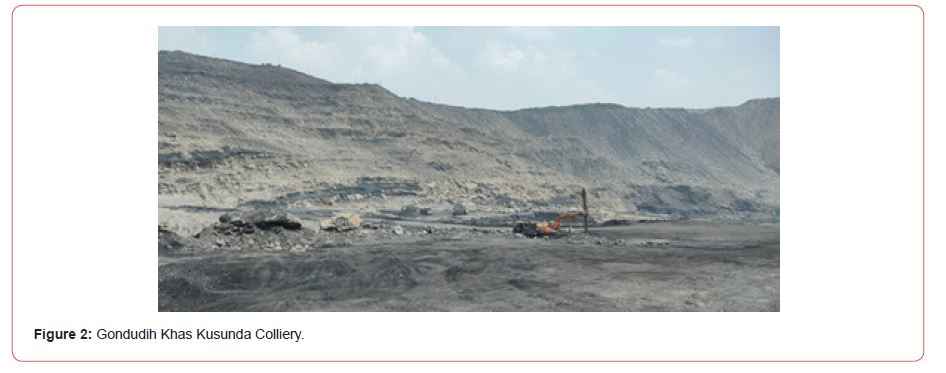
Gondudih Khas Kusunda Colliery of M/S BCCL is located about 1.75km south-east of Kusunda Railway station (Dhanbad), coal is mined, and overburden is dumped within the mine boundary directly on dumping area, which is around 200-400 m from the blast face. The mine is worked with mechanized open pit method using HEMM with deep hole blasting and using more than one type of explosive. The image of mine as shown [Figure 2].
Salient features of the overburden dump
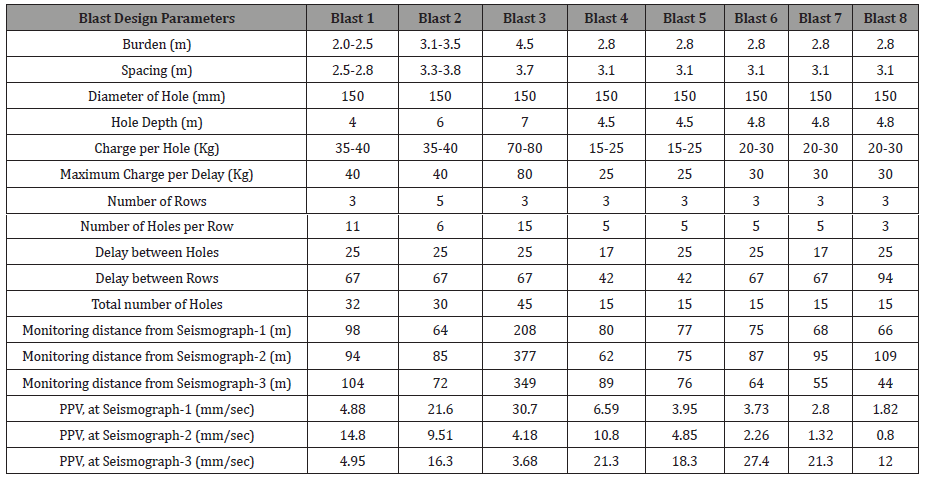
In this mine, the overburden dump height is ranging from 20- 30 m and dump slope angle is from 25°-29° and the same were used in the analysis. Blasting was done with Site Mix Emulsions (SME) explosives and cast booster/cartridge booster. The circuit was detonated from a safe blasting shelter utilizing electric delay detonators, electronic detonators, and an exploder. In blasting operation, blast parameters and ground vibration data were collected as shown. Engineering seismographs were used (Mini- Seis III) for monitoring of ground vibration as given [Figure 3]. A total of fifteen blast vibration data were collected and the details of the recorded PPV more than 10mm/sec (8 blasts) were noted, as provided [Table 1].
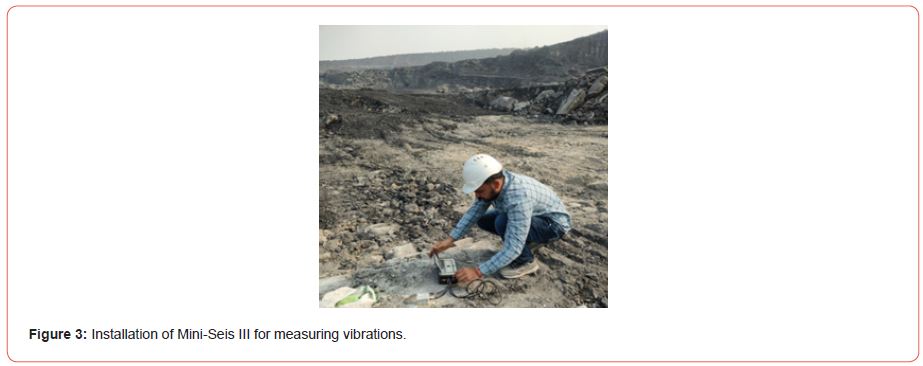
Table 1: Ground vibration data from production blasting.
Laboratory Investigations
Overburden samples were collected from several dump locations for the laboratory investigations. The physic-mechanical properties of the overburden dump material were calculated to serve as input parameters for FE model, such as optimum moisture content, dry density, cohesion, and internal angle of friction etc., as mentioned below.
Standard proctor hammer test (ASTM D698)
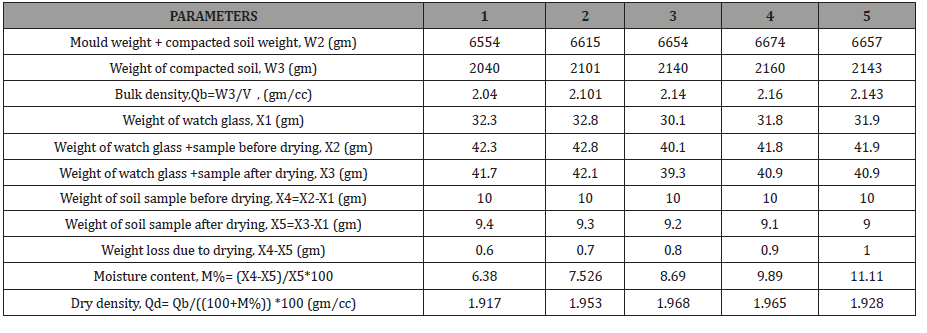
This test identifies the optimal amount of water to mix with the soil to achieve maximum compaction effort. Maximum compaction results obtained in maximum dry density, which maximizes soil deformation and strength. The observation of standard proctor hammer test shown [Table 2] and the plot between dry density and moisture content shown [Figure 4].
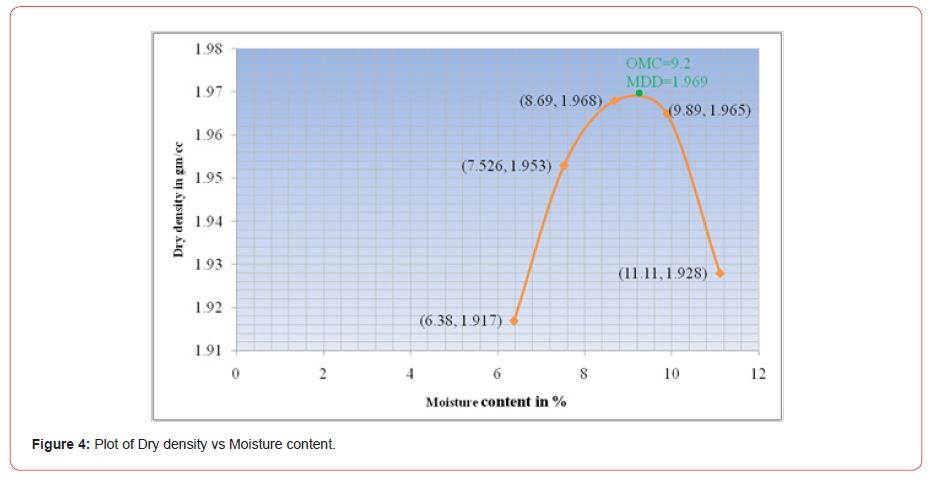
Table 2: Observations of Standard Proctor Hammer Test.
Observations
Weight of sample taken for test : W=5000 (gm)
Weight of an empty mould : W1=4514 (gm)
Internal diameter of the mould : D=10 (cm)
Height of the mould : H=12.73 (cm)
Mould volume : V=1000 (cm3)
describes the compaction curve for optimum moisture content and maximum dry density. The soil’s maximum dry density is 1.969 gm/cc, and its optimal moisture content is 9.2 percent. These results were used in a direct shear test for sample preparation.
Direct shear test on soil (consolidated un-drained test)
This test provided angle of internal friction, cohesion and normal strength in failure plane which help to calculate the shear strength by the Mohr-Coulomb expression, which is
S = C + σn tan 𝛳,
Where, S-shear strength, σn-normal strength in failure plane, C-cohesion, and 𝛳-angle of internal friction.
Apparatus used
Shear box, shear box container, shear box the upper surface of the base plate has cross grooves, 2 grid plates, 6mm thick, porous stones 2 pieces., loading yoke, loading pad, loading frame weights for standard loads, demonstrating ring-force measurement of shear force, Dial gauges are used to quantify horizontal movement and vertical compression of the specimen. A sample trimmer or core cutter, a balance, a spatula, and a straight edge are all required.
Procedure

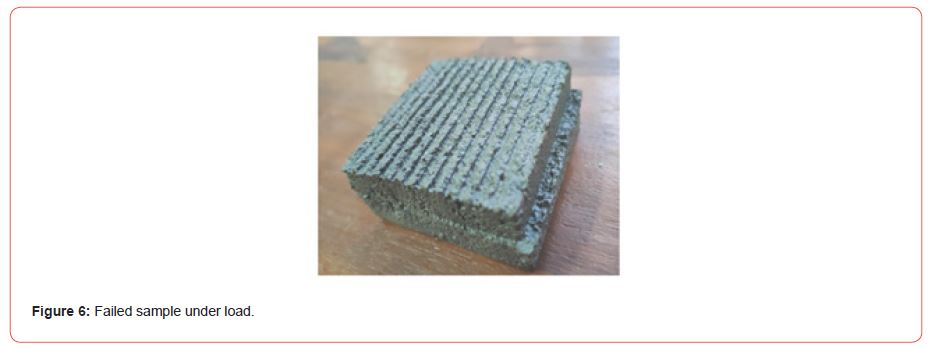
Table 3: Direct shear test observations.

Used the known dimensions of the shear box and the mass of the material. At the ideal moisture level, water was added to the right amount of sample in a tray. The mixture was well blended. When the shear box was created, the shearing pins were installed. The shear box received three layers of material (with tight packing by hammer pressing, if necessary). After the top plates were connected to the shear box, it was transferred to the loading frame as shown in [Figure 5 and 6]. The dial gauges were reset to zero, and the weights were secured to the loading frame. The machine was turned on, and readings from the proving ring were taken until the sample failed. The test was carried out for various weights (normal stress) and the results were documented. The direct shear test observation is detailed [Table 3].
Observations
Dimensions of the mould:
Area of the mould (A) = 6cm×6cm= 36cm2
Height of the mould (H) = 2.5cm
Volume of the mould (V) =A×H=90 cm3
Sample preparation:
Optimum moisture content of the soil from compaction test is OMC= 9.2 %.
Maximum dry density of the soil in gm/cc is MDD= 1.969
Weight of the soil sample to be taken (W1) =MDD × volume of the mould (V) =1.969×90=177.21gms
Amount of water added (W2) = W1× OMC = 177.21gm×9.2%= 16.30 gm. or ml
Actual weight of the soil sample taken for the test (W3) = (W1) - (W2)
=177.21-16.30=160.91gm
Area correction AN=AO × (1- δ/6)
A graph [Figure 7] was plotted between normal stress vs shear stress to find the cohesion and angle of internal friction of the dump soil samples. The results are very essential for modelling the dump slope with Rocscience RS2 programme.
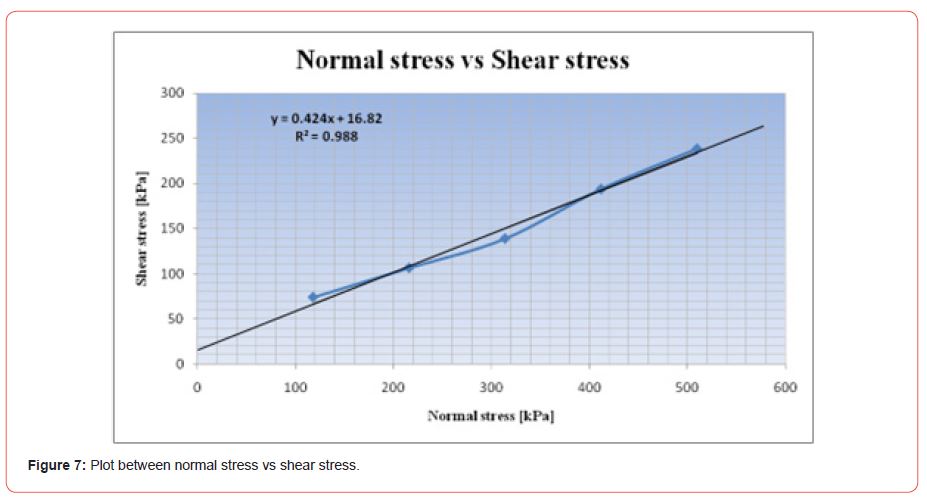
From the [Figure 7] the following results were obtained:
• Cohesion C = y intercept of the line= 17 kPa
• Internal Friction Angle 𝛳= the line’s slope = tan-1 (0.4249) =23°
Results And Discussion
Static analysis of the dump slope
Two-Dimensional Finite Element Model
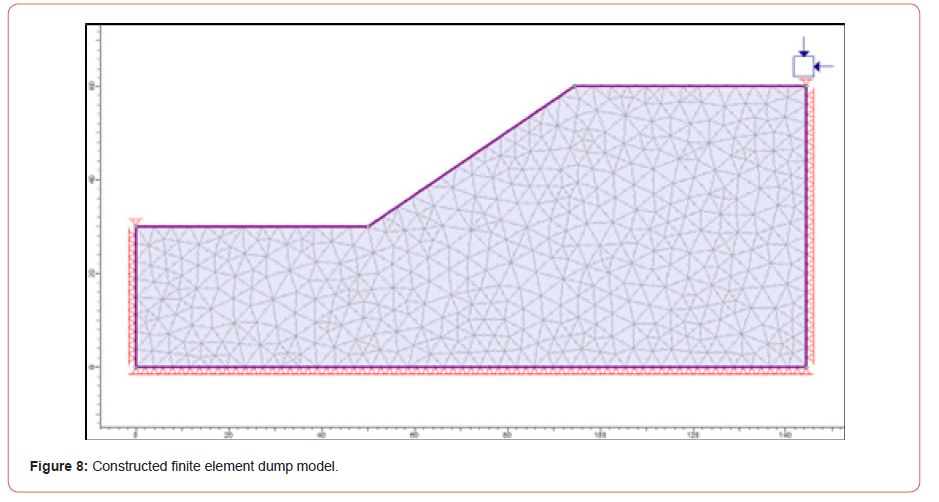
The FE model was constructed by define proper boundary conditions and optimum required meshing for FE analysis. Usually keeps uniform mess, and the element is a six-noded triangle [Figure 8]. The output of the program obtained the lowest strength reduction factor within the model.
The laboratory test results were used as input parameters for the FE model.
Cohesion, c = 17 kPa, Unit weight γ =21.50 kN/m3, and Internal friction angle, ϕ =23°.
Young modulus, Poisson’s Ratio and dilation angle were also used as additional input parameters which based on the Mohr- Coulomb failure criteria. The shear strength values listed above were employed in FEM studies, whereas the other three parameters were 80 MPa for Young’s modulus, 0.40 for Poisson’s ratio, and zero for dilation angle.
In RS2, the model should differentiate the dry and saturated zones if two materials having different unit weights. But, here in our entire analysis only a single layer with the same material properties has been used for different slope angles. The hydraulic properties were assigned to the model as: drained for Material property; 0.5 as porosity value and static water mode rho as zero.
Two-Dimensional Finite Element Analyses
The factor of safety (FOS) for various dump slope angles was calculated using the shear strength reduction approach. The dump slope angle at which the slope becomes stable (FOS>1) is determined in this research, and the results are employed in later dynamic experiments.
Slope angles used for FOS analysis are: 45°, 40°, 37.5°, 34°, 30°, 29°, 28°, 27°, 25°, and 23°. According to various studies, overburden material cannot generate slope angles larger than 45°. So, FOS analysis of dump slope at 450, 340 and 230 using FEM as shown [Figure 9, 10 and 11].
[Figure 9] represents the critical strength reduction factor (FOS) for 45° slope is 0.79, indicating that the dump slope is unstable at angles of 45° and above and cannot be used for further study.
[Figure 10] represents the critical strength reduction factor (FOS) for 34° slope is 1.03, indicating that the dump slope is stable at angles of 34° and below and can be used for further study.
[Figure 11] represents the critical strength reduction factor (FOS) for 23° slope is 1.45, indicating that the dump slope is very stable at this angle and can be used for further study.
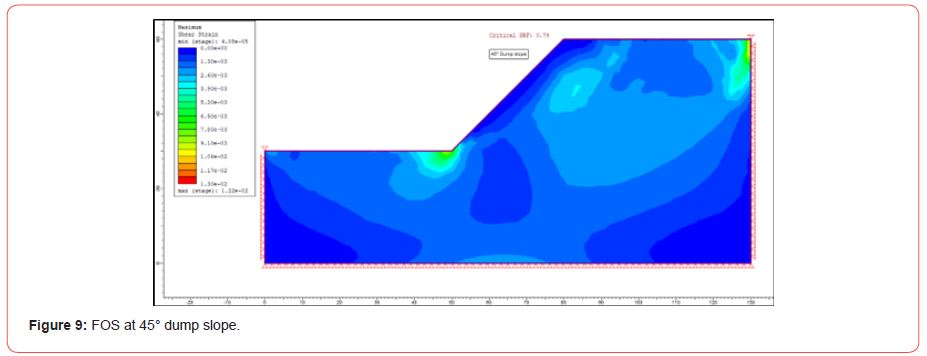
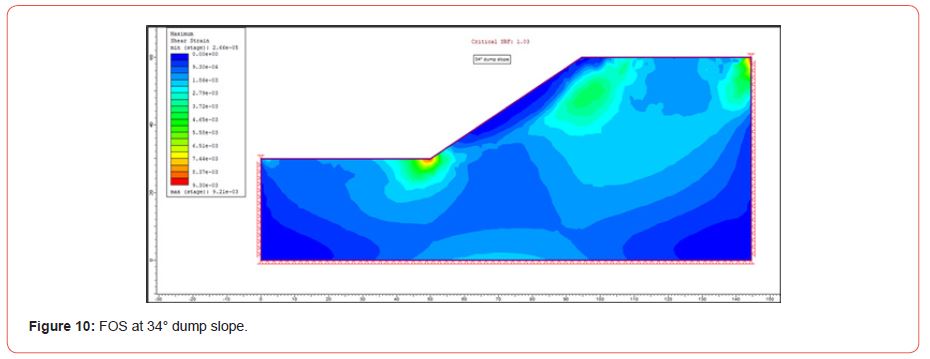
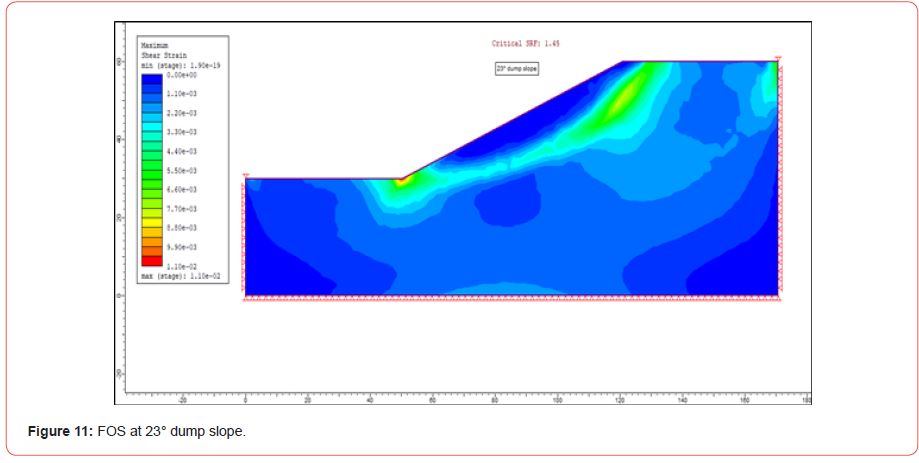
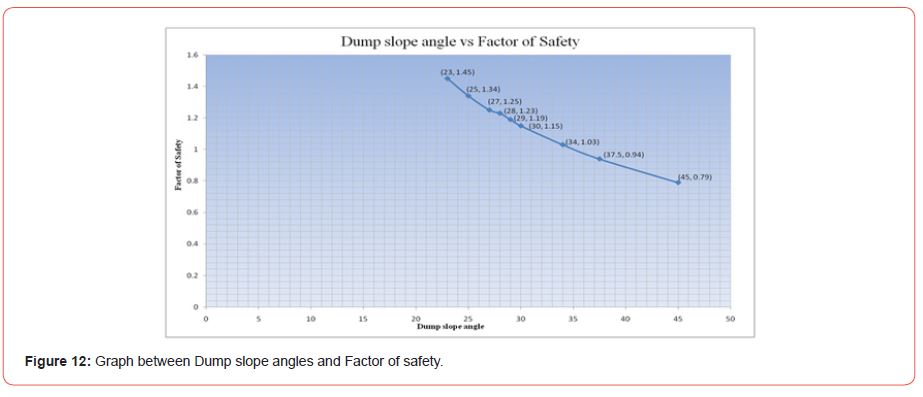
The FOS analysis can be stopped here since reducing the slope angle below this limits dump capacity and renders it economically unfeasible to dump overburden. The same study was carried out for the other angles, and the findings are shown [Figure 12]. clearly indicates that the slope’s safety factor diminishes as the angle of the dump slope increases. At a slope angle of 34°, the FOS is 1.03; above this angle, the dump cannot be stable and cannot be used for further dynamic analysis. Based on the above research, the slope angles greater than 340 cannot be used for dynamic analysis but can continue with the analysis using slope angles less than or equal to 340 to produce relevant results.
Dynamic analyses of the dump slope
In dynamic analyses, investigated the potential effects on the dump slope from rock blasting seismic events.
Dump slope Stability assessment under seismic loading (blasting)
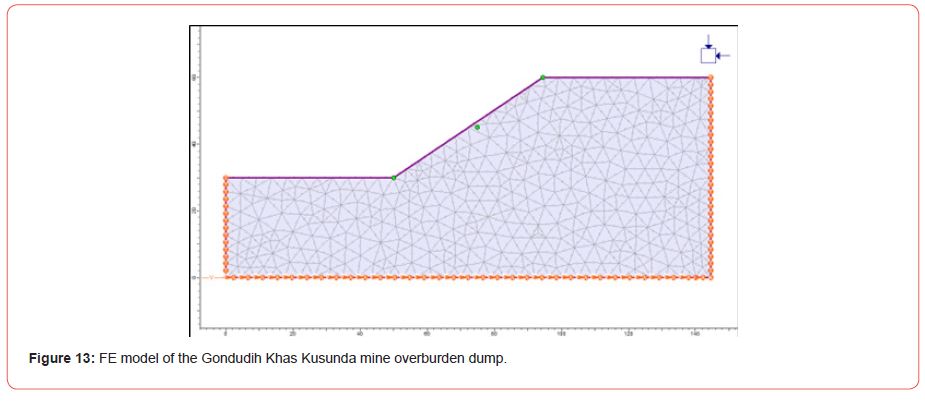
[Figure 13] depicts the modelling of the Gondudih Khas Kusunda mine overburden dump. The RS2 (previously Phase2) finite element analysis may be used for a variety of engineering applications, including complicated dynamic slope analysis.
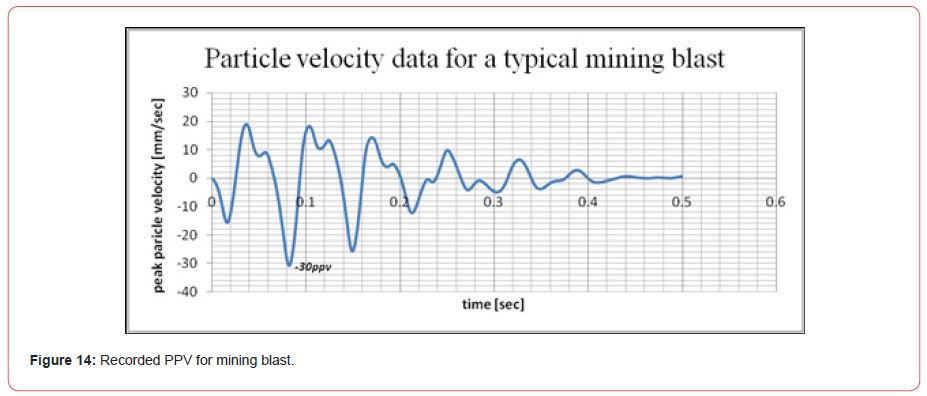
This model has 1500 triangular six-node components. The failure criteria for the medium were based on the Mohr-Coulomb strain-softening model. The lateral and bottom sides of the slope model shown [Figure 13] are artificial limitations meant to replicate the earth medium’s infinite boundary effect. The lateral sides of the model were chosen as the transmit boundary, permitting inward waves in while captivating shear and pressure waves. The bottom of the model was recognized as a captivate boundary type, which captivates the system’s outgoing wave. The one of the blasts recorded Peak Particle Velocity (PPV) shown [Figure 14].
An acceleration-time record/velocity-time (PPV) of blasting required for dynamic study of slope. [Figure 14] depicts a 0.5 sec record with a maximum absolute value of 30mm/sec. The following three procedures should be performed before doing a dynamic numerical analysis [24].
Step 1: Deconvolution of seismic input.
Seismic input in the form of velocity data applied to the model’s base rather than the Earth’s surface is required for an RS2 analysis. As a result, ‘deconvolution’ of the provided data is required to appropriately reproduce ground motion when applied at the model’s base.
The following stages are involved in the refining of the acceptable velocity-time history given a conforming base model:
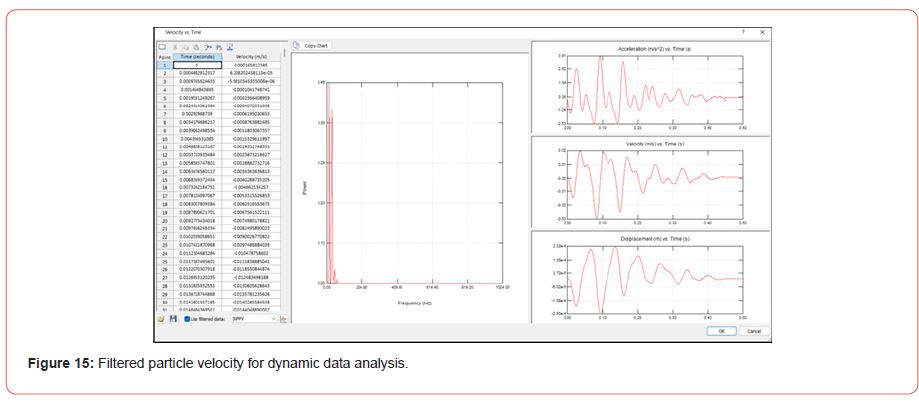
The velocity data is split into two halves. An upward propagating wave train should use in obedient basic model. The outcrop motion is represented as an upward-propagating wave [25]. The velocity data used in RS2 in m/sec is transformed to a required stress wave and then used in the slope model, as illustrated [Figure 15].
Step 2: Filtering the seismic loading as input velocity
The frequency of the input wave and the speed of system’s wave have great impact on numerical accuracy of wave transmission during seismic modelling. For proper wave transmission modelling inside a model [26], the spatial element size should be:
Element size ≤ (λ)/10
Where, λ is the wavelength of the highest frequency component that carries considerable energy.
very fine mesh may be required to fulfil equation, leading in an excessively lengthy processing time. Fortunately, the majority of seismic events transmit the powerful component of the input velocity in inferior places [26]. A coarser mesh may be applied without altering the outputs much by filtering the input wave and removing high-frequency components. The filter frequency of the chosen seismic event was set to 60Hz, and frequencies above this value were removed from the dynamic analysis.
Step 3: Rayleigh damping
In this study, the Rayleigh constants were alpha (α) = 0.5 and beta (β) = 0.0011.
After completion of the above steps, a dynamic assessment of the mining slope was performed by utilizing the received blast velocity data. The results are presented in the sections that follow.
Results of the dynamic analysis
The static study shows that the slope is unstable above 34° slope angle, thus considered the maximum slope angle for the seismic analysis.
Effect of single blasting on dump slope
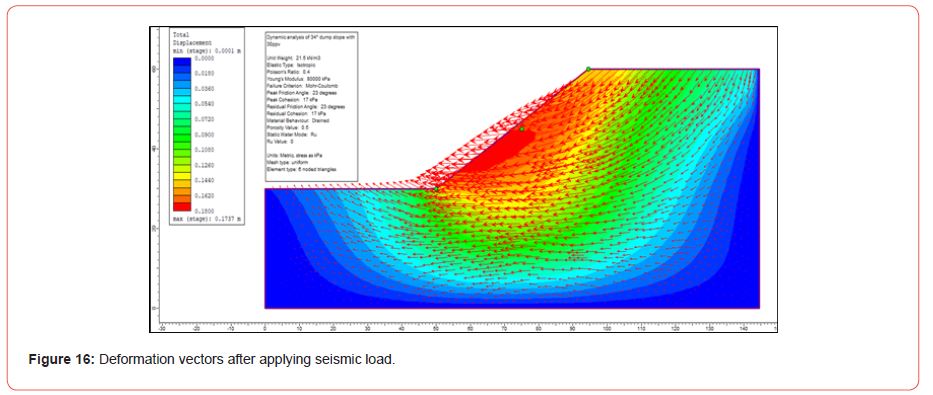
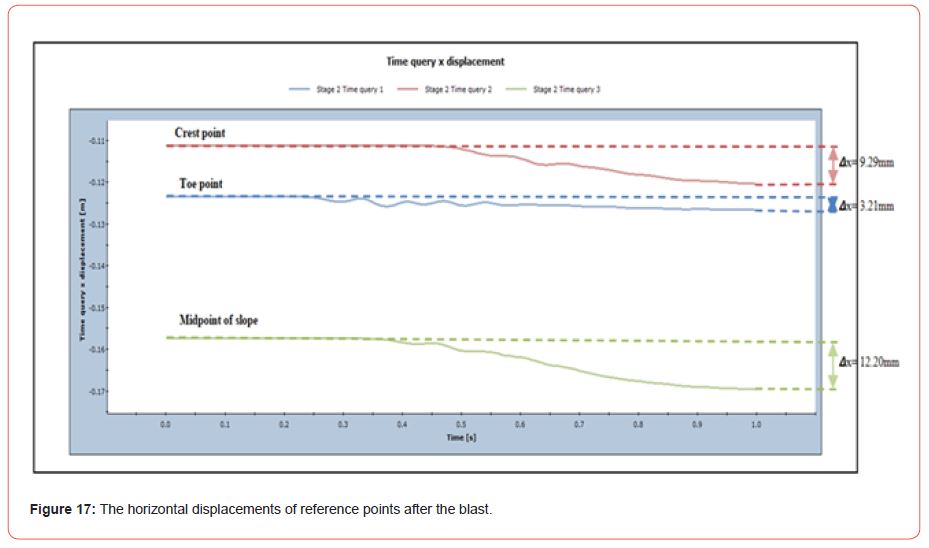
Mine has a large amount of OB to be handled to excavate coal. As a result, this mine typically conducted more than one explosion every day. In this study after considering more than one blast per day with a max. seismic effect on the dump is one second each day. The seismic effect on due to dump slope angle shown [Figure 16]. Representing the motion of the deformation vectors of the dump slope with one second duration. The same effect can be observed due to seismic load on the slope of the dump. Here, three points were considered on the dump slope to analyse the effect of blasting as shown [Figure 17].
The finite element model of the dump slope was tested under the loading impact of a single explosion. The displacement of three points on the dump slope throughout the loading progression of a single day blast is depicted [Figure 17]. The crest point is moved by 9.29 mm, the toe point is displaced by 3.21mm, and the mid reference point of the slope is displaced by 12.2mm.
The toe point, placed at the foot of the dump slope, seen least amount of movement from the blast, but two other locations, located in the middle and crest of the slope, seen significant movement. The point near the center of the slope has the greatest displacement. The significant difference in movement between the crest and the center of the slope demonstrates the catastrophic effect of blasting on the dump slope.
Impact of dump slope due to repeated blasting
Due to repeated blasting, seismic waves cause larger effect on dump slop stability as [Figure 18]. The ground vibration caused by each blast raised the chance of deformation in the dump slope. Identifying the dump slope displacement is critical in the research of slope stability. While a single destabilizing explosion has little effect, daily blasts can have a significant impact. The motion of the dump slope crest, toe, and midpoint of slope after 730 blasts (365sec seismic duration), an estimate for one year of mining, is depicted [Figure 18]. Interesting findings are produced when the motion values of reference points are compared (i.e., single and one year). The toe point varies less than the other two points in all conditions, demonstrating that single or repeated blasts in mining operations have minimal influence on the slope’s toe point. After a year of blasting, the slope’s top and midpoint showed substantial progressive displacement towards the pit. This means that in the mining operations, blast-induced ground vibrations may have an influence on the slope, resulting in a major dump slope collapse.
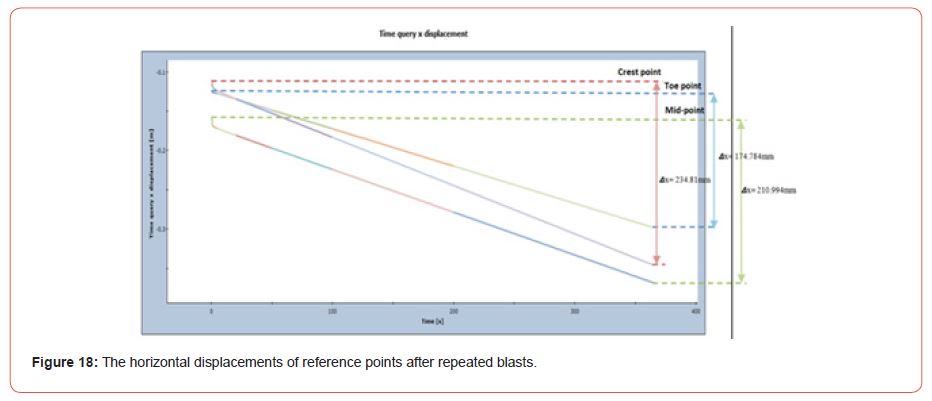
Table 4: Stage number and corresponding time in sec.

The previous analysis demonstrated the influence of blastinduced ground vibration on a 34° slope angle. The same study was carried out by varying the dump slope angle according to [Table 4].
The graphs in the appendix (A1 to A6) show that, regardless of the slope angle, the total displacement increases as the duration of the seismic load increases. [Figure 19] represents the composite graph between total displacement and dump slope angle in dynamic condition. As illustrated the total displacement is minimal after one year of dynamic loads at slope angles 28° and 29°. Which means the dump slope is stable and minimal effect due to vibration at these slope angles. It is more accurate and reliable after comparing the results with static conditions as detailed [Table 5] and [Figure 20].
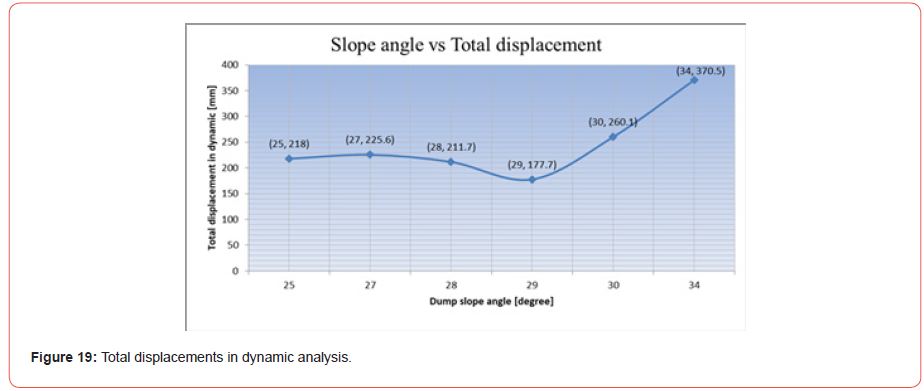
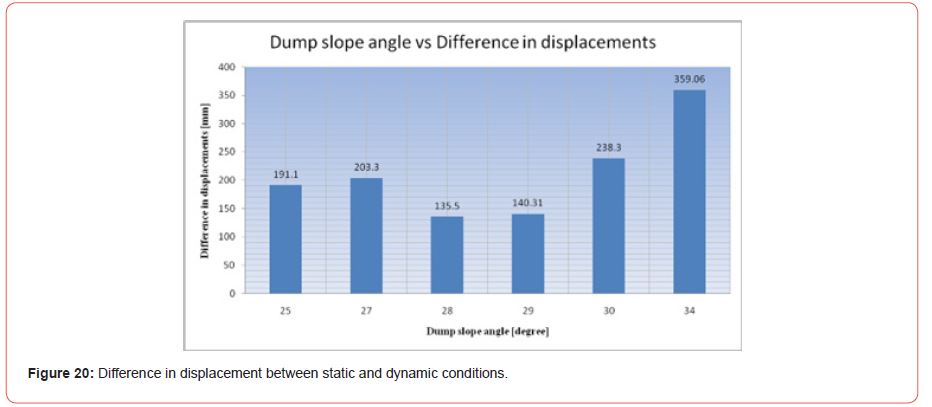
Table 5: Difference in displacement under static and dynamic conditions.

According to the results of the experiment, steeper slope angles are more prone to deformation and have a larger possibility of failing due to vibrations. It is also true that slope angles more than 29° are more prone to deformation due to vibrations. [Figure 20] clearly demonstrates that at 28° and 29° slope angle difference in total displacements between static and dynamic analysis is minimum. This is also true in the case of individual dynamic displacements. Because it is not practical to form slope angles at these specific slopes, the slope angle in between 25°-30° across a large range. In this range, displacements are at their lowest.
Conclusion and Future Scope of Work
Conclusion
• In the Finite Element Model of a mine dump slope under static conditions, it was noticed that the Factor of Safety of the dump decreases as the slope angle increases. At 34° and below slope angles, the dump’s FOS is more significant than one, which indicates that the overburden dump is stable below 34° slope angle under static conditions.
• Seismic effects of a single mine blast were initially modelled at 34° slope angles and observed a maximum horizontal displacement of 12.2mm at the midpoint of the slope. Although each shot causes insignificant displacement in the mine dump slope, the effects grow remarkably with the frequent explosions. After repeated blasting for one year, a maximum change in horizontal displacement of 234.81mm was observed at the crest of the dump slope, which causes instability in the dump slope.
• The FEM model of mine dump slope was modelled with different slope angles to know the effect of blasting on each slope, and as the slope angle increases, there is a significant increase in displacement. The most considerable displacement difference is 359.06mm at 34°, and a slight difference is seen for slope angles below 30°, showing that blasting has a slight effect on slope angles below 30°.
• It is recommended that the mine management has to keep the HEMM and other equipment away from the dump slope edges to avoid crest failure. And also recommended to maintain slope angle at 29° or below for safety and economic point of view.
Future scope of work
• When designing a blasting pattern, the amount of explosive used per delay should be calculated so that the blast-induced vibration does not create permanent displacement in the overburdened dump slopes. However, the impact of numerous explosions on the dump slope should not be underestimated.
• Apart from blast-induced ground vibration, many other factors cause instability in the dump slope, such as cohesion, angle of internal friction, rainfall, and groundwater. A comprehensive numerical analysis is recommended in each circumstance, almost identical to the one illustrated above.
Data Availability
The data used to support the findings of this study are included within the article.
Appendix
The following results were obtained after doing a dynamic analysis on each slope angle with the same material parameters and seismic inputs.
Acknowledgement
None.
Conflicts of Interest
No conflict of interest.
References
- Marrow NR, Ma S (1996) Relationship between porosity and permeability for porous rocks. International Symposium of The Society of Core Analysts, pp 9610.
- Lo HY, Mungan N (1973) The effect of temperature on water-oil relative permeabilities in oil-wet and water-wet systems. Society of Petroleum Engineers of AIME Journal, Pp 4505.
- Al Bazali TM (2003) Membrane Efficiency Behavior in Shales (Doctoral dissertation).
- Al Bazali (2009) Estimating the reservoir hydrocarbon capacity through measurement of the minimum capillary entry pressure of shale caprocks. SPE Annual Technical Conference and Exhibition.
- Al Bazali (2009) Wellbore instability of directional wells in laminated and naturally fractured shales. Journal of Porous Media 12(2).
- Nattavadee S, Mavko G (2017) The revised kozeny-carman equation: A practical way to improve permeability prediction in the kozeny-carman equation through pore-size distribution. SEG International Exposition, pp. 17750852.
- Zhang (2004) A new gravimetric-swelling test for evaluating water and ion uptake of shales. SPE Annual Technical Conference and Exhibition, pp. 26-29.
- Afinogenov YA (1969) How the liquid permeability of rocks is effected by pressure and temperature. SNIIGIMS 6(1): 33-42.
- Bukunmi Akinwunmi, Linlin Sun, Janne T Hirvi, Seppo Kasa, Tapani A Pakkanen (2019) Influence of temperature on the swelling pressure of bentonite clay. Chemical Physics 516: 177-181.
- Al Bazali (2022) On CO2 sequestration: Changes in CO2 entry pressure and adsorption capacity by heat. Journal of Porous Media 25(4): 77-93.
- Benson, Cole (2008) CO2 sequestration in deep sedimentary formations. Elements 4(5): 325-331.
- Bobek JE, Mattax CC, Denekas MO (1958) Reservoir rock wettability: Its significance and evaluation. Society of Petroleum Engineers Journal 213(1): 155-160.
- Boosari (2015) Carbon dioxide storage and sequestration in unconventional shale reservoirs. Journal of Geoscience and Environment Protection 3(1): 7-15.
- Brannan GO, Gonten WDV (1973) The effect of temperature on the formation resistivity factor of porous media. Society of Professional Well Log Analysts Annual Symposium, Pp 14.
- Bruining, Plug (2007) Capillary pressure for the sand-CO2-water system under various pressure conditions. Application to CO2 Advances in Water Resources 30(11): 2339-2353.
- Civan F (2003) Leaky tube permeability Model for identification, characterization, and calibration of reservoir flow units. SPE Annual Technical Conference and Exhibition, pp. 84603.
- Denekas MO, Mattax CC, Davis GT (1959) The effects of crude oil components on rock wettability. Society of Petroleum Engineers of AIME Journal 216(1): 330-333.v
- Valentina Favero, Lyesse Laloui (2018) Impact of CO2 injection on the hydro-mechanical behaviour of a clay-rich caprock. International Journal of Greenhouse Gas Control 71: 133-141.
- Gonten WDV, Choudhary BK (1969) The effect of pressure and temperature on pore volume compressibility. Society of Petroleum Engineers of AIME Journal, pp. 2526.
- Katz A J & Thompson A H (1986) Quantitative prediction of permeability in porous rocks. Physical Review B 34(11): 8179-8181.
- Koponen A, Kataja M, Timonen J (1997) Permeability and effective porosity of porous media. Physical Review E 56: 3319-3325.
- Ronny Pini, Samuel CM Krevor, Sally M Benson (2012) Capillary pressure and heterogeneity for the CO2/water system in sandstone rocks at reservoir conditions. Advances in Water Resources 38: 48-59.
- Mathias (2014) Heat transport and pressure buildup during carbon dioxide injection into depleted gas reservoirs. Journal of Fluid Mechanics 756: 89-109.
- Okasha (2006) Investigation of the Effect of Temperature and Pressure on Interfacial Tension and Wettability of Shuaiba reservoir. Saudi Arabia, pp 3929.
- Poston SW, Y srael S, Hossain AKMS, Montogomery EF, Ramey HJ, et al. (1970) The effect of temperature on irreducible water saturation and relative permeability of unconsolidated sands. Society of Petroleum Engineers Journal 10(2): 171-180.
- Ramey HJ, Chang SK, Marsden SS (1973) The effect of temperature on capillary pressure properties of rocks. Society of Professional Well Log Analysts Annual Symposium, pp. 14.
- Mohammad Sarmadivaleh , Ahmed Z Al Yaseri, Stefan Iglauer (2015) Influence of temperature and pressure on quartz-water-CO2 contact angle and CO2-water interfacial tension. Journal of Colloid and Interface Science 441: 59-64.
- Sharma (2008) An experimental investigation on the impact of diffusion osmosis, chemical osmosis, and capillary suction on shale alteration. Journal of Porous Media 11(8).
- Sinnokrot AA, Ramey HJ, Marsden SS (1971) The effect of temperature level upon capillary pressure curves. Society of Petroleum Engineers Journal 11(1): 13-22.
- Somerton WH, Selim MA (1961) Additional thermal data for porous rocks: Thermal expansion and heat of reaction. Society of Petroleum Engineers Journal 1(4): 249-253.
- Stankovich Ewy (2000) Pore pressure change due to shale-fluid interaction: Measurements under simulated wellbore conditions. Proceedings Pacific Rocks, Fourth North American Rock Mechanics Symposium. Seattle, pp. 147-154.
-
M Ajay Kumar, Bhanwar Singh Choudhary and Mohammed Sazid*. Simulation On Effect of Blast-Induced Ground Vibrations for Overburden Dump Stability. Adv in Mining & Mineral Eng. 1(1): 2023. AMME.MS.ID.000504.
-
Ground vibration, dump slope stability, factor of safety, finite element method, dynamic analysis
-

This work is licensed under a Creative Commons Attribution-NonCommercial 4.0 International License.


