


 Research Article
Infrared Spectroscopy Study of Pure Oxides PbO, SnO2 and their Comparison
Received Date: April 20, 2023; Published Date: May 02, 2023
Abstract
Nanocrystals of semiconducting metal oxides have attracted great interest due to their interesting properties. Therefore, our study came to some physical properties of pure tin oxide and pure lead oxide. Infrared spectral measurements of pure tin and lead oxides showed the presence of vibrational frequencies containing five frequencies for tin oxide and nine vibrational frequencies for lead oxide. The permeability spectra of the SnO2 and PbO compounds were measured, and we calculated each of n , A α , σopt , and it was found through the comparison of these amounts for the two compounds that the optical conductivity = 1.214687 (Ωcm)-1 , n=9.949 A=2 , α=46 cm-1 , All previous values are in agreement with the same vibrational frequency of υ = 3450 cm-1 for the lead oxide compound, which is the highest possible .
Keywords: Tin oxide; Lead oxide; Infrared spectrum; Absorbance; Absorption coefficient; Refractive index; Optical conductivity analysis
Introduction
Transparent conducting oxides are technologically important materials with a wide range of applications in electronics, solar cells, flat panel displays, and more. Where these materials combine a unique property of being optically transparent and electrically conductive, and among these materials [1]. Where tin oxide (SnO2) is one of the most important transparent conducting oxides (TCOs) due to its unique optical and electrical properties, in addition to being thermally and chemically stable, and is considered a material with high mechanical specifications as it has a low specific electrical resistance and optical transmittance. High in the visual field and stability when heat treatment.
It is among the n-type semiconductor materials with an ener gy interval of 3.6 eV. The electrical conductivity of the oxide comes from the unevenness in the structure of these materials due to the oxygen voids. Conductivity can be improved by adding impurities. Electrical conductivity is also affected by heat [1]. The primary cell of tin oxide contains six atoms, two tin atoms and four oxygen atoms, as shown (Figure 1). Whereas, the tin atom Sn4+ located in the center is surrounded by six oxygen atoms O-2 forming a regular octahedron, while it surrounds all three atoms located on the vertices of an isosceles triangle, and it crystallizes according to the structure of the tetragonal, where a, c are the network constants It is equal to (a =b= 4.737 Å and c= 3.185 Å) and belongs to the mnm/2P4 space group (the quadrupole class rhomboid according to the preferred orientation (200) [2] (Figure 1).

This oxide is characterized by high electrical conductivity in the visible field and reflective in the infrared field, where tin oxide has an electrical conductivity located in the range(10³-10⁸) (Ωcm) ¹ˉ at room temperature. This conductivity is affected by many factors, including heat, light and magnetic field in the presence of tiny amounts of impurity atoms, which makes it a very important material in electronic applications. Electrical conductivity is also considered one of the most important characteristics by which solids can be classified. Because of the wide forbidden field, an absorption edge appears in the ultraviolet range, μ 0.36, which makes this compound transparent to visible and near infrared rays [3]. One of these oxides is lead oxide, PbO, which is technologically important due to its attractive properties, as lead oxide has multiple levels of reflectivity, which makes it suitable for optical storage devices [4].
Among the various properties that lead oxide possesses, PbO is an attractive material with low conductivity, interesting semiconductor and photo conducting properties which makes it suitable in laser technology and imaging device applications [5], as well as in applications such as gas sensors for CO2, also considered to be high-index materials, and PbO films were used as electrode materials for secondary lithium batteries [6]. The preparation of the PbO film is often complicated by its high volatility at low temperatures. At a low temperature, PbO is in the PbO-α tetragonal phase, and at a high temperature, it is in the axial phase. At 490 C°, PbO-α transition Phase to PbO-β (Figure 2).

Infrared spectroscopy
Infrared spectroscopy is one of the branches of spectroscopy that studies the infrared region of the electromagnetic spectrum and includes a set of implementations, the most famous of which is absorption spectroscopy, which is used to determine the active groups in the compounds under study. Infrared spectroscopy is one of the basic methods in the study of materials, as it enables us to identify the structure of the material without affecting its properties. It relies on studying the spectra absorbed by the sample in the energy range (14000-20) cm1- . The energy of red radiation is not sufficient to cause electronic excitations in most materials, but it is sufficient to cause stretching and bending vibrations in the bonds. And all types of bonds respond to this amount of energy to cause vibrations of this kind, so they absorb in the infrared region, provided that the absorption leads to a change in the dipole moment of the molecule, and these vibrations are quantized, and their occurrence means that the compound absorbs infrared energy in a specific part of the spectrum Most of the spectral analyzes take place in the mid-infrared region (200-4000)cm1- where most of the molecular vibrations occur and the researcher finds enough information to determine the molecular structure of the studied compounds .
Principle of infrared spectroscopy
Natural particles vibrate according to all their vibration patterns, but with very weak amplitudes, just as the photon has a sinusoidal electric field if the frequency of the incoming photon corresponds to the frequency of vibration of the regular patterns of the molecule, then the molecule will enter into resonance and vibrate with very large amplitudes, or in other words it absorbs the photon whose energy is equal to the energy necessary for the molecule to move from a low energy state to an excited state, and its energy is transformed into vibration energy as (Figure 3).

Only a photon whose energy is 2hʋ equal to the transition energy (E2-E1) is absorbed, thus creating an imbalance in the backscattered radiation. The absorption of some incoming photons leads to the appearance of harmonic lines of photons that have not been bounced and do not appear in the infrared spectrum curve of the molecule, this absorption characterizes the bonds between the atoms, and since each vibration pattern corresponds to a single movement of the molecule, this means that there is a direct correspondence between the frequency of the absorbed radiation and the structure of the molecule. When the infrared rays are returned to a medium, they suffer reflection, absorption and permeation from the medium. The IR spectrum of the pure oxides ZnO and SnO2 was measured using the aforementioned spectrometer. (Figure 3) shows the IR spectrum of those samples.
We Measured
1. Transmittance T: It is defined as the ratio between the intensity of the transmitted radiation to the intensity of the incoming radiation. It was taken from the device itself, and then using the appropriate mathematical relations, other optical coefficients were calculated.
2. Absorbance A: It is the ratio between the intensity of the absorbed radiation to the intensity of the incident radiation, and it is calculated from the equation: [7]
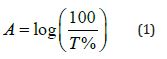
Where: T represents the Transmittance.
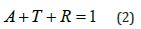
3. Reflectivity R: It is the ratio between the intensity of the reflected radiation to the intensity of the incident radiation. According to the law of conservation of energy, R can be calculated from the equation: [8]
4. Absorption coefficient α: It is defined as the ratio between the decrease in the energy of the incoming radiation per unit distance in the direction of propagation of the incident light wave inside the medium, and it is calculated from the equation: [9]
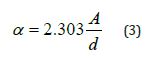
Where: d=1 mm is the material thickness.
5. The damping factor K: It is defined as the amount of energy absorbed by the atoms of the studied material from the energy of the incident radiation photons, and it is calculated from the equation [10]
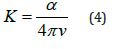
where α is the absorption coefficient.
6. Refractive index n: It is the ratio between the speed of light in a vacuum to its speed in the medium, and it is calculated from the equation: [11]
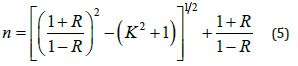
Where R is the reflectivity
7. Optical wavelength L: which is the reciprocal of the absorption coefficient: [9].

8. Optical conductivity σopt: The optical conductivity is related to the refractive index and the damping factor k according to the following equation [12]:

The Importance of the Research and its Objectives
The importance of research lies in its broad applications in scientific applications through the study and determination of the range of frequencies and transmittance of the infrared spectra of pure tin and zinc oxides and finding the transmittance, absorbance, absorption coefficient, refractive index, optical wavelength, photoconductivity and damping factor (absorption index).
Research Methods and Materials
Materials used to prepare the samples
Tin oxide (purity 99%, company TITAN BIOTECH LTD, originating in India.
Zinc oxide (purity 99%, company TITAN BIOTECH LTD, originating in India.
Devices and tools used
1. A sensitive balance type (SARTORIUS) with an accuracy of gr (4-10) located in the Faculty of Science - Department of Physics - Tishreen University.
2. A high-temperature convection oven (co 1200) with a temperature regulator located in the Faculty of Science - Department of Chemistry - Tishreen University.
3. Small agate mortar, Gate Morator.
4. Jasco infrared spectrometer (Plus 460-IR -TF) - Central Laboratory of the College of Science.
Results and Discussion
FT-IR technology is used to obtain information about chemical bonds and functional groups in matter. Measuring the permeability in terms of vibrational frequency is useful in predicting the presence of some functional groups as they are absorbed at certain vibrational frequencies and so it reveals the structure of the material. Where the positions of the absorption bands and peaks depend on the crystal structure of the material and the chemical composition as well as on the morphology. FT-IR analysis was performed for the samples at room temperature within the range of (400-4000 cm-1), where some absorption bands appeared for the studied samples, and we found that each sample was characterized by vibrational frequencies within the range of (400-4000 cm-1).
(Tables 1-3) contain the values of vibrational frequencies υ extracted from the IR spectra with the corresponding T values for each frequency. And refractive index n, absorbance A, damping factor K, α (absorption coefficient or linear absorption coefficient), optical wavelength L, and optical conductivity σopt (Figure 4) (Tables 1, 2).

Table 1: The table shows pure tin oxide with values of transmittance corresponding to each vibrational frequency, absorbance, reflectivity, absorption coefficient, damping factor, refractive index, optical length and optical conductivity.

Table 2: The table shows pure tin oxide with values of transmittance corresponding to each vibrational frequency, absorbance, reflectivity, absorption coefficient, damping factor, refractive index, optical length and optical conductivity.

Figure (a-5)] shows the changes of the absorption coefficient in terms of the vibrational frequency of PbO, where the value of the absorption coefficient decreases with the increase of the vibrational sites until it reaches the lowest value α = 14.255 cm-1 for the absorption coefficient at a vibrational frequency υ = 750 cm-1, and it begins to increase until it reaches For a value of the absorption coefficient α=24.623 cm-1 at a vibrational frequency υ=1400 cm-1, then the value of the absorption coefficient decreases and then returns to increase, then decreases and then increases to reach the greatest value of the absorption coefficient α=46 cm-1 corresponding to a vibrational frequency of υ=3450 cm-1, and this is due to the bonding forces between the molecules of the compound .
[Figure (b-5)] shows the changes of the absorption coefficient in terms of the vibrational frequency of SnO2, where the absorption coefficient increases with the increase of the vibrational sites until it reaches the highest value α = 16.687 cm-1. For the lowest value α=12.825 cm-1 at vibrational frequency υ=2125.30cm-1 (Figure 5) (Table 3).

Table 3: shows the average values of the absorption coefficient and the highest and lowest values of the absorption coefficient for the pure oxides, PbO, SnO2.

[Figure (a-6)] shows the absorbance changes in terms of the vibrational frequency of PbO, where the absorbance decreases with the increase of the vibrational sites until it reaches the lowest value of A = 0.619 for the absorbance at a vibrational frequency υ = 750 cm-1, and it begins to increase until it reaches a value of A = 1.070 at a vibrational frequency υ = 1400 cm-1, then the value of absorbance decreases and then returns to increase, then decreases and then increases to reach the greatest value of absorbance A = 2 corresponding to a vibrational frequency of υ = 3450 cm-1, and this is due to the weak bonding forces .

[Figure (a-6)] shows the changes in the absorbance in terms of the vibrational frequency of SnO2, where the absorbance increases with the increase in the vibrational sites until it reaches the highest value of A = 0.725 of the absorbance at a vibrational frequency υ = 574.683 cm-1, then decreases again until it reaches the lowest value of A = 0.558 at Vibration frequency υ = 2125.3 cm-1 (Figure 6) (Table 4).
[Figure (a-7)] shows the changes of the optical conductivity in terms of the vibrational frequency of PbO, where the value of the optical conductivity decreases with the increase of the vibrational sites until it reaches the lowest value σopt = 0.067323 (Ωcm)-1 of the optical conductivity at a vibrational frequency υ = 750 cm-1, and it begins to increase Until it reaches a value of the optical conductivity σopt = 0.214406 (Ωcm)-1 at a vibrational frequency υ = 1400 cm-1, then the value of the optical conductivity decreases and then returns to increase, then decreases and then increases to reach the greatest value of the optical conductivity σopt = 1.214687 (Ωcm)-1 corresponding to a frequency A vibrational magnitude of υ = 3450 cm-1, due to the spatial voids between the atoms.

[Figure (b-7)] shows the changes of the optical conductivity in terms of the vibrational frequency of SnO2, where we notice from the curve the optical conductivity value decreases with the increase of the vibrational sites until it reaches the lowest value σopt = 0.0807 (Ωcm)-1 for the optical conductivity at a vibrational frequency υ = 750 cm-1, and it starts to increase until it reaches a value of optical conductivity σopt=0.214406 (Ωcm)-1 at a vibrational frequency υ=2125.300 cm-1, and then the value of the optical conductivity increases with increasing vibrational frequency to reach the greatest value of optical conductivity σopt=0.0831 (Ωcm)-1 Corresponding to a vibrational frequency of υ = 3432.67 cm-1, due to the spatial voids between the atoms (Figure 7) (Table 5).
Table 4: shows the average values of absorbance, the highest and the lowest value of absorbance for pure oxides, ZnO, SnO2.

Table 5: shows the average values of the optical conductivity and the highest and lowest values of the photoconductivity for the pure oxides, PbO, SnO2.

[Figure (a-8)] shows the changes of the index of refraction in terms of the vibrational frequency of PbO, where the value of the index of refraction decreases with the increase in the vibrational sites until it reaches the lowest value of n = 1.779 for the index of refraction at a vibrational frequency υ = 750 cm-1, and it begins to increase until it reaches a value for the index of refraction n = 3.280 at a vibrational frequency υ = 1400 cm-1, then the value of the refractive index decreases and then returns to increase, then decreases and then increases to reach the greatest value of the refractive index n = 9.949 corresponding to a vibrational frequency of υ = 3450 cm-1, and this is due to the bonding forces between compound particles.
[Figure (a-8)] shows the changes of the refractive index in terms of the vibrational frequency of SnO2, where the refractive index decreases with the increase in the vibrational sites until it reaches the lowest value of n = 1.832 the refractive index at a vibrational frequency υ = 574.683 cm-1, then it increases again until it reaches the highest value n = 2.371 at vibrational frequency υ = 2125.30cm-1 (Figure 8) (Table 6).

Table 6: shows the average values of the index of refraction and the highest and lowest values of the index of refraction for the pure oxides PbO, SnO2.

Conclusions and Recommendations
1. The RI spectrum of lead oxide is characterized by nine vibrational frequencies, and tin oxide is characterized by five vibrational frequencies within the range (400-4000) cm-1 .
2. The value of absorbance A for each of the studied oxides ranges within the range for lead oxide, [0.725-0.558] for tin oxide [0.619-2[
3. The value of the refractive index n ranges within the range. for lead oxide, [2.371-1.832] for tin oxide [9.949-1.779].
4. The value of the optical length, L, ranges within the range for lead oxide, [0.078-0.060] for tin oxide [0.070-0.021].
5. The value of the Nuhain coefficient α ranges within the range for lead oxide, [12.826-16.687] for tin oxide [14.255-46].
6. The value of the optical conductance σ ranges within the range for lead oxide, [0.0831-0.0807] for tin oxide [1.2146-0.06732].
Acknowledgement
None.
Conflicts of Interest
No conflict of interest.
References
- BACO S, CHICK A, YASSIN FM (2012) Study on Optical Properties of Tin Oxide Thin film at Different Annealing Temperature. Journal of Science and Technology 4(1): 61-72.
- JAZEBSKI ZM, MARTON JP (1976) Physical properties of SnO2 Journal of The Electrochemical society 123(9): 299-310.
- OREL ZC, OREL B (1992) Conductive SnO2/Sb powder: preparation and optical properties. Journal of Materials science 27: 313-318.
- Caho S, Fuang YF, Chen YC, Yen L (1990) Multiple phase change of lead oxide film for optical storage. J Phys 23: Pp 955.
- Trinquie G, Sanchez R, Hoffmann R (1984) Lead oxide electronic structure and bonding. J Phys Chem 88: Pp 6696.
- Martos M, Morales J, Sanchez L, Ayouchi R, Leinen D, et al. (2001) "Electrochemical properties of Lead oxide films obtained by spray pyrolysis as negative electrodes for lithium secondary batteries" Electrochimica Acta 46(19): 2939-2948.
- SAKNI L (2017) Studying the structural of Fe doped tin oxide, Master thesis. Alwadi University.
- Chopra KL (1969) Thin Film Phenomena, Mc. Graw-New York.
- Al JAWAD S (2016) Studying the effect of doping on the structural and optical properties of tin oxide thin films. Journal of engineering and technology Vol. 34.
- MANSOUR M (2012) Studying the structural and optical properties of: Cu thin films by APCVD method vol. 5.
- Al Rawi SS, Shakir SJ, Husan YN (1990) Solid State Physics, Publishing of Mousal University Arabic Version.
- A ZAID (2012) Studying the structural and optical properties of NiO thin films, Master thesis" Dyala University.
-

This work is licensed under a Creative Commons Attribution-NonCommercial 4.0 International License.


