 Research Article
A Comparison of Common Statistical Techniques for Spectroscopic Data Preprocessing
José Luis Romero Béjar1, Francisco Javier Esquivel1 and José Antonio Esquivel2,3*
1Department of Statistics and Operations Research. University of Granada, Spain
2Department of Prehistory and Archaeology. University of Granada, Spain
33D archaeological modelling laboratory. University of Granada, Spain
José Luis Romero Béjar, Department of Statistics and Operations Research. University of Granada, Spain
Received Date:February 20, 2024; Published Date:March 05, 2024
Abstract
Spectroscopic data are “big data” recorded using a large number of wavelengths of the electromagnetic spectrum, usually [350-2500] nm or [400-2500] nm in 1 nm units. However, the interaction between light and matter is a complex process distorted by noise produced by optical interference or instrument electronics and, usually, requires the use of the Fourier transform. The application of mathematical and/or statistical preprocessing functions to raw data is essential to obtain reliable results. There are several functions that have been used for preprocessing. Models based on statistical techniques have the advantage that they are easy to apply and the algorithms affect each of the variables. In this work, rock samples are analyzed by opposing raw data to preprocessed data by mean different statistical functions. The results obtained are then evaluated in order to highlight the most important shapes associated with the spectral signatures. Two functions, the transformation of each raw data to zero mean and standard deviation 1 and the affine function, which is based on the min-max normalization (MMN), stand out from the rest. These functions preserve the relations of initial raw data and the graphical representation of the signatures while accentuating peaks, valleys and trends, contributing to improve the results obtained by multivariate statistical techniques as well as the results of classification techniques [1]. We propose the use of the affine function that highlights the shapes and, in addition, keeps the range of the data in the interval [1].
Keywords:Preprocessing; raw data; spectroscopy; statistical functions
Introduction
Spectroscopy is a technique that studies the interaction between electromagnetic light radiation and matter by measuring the amount of light absorbed, reflected or emitted by an object. Each material has a unique spectrum described by the frequencies of light emitted or absorbed at different wavelengths, and each wavelength corresponds to a different frequency. It is currently applied in much of the scientific field including Geology, Archaeology, Heritage, Pharmacy, Medicine and Biology among other scientific disciplines. In addition, spectroscopy is also used in industrial applications such as the identification of chemical compounds, materials analysis, etc. Spectrometers provide a large amount of big data for each material measuring the interaction between light and the material under study. One of the most widely used measures is the diffuse reflectance and the spectrometers provide a distinctive reflectance pattern known as a spectral signature or spectrum for a given material. The wavelength range of interest in scientific research is 350-2500 nm or 400-2500 nm in 1nm increments, which makes further analysis very difficult. For this reason, the preprocessing of spectral data is of great importance to achieve good results in subsequent analysis. In this work we analyze the application of different post-processing functions to a set of spectral signatures corresponding to rocks and minerals. The objective is to evaluate the goodness of the results obtained to highlight the features of the different samples used.
Materials and Methods
The materials used correspond to three rocks or minerals (alunite, sillimanite and wollastonite) that have different types of spectral signatures with very different reflectance values. The spectroscopic data were obtained from minerals or rocks recorded by NASA’s Jet Propulsion Laboratory (ECOSTRESS 1.0 &1.2 library) [2]. These data include the wavelengths of the electromagnetic spectrum 400-2500 nm with an interval of 1 nm.
Statistical methods are made up of linear transformations based on different statistical parameters.
Raw data and preprocessed data
In spectroscopy, the raw or primary data are the values provided by the spectrometers that measure the interaction between electromagnetic radiation and the matter under study. These data record the reflectance or absorbance values at each of the wavelengths provided by the measuring instrument used. Subsequently, it is usual to present them as percentages. The reliability of the raw data is essential to obtain quality results when performing both the detailed allocation of absorption or emission bands. In addition, when dealing with big data, the application of various mathematical and statistical analyses to the data is essential. The interaction between light and matter is a complex process limited by the accuracy of the instrument, the wavelength range used and the distortion caused by noise in the data acquisition [1,3].
One of the most important problems that arise with raw data are related to the values of the spectra recorded by the spectrometers. It is usual that the spectra of many materials correspond to monotonic functions with a very small range of variation, so that the typical shapes are almost indistinguishable and, in addition, there is a large amount of detail that remains hidden. In addition, sources of error environment, temperature, electric fluctuations, contamination, etc. can be produced or heating of the sample by the photometer can alter the recorded measurements [4]. Furthermore, previously to performing quantitative analyses it is important to evaluate the spectra and establish the erroneous regions by means of different procedures for error detection [5]. Preprocessing is considered to be a crucial step prior to the construction of a quantitative calibration model [6].
Preprocessing methods
Preprocessing methods are transformations of spectral signatures that belong to three basic groups: functional, statistical and geometric [1]. The commonly used spectral preprocessing methods include mean centering, auto-scaling, normalization, smoothing, derivatives, standard normal variate transformation, multiplicative scatter correction, Fourier transform, wavelet transform, orthogonal signal correction, and net analyze signal [7]. Statistical methods have the advantage that they refer to the use of more or less sophisticated parameters and are therefore very well adapted to the data. These techniques are not inspired by previous theoretical models and are therefore not restricted by constraints. Preprocessing is an essential part of the overall process called ‘knowledge discovery from data’ (KDD) which is constituted by an iterative sequence that has the steps: Data cleaning, Data integration, Data selection, Data selection, Data transformation, Data mining, Pattern evaluation and Knowledge presentation [8]. However, not all preprocessing techniques have the same performance. In particular, functional-type techniques correspond to mathematical functions of different types, such as logarithmic, exponential, etc. Statistical techniques modify the scale of the data and focus on homogenizing the data to perform between spectral signatures. Geometric transformations are based on the use of functions in the vector space R×R in order to highlight the shapes in the data [1].
Among the most common statistical techniques stand out to typified Z or standardized scores (Z_i=(X_i-μ)/σ) transforming the data to a distribution with mean 0 and variance 1, the transformation (X_i^’=X_i/(X_max-X_min )) fits the data within the range [X_min,X_max], the related to range 0–1 (X_i^’=(X_i-μ)/ (X_max-X_min )), the transformation related to the maximum magnitude (X_i^’=X_i/X_max ), to the mean (X_i^’=X_i-μ), or to the standard deviation (X_i^’=X_i/σ) [9]. An important transformation is the so-called ‘affine transformation’ which is similar to the rank transformation but is not referenced to the mean but to X min, thus avoiding the smoothing of data. This transformation is expressed by f:[r_min,r_max ]→[〖r’〗_min,〖r’〗_max ], expressed by f(x)=(x-r_min)/ (r_max-r_min ), that provides a min–max normalization (MMN) [1]. In this paper we propose to compute the above statistical transformations and to compare the results with the results of the previous transformations. These transformations have a general formulation but the associated parameters are different for each sample analyzed, which allows to highlight the inherent features can remain hidden in the data.
An application case
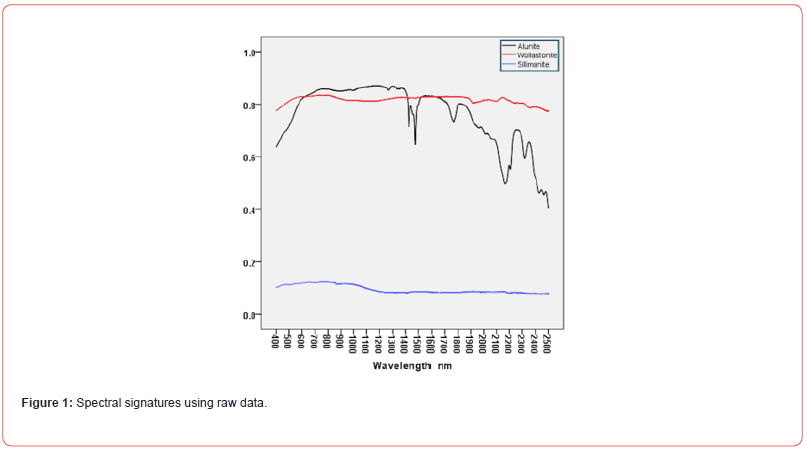
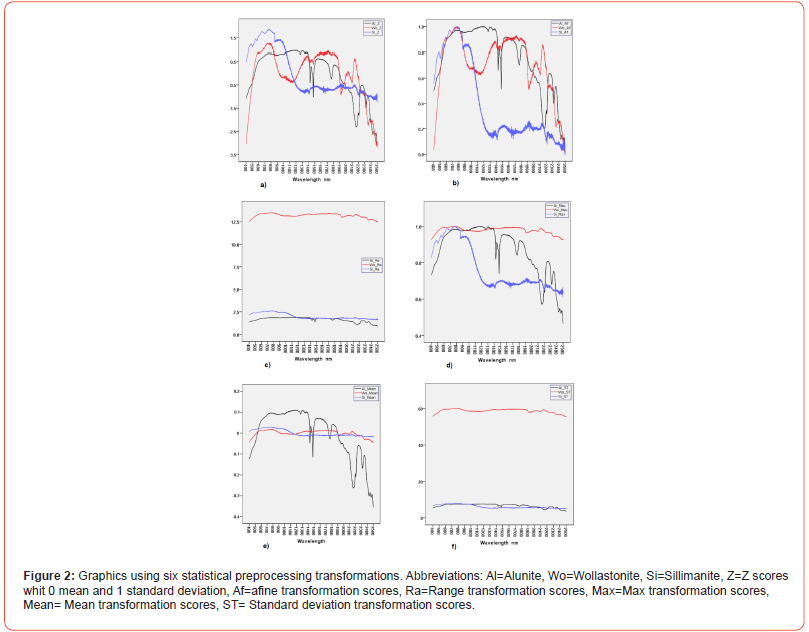
Three rock samples (Alunite, Sillimanite and Wollastonite) have been chosen whose spectral signatures have great differences both with respect to the reflectance values and the shapes of each of them (Table 1). Furthermore, the spectrum of alunite has a great variability of shapes with large reflectance values while the spectra of Sillimanite and Wllastonite show an almost horizontal shape but the reflectance of Wollastonite is large while that of Sillimanite is very low (Figure 1). The data set has been processed using six preprocessing transformations to compare the results obtained (Figure 2).


Table 1:Variability of samples.

Some of these transformations do not produce any adequate effect to better distinguish between the analyzed materials and, sometimes, worsen the result obtained with raw data. These are the cases c) and f) which do not highlight the shapes and, in addition, reduce those corresponding to alunite. Transformation e) only performs a translation of the parameter data to the mean. The results of d) are confusing and do not provide any new information. On the other hand, transformations a) and b) provide information that is hidden in the raw data. The values obtained from these transformations show a high reflectance in the visible region (VIS) λ≤900 nm. However, in the region λ>1100 nm the results of b) indicate that Wollastonite has quite a lot of shape variability while the reflectance of Sillimanite is very small and has little variability although singular points (peaks, valleys, etc.) are well highlighted. Features in the visible and near-infrared spectra carry significant details regarding the physical and molecular makeup of materials, such as chert. These signatures identify molecules through absorbed wavelengths, including water, hydroxyls, phosphates, nitrates, carbonates, sulfates, and metal oxides and hydroxides [10,11]. Finally, the application of some of these functions can lead to false positives, i.e. peaks very close to each other with similar values. This problem is usually solved by using a local regression technique such as “loess” or “lowess” [12] or by the Saviztky-Golay filter [13].
Conclusions
The collection and recording of spectroscopic data is of the big data type and is affected by the complexity of the nature of the interaction between light and matter. This problem is compounded by instrument limitations and the distortion introduced by the noise inherent in the process. For this reason it is necessary to apply mathematical techniques to preprocess the raw data. The use of mathematical preprocessing functions is a widely used method to enhance the shapes of spectral signatures. Statistical functions constitute a methodology of great importance to largely avoid the problems of analyzing raw data. Among the statistical techniques used in this work, the affine function min–max normalization (MMN) and the standardization of the spectrum to mean 0 and variance 1 stand out. Statistical functions constitute a methodology of great importance to highlight the hidden shapes and provide better results when applying algorithms of analysis. Among the statistical techniques used in this work, the affine function min– max normalization (MMN) and the standardization of the spectrum to mean 0 and variance 1 stand out. The preprocessed data preserve the features of the original distribution, including local maximum, minimum as well as the underlying trends.
Funding
This work has been partially supported by grants PP2023- EI-07 funded by University of Granada, Spain, and PID2021- 128077NB-I00 funded by MCIN/AEI/10.13039/501100011033/ ERDF A way of making Europe, EU.
References
- Esquivel FJ, Esquivel JA, Morgado A, Romero Béjar JL, García del Moral LF (2022) Preprocessing of Spectroscopic Data Using Affine Transformations to Improve Pattern-Recognition Analysis: An Application to Prehistoric Lithic Tools. Mathematics 10(22): 4250-4255.
- Meerdink SK, Hook SJ, Roberts DA, Abbott EA (2019) The ECOSTRESS spectral library version 1.0. Remote Sensing of Environment 230 (111196): 1-8.
- Pyle D (1999) Data Preparation for Data Mining. Morgan Kauffman Publisher, San Francisco, United States.
- Reule AG (1976) Errors in Spectrophotometry and Calibration procedures to avoid them. Journal of Research of the National Bureau of Standards - A. Physics and Chemistry 80(4): 609-624.
- Bazar G, Kovacs Z, Tsenkova R (2016) Evaluating Spectral Signals to Identify Spectral Error. PLoS ONE 11(1): e0146249-e0146253.
- Skibsted ETS, Boelens HFM, Westerhuis JA, Witte DT, Smilde AK (2004) New indicator for optimal preprocessing and wavelength selection of near-infrared spectra. Applied Spectroscopy 58(3): 264-271.
- Mishra P, Biancolillo A, Roger JM, Marini F, Rutledge DN (2020) New data preprocessing trends based on ensemble of multiple preprocessing techniques. Trends in Analytical Chemistry 132(3): 116045-116053.
- Han J, Kamber M, Pei J (2023) Data mining: concepts and techniques, 4th ed. Morgan Kauffman Publisher, San Francisco, United States.
- Dodge Y (2003) The Oxford Dictionary of Statistical Terms, 6th ed. Oxford University Press, Oxford.
- Sgavetti M, Pompilio L, Meli S (2006) Reflectance spectroscopy (0.3–2.5 µm) at various scales for bulk-rock identification. Geo-sphere 2(3): 142-160.
- Roque Malherbe RMA (2020) The Physical chemistry of materials CRC Press. Boca Ratón, Taylor & Francis Group.
- Cleveland WS, Devlin SJ (1988) Locally-Weighted Regression: An Approach to Regression Analysis by Local Fitting. Journal of the American Statistical Association 83(403): 596-610.
- Savitzky A, Golay MJE (1964) Smoothing and differentiation of data by simplified least squares procedures. Analytical Chemistry 36(8): 1627-1639.
-
José Luis Romero Béjar, Francisco Javier Esquivel and José Antonio Esquivel*. A Comparison of Common Statistical Techniques for Spectroscopic Data Preprocessing. Adv in Mining & Mineral Eng. 1(2): 2024. AMME.MS.ID.000510.
-
Preprocessing; raw data; spectroscopy; statistical functions
-

This work is licensed under a Creative Commons Attribution-NonCommercial 4.0 International License.


