 Research Article
Analysis Of Plasma D-Dimer Behavior After A HIIT Session By Machine Learning Exploratory Technique
Luis Carlos Oliveira Gonçalves1,A,B,C,D*, Eduardo Luzia França2,A, Rafael Joviano Souza de Barros3,E, Roberto Lohn Nahon4,F, Adenilda Cristina Honorio França5,A, Fernanda Regina Casagrande Giachini Vitorino6,A, Aníbal Monteiro de Magalhães Neto7,A,B
AGraduate Program in Basic and Applied Immunology and Parasitology (PPGIP), Federal University of Mato Grosso (UFMT), Brazil
BGraduate Program in in Physical Education (PPGEF), Federal University of Mato Grosso (UFMT), Brazil
CUndegraduate Program in Statistics – Brazilian Institute of Medicine and Rehabilitation (IBMR), Brazil
DMBA in Data Science & Analytics – University of São Paulo (USP), Brazil
EDepartment of Municipal Health, Barra do Garças-MT, Brazil
FBrazilian Society of Orthopedics (SBOT). Brazilian Society of Exercise and Sports Medicine (SBME), Brazil
Luis C O Gonçalves, Graduate Program in Physical Education, Federal University of Mato Grosso, Brazil.
Received Date: June 24, 2023; Published Date: July 31, 2023
Sport omics has sought to understand immunometabolism. Fifteen athletes of MMA were submitted to HIIT to evaluate acute stress and the kinetics of D-dimer. After applying the Euclidean dissimilarity measure, two dendrograms were proposed that presented three clusters of d-dimer behavior. Cohen’s d and r were calculated for the three clusters formed, confirming the choice. The network plot with the Fruchterman algorithm identified that the cluster formed by athletes 4, 7, 15, and 16 had a more differentiated behavior than the other two clusters. The D-dimer does not show similar kinetics, even in a highly homogeneous group subjected to the same type, time, and intensity of stress, presenting itself as a potentially more sensitive biomarker for stress, going far beyond a vascular marker, as perceived during the COVID-19 pandemic. The use of exploratory machine learning techniques for analysis D-Dimer has been suggested since its behavior is highly individual, not allowing analysis only by means.
Keywords:Sportomics; Data mining; Sports Medicine
Introduction
Sportomics science has attempted to explain the interactions between metabolism and the immune system using physical exercise as a model to address the action of nutritional supplements and medications, immunometabolic alterations caused by different forms of sport and in different populations, and the suggestion of different views and biomarkers aiming toward a holistic analysis in data science in the biomedical field [1-6]. D-Dimer is a bloodsoluble fibrin degradation product that results from the degradation of thrombi by the fibrinolytic system [7], since its first studies in the 1970s [8], its dosage has been applied to diagnose pulmonary embolism, deep venous thrombosis, and other problems with coagulation and thrombus formation [9-11]. Later, D-Dimer was associated with the degree of stress caused by surgeries, venous and arterial thrombosis, inflammation, disseminated intravascular coagulation, surgeries, trauma, burns, cancer, infection, sepsis, pregnancy, liver disease, thrombolytic therapy, kidney disease and diseases cardiovascular, and recently, publications on this biomarker have grown due to its sensitivity for early detection of possible thrombotic cardiovascular events in patients with COVID-19 [12-14].
Sportomics science has evaluated this marker as a potential biomarker for the early detection of exercise-induced rhabdomyolysis [15] or fibrinolysis and hypercoagulability by its practice [16]. Traveling to competitions is expected in the lives of high-level athletes. Exercise alone already causes D-Dimer elevation; when associated with car or plane travel, the combination of exercise and travel increases venous and arterial thrombotic risk. These results may explain the reports of venous thrombosis with air travel after sporting events and the reports of cardiac events in older participants running marathons [17]. However, this elevation is directly associated with the intensity of the exercise. For example, a 30-minute run on a treadmill at 60% VO2Max (Maximum Oxygen Volume) did not raise levels above 500 g/L in any participants [18]. Even sedentary individuals and smokers, when submitted to non-intense exercise, do not reach values superior to 500 μg/L, corroborating the previously said [19]. Furthermore, not even when the exercise is of long duration, the fact of not having high intensity means that the levels do not reach this cited mark [20]. The present study aimed to investigate the kinetics of the D-dimer biomarker using high-intensity interval exercise (HIIT) as a stress model and exploratory machine learning strategies for ordering and clustering the behavior of this variable at different acute collection times.
Methods
Subjects
Adult male with a minimum of 5 years of professional experience in MMA competitions and at least 2 years of experience in Cross Combat (High Intensity Interval Training - HIIT). 15 athletes participated in this study [Table 1].
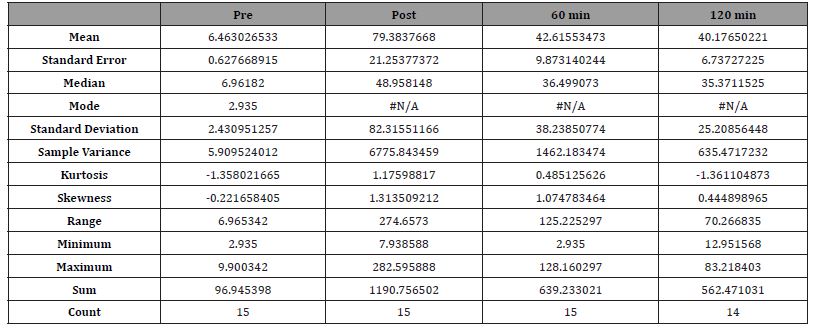
Table 1:Descriptive statistics with position, dispersion and form measures for D-dimer.
Experimental design
The athletes engaged in HIIT (40 min) in an observational and cross-sectional cohort study. All participants rested for 72 h before the exercise protocol. The Combat protocol was individually created to achieve an intensity level of 70% repetition maximum, calculated as previously described [6]. The protocol involved 12 different exercises combined in six modules according to their equivalence.
Blood measurements
Blood samples were collected at the following times: preexercise collection (Pre); immediately after exercise (Post); 60 min after the end of exercise (60 min), and 120 min after the end of exercise (120 min). Hematocrit was measured using microhematocrit tubes and centrifugation. The D-dimer level was assessed using ichroma alpha ® (Boditech Med Inc., Gangwon-do, Korea).
Data science and statistics
Descriptive statistics were performed on the data and Shapiro‒Wilk normality test. The equal variance test was applied if the Shapiro‒Wilk test presented a result indicating a normal distribution (P>0.05). For results with P>0.05, the paired Student’s t test followed; if P≤0.05, the paired Student’s t test followed the nonparametric Mann‒Whitney test. If the Shapiro‒Wilk test presented a result indicating a nonnormal distribution (P≤0.05), the nonparametric Mann‒Whitney test was directly applied. Nevertheless, in the phase of the univariate analysis, the one-way dependent repeated-measures ANOVA was performed because they were the same individuals at different moments. Cohen’s equations [21] were used to calculate the effect size for hematocrit and d-dimer. Next, the Pearson and Spearman correlation tests were applied. The Spearman correlation was used for a visual analysis using the heatmap strategy and the Pearson test was used as an initial measure for the following machine learning analyses.
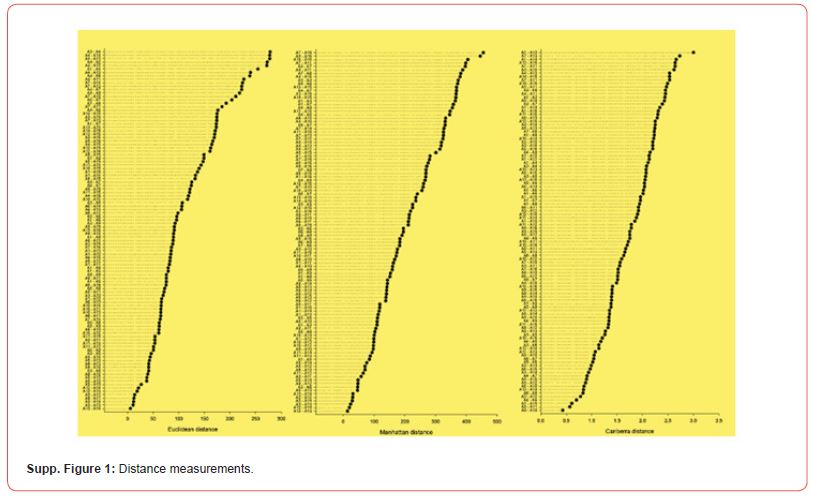
Exploratory models of machine learning: CLUSTER - Classical Clustering (Agglomerative Hierarchical Method) and Nearest neighbor (single linkage); ORDINATION – Principal Component Analysis (PCA) and Multiple Correspondence Analysis (MCA). Unsupervised and exploratory machine learning models were applied to classify or group observations and variables, in addition to seeking correlation or association among them. For this, the hierarchical clustering and PCA algorithms were selected for the quantitative study variables (d-dimer) and the MCA was selected for the qualitative or categorical variables (collection times). As initial treatment, the measures of dissimilarity (distance) among the observations of the study variable were calculated, namely, the Quadratic Euclidean, the Euclidean, the Manhattan, and the Canberra [Supp. Table 1-3]. Of these, the results for the last three are shown in [Supplementary Figure 1]. Only the Euclidean dissimilarity measure was used as a standard for analysis and decision-making. The Fruchterman-Reingold algorithm was also applied to distribute vertices uniformly, minimize edge crossings, make edge lengths uniform and reflect inherent symmetry [22]. The Z score was not previously applied because the observations contained similar measurement units. Sigma Plot 14.5 (Academic Perpetual License – Single User – ESD Systat® USA), Past 4.03 (Free version for Windows) and, R 4.2.1® integrated with R Studio® (Free version for Windows) were used to carry out the different statistical tests and produce the graphs.
Table 2:Subjects’ demographic characteristics (n = 15).

Table 3:Pairs of observations of distance measurements.
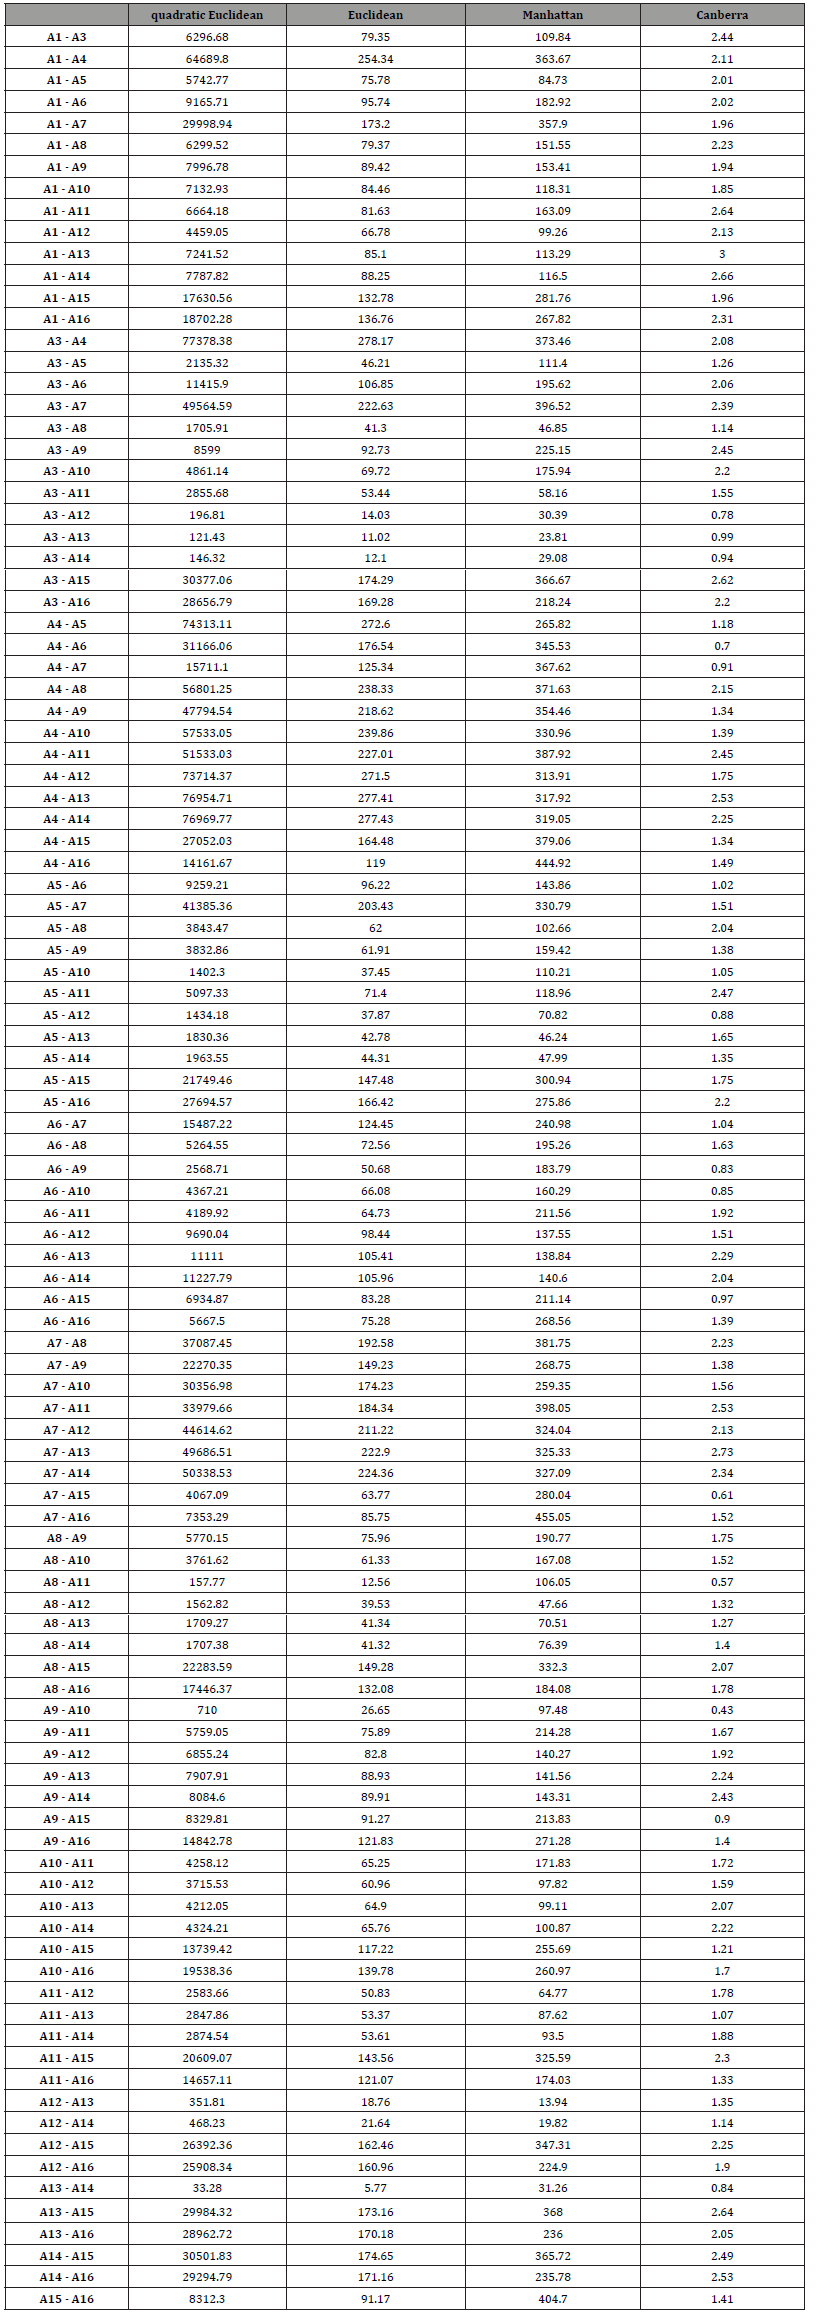
Table 4:Values of Effect size.

Ethical approval
The participants received all the information about the study’s objectives, procedures, and risks. Only after agreeing to this information were, they invited to sign an informed consent form (TCLE), which assured their rights of privacy and freedom to withdraw from the study when they agreed. The study was previously submitted and approved by the Ethics Committee in Research involving Human Beings of the Federal University of Mato Grosso (UFMT), having been approved under number: 5,716,414.
Results
When the first article on the impact of the new training method was published [6], it became clear that the D-dimer biomarker did not have a similar behavior among athletes, even though the sample was extremely homogeneous and submitted to the same kind of stress [Table 2]. This discrepancy led us to conduct an experiment with the same sample, conditions, and exercise method, aiming at a multivariate analysis of this biomarker [Table 1]. presents the descriptive statistics of the observations of the study variable (d-dimer) being treated with a single group of individuals, aiming at an initial observation of the measures of position, dispersion, and shape. Hematocrit measurement at the same collection times was carried out to control the hydration status of the participants. Any plasma hydration change, whether in hemoconcentration or hemodilution, would require the application of correction factors in the observation of the study variable (d-dimer). As both Student’s t test and ANOVA did not identify a significant difference in the hematocrit between the collection times, no adjustment factor was applied to the D-dimer, since its changes were caused by the exercise method and not by changes in plasma hydration.
Table 5:Integrated and holistic statistical analysis on means.

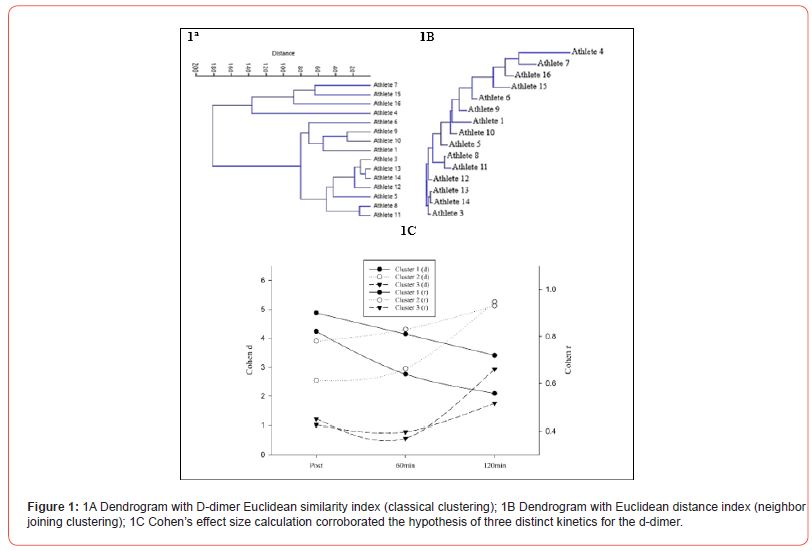
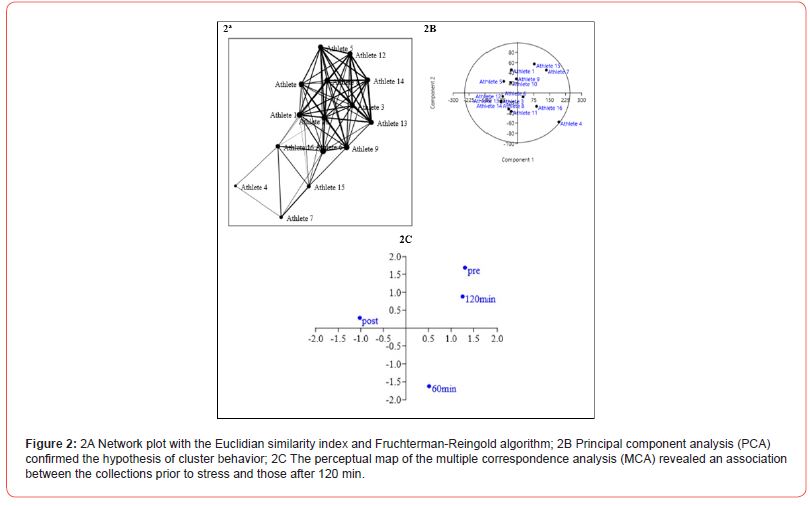
After applying the Euclidean measure of dissimilarity, two dendrograms were proposed that presented three possible clusters of d-dimer behavior in the form of classical clustering [Figure 1A] and neighbor joining clustering [Figure 1B]. To confirm the proposed clustering, Cohen’s d and r were calculated for the three clusters formed, confirming three different behaviors within the sample [Figure 1C]. The network plot was created from the Euclidean measure of dissimilarity and with the application of the Fruchterman-Reingold algorithm [Figure 2A]. identified that the cluster formed by athletes 4, 7, 15, and 16 had a more differentiated behavior in relation to the other two clusters, which had already been noted in [Figures 1 A/B] and could be identified again in the graph with the results of the principal component analysis [Figure 2B]. The perceptual map with multiple correspondence analysis found an association between collection times prior to stress and those after 120 min, suggesting a rapid recovery of the baseline state for this biomarker [Figure 2C].
Discussion
D-dimer is a blood-soluble fibrin degradation product that results from the degradation of thrombi by the fibrinolytic system [7]. Since it was first the object of studies in the 1970s [8,9], the dosage of D-dimer has been applied for the diagnosis of pulmonary embolism, deep venous thrombosis, and other problems with coagulation and thrombus formation [10,11]. Later, D-dimer was associated with the degree of stress caused by surgeries. The degree of invasiveness is separated into types I, II, and III (from least to most invasive); their levels increased postoperatively, with type I reaching a peak after 7 days, with a peak not exceeding the normal range (300 μg/L); a peak of (1500 μg/L) for type II, returning to normal values after 25 days; and a peak of (4000 μg/L) for type III, returning to baseline values in 38 days [12]. There are several clinical disorders associated with the elevation of this biomarker, such as venous and arterial thrombosis, inflammation, disseminated intravascular coagulation, surgeries, trauma, burns, cancer, infection, sepsis, pregnancy, liver disease, thrombolytic therapy, kidney disease, and cardiovascular diseases [13].
Recently, publications on this biomarker have grown due to its sensitivity for the early detection of possible thrombotic cardiovascular events in patients with COVID-19 [14,23]. Sports and medical sciences have evaluated this marker as a potential biomarker for early detection of exercise-induced rhabdomyolysis [15] or of fibrinolysis and hypercoagulability by its practice [16]. However, there is scarce information regarding the correlation of this marker with the practice of physical exercise. Traveling to competitions is common in the lives of high-level athletes. Exercise alone causes D-dimer elevation, and when associated with car or plane travel, the combination of exercise and travel increases venous and arterial thrombotic risk. This may explain the reports of venous thrombosis with air travel after sporting events and the reports of cardiac events in older participants running marathons [18]. However, it seems that this elevation is directly associated with the intensity of the exercise. For example, a 30-minute run on a treadmill at 60% VO2Max (maximum oxygen volume) did not raise levels above 500 μg/L in any of the participants [19]. Even sedentary individuals and smokers, when submitted to nonintense exercise, do not reach values above 500 μg/L, corroborating previous reports. Even when the exercise is of long duration, the lack of high intensity means that the levels do not reach this cited mark [20]. Modern science must apply exploratory machine learning strategies to generate holistic and integrated analyses of the results [24].
From the two generated dendrograms [Figures 1 A and B], it is clear that this biomarker has different kinetics, even in highly homogeneous groups submitted to the same type, time, and intensity of stress. It was possible to observe three clusters in the sample with 15 individuals generated from the application of the Euclidean measure of similarity. Data were corroborated by the calculation of Cohen’s effect size when evaluated in clusters. This indicates that there is no possibility of evaluating this biomarker by measures of position and dispersion contained in descriptive statistics or the application of univariate analyses. The group formed by Cluster 1 had a sharper peak of D-dimer (Post) with subsequent decay in its concentration; the group formed by Cluster 2 had an increasing trend with a peak in the last collection time (120 min); and the group formed by Cluster 3 had an acute peak (post), a slight decay (60 min) and an increasing trend until its highest concentration (120 min), revealing three different kinetics. [Figure 2A], showing the network plot with the Euclidian similarity index and Fruchterman- Reingold algorithm, showing principal component analysis (PCA), confirm the hypothesis of cluster behavior and explain the behavior by clusters. Finally, [Figure 2C], through the perceptual map of the multiple correspondence analysis (MCA), shows an association between the collection prior to stress and that after 120 min. The present work has new implications and possibilities for the use of D-dimer in sportomics science, with differentiated kinetics in relation to the main clinical disorders.
Conclusion
The D-dimer biomarker does not show similar kinetics, even in a highly homogeneous group and subjected to the same type, time, and intensity of stress, presenting itself as a potentially more sensitive biomarker for immunometabolic stress, and going far beyond a vascular marker, as perceived during the COVID-19 pandemic. The use of multivariate statistics with exploratory machine learning techniques for a holistic and integrated analysis of different experiments with this biomarker is suggested since its behavior is highly individual, not allowing analysis by means and classic univariate statistics.
Highlights:
• D-dimer, a fibrin degradation product traditionally used for diagnosing vascular disease; with the onset of COVID-19, it became clear that this biomarker goes much further.
• Many biomarkers have similar kinetics in homogeneous groups. However, for analytes that do not follow this rule, classical measures of position, dispersion, and statistical methods with univariate analyses do not show adherence.
• The use of multivariate statistics with exploratory machine learning techniques for a holistic and integrated analysis of different experiments with this biomarker is suggested since its behavior is highly individual, not allowing analysis by means and classic univariate statistics.
Funding details
There was no funding for this study.
Data availability statement
All data generated or analyzed during this study are included in this published article (and its supplementary information files).
Author contributions
LCOG and AMMN conceived and designed the study. LCOG, ELF and AMMN collected the data. LCOG, ELF, RJSB, RLN, ACHF, FRCGV and AMMN analyzed the data and wrote the manuscript. All authors read and provided critical feedback on the manuscript prior to approval.
Acknowledgement
None.
Conflict of Interest
The authors report there are no competing interests to declare.
References
- Adriana Bassini-Cameron, Eric Sweet, Altamiro Bottino, Christina Bittar, Carlos Veiga, et al. (2007) Effect of caffeine supplementation on haematological and biochemical variables in elite soccer players under physical stress conditions. British Journal of Sports Medicine 41(8): 523-530.
- A Bessa, M Nissenbaum, A Monteiro, P G Gandra, L S Nunes, et al. (2008) High-intensity ultraendurance promotes early release of muscle injury markers. British Journal of Sports Medicine 42(11): 889-893.
- Luis C Gonçalves, Artur Bessa, R Freitas-Dias, Rafael Luzes, J P Saar Werneck-de-Castro, et al. (2012) A sportomics strategy to analyze the ability of arginine to modulate both ammonia and lymphocyte levels in blood after highintensity exercise. Journal of the International Society of Sports Nutrition 9(1): 1-9.
- WS Coelho, LV Castro, Elizabeth D, Alexandre MF, Adriana B, et al. (2016) Investigating the Cellular and Metabolic Responses of World-Class Canoeists Training: A Sportomics Approach. Nutrients 8(11): 719.
- JS Silva Lopes, AMM Neto, LCO Gonçalves, PR Lourenço Alves, AC Almeida, et al. (2019) Kinetics of Muscle Damage Biomarkers at Moments Subsequent to a Fight in Brazilian Jiu-Jitsu Practice by Disabled Athletes. Frontiers in Physiology 10(1055): 1-9.
- LCO Gonçalves, AM Magalhães-Neto, A Bassini, ES Prado, R Muniz-Santos, et al. (2022) Sportomics suggests that albuminuria is a sensitive biomarker of hydration in cross combat. Scientific Reports 12(1): 8150.
- JI Weitz, JC Fredenburgh, JW Eikelboom, et al. (2017) A test in context: D-dimer. J Am Coll Cardiol 70(19): 2411-2420.
- PJ Gaffney, DA Lane, VV Kakkar, M Brasher (1975) Characterisation of a soluble D dimer-E complex in crosslinked fibrin digests. Thromb Res 7(1): 89-99.
- AA Musialkovskaia, EL Khodorova, TM Pozdniakova (1976) Isolation of the fragment D dimer from stabilized fibrin and a study of its antipolymerization action. Ukr Biokhim Zh 48(2): 139-143.
- JM Carr, M McKinney, J McDonagh (1989) Diagnosis of disseminated intravascular coagulation. Role of D-dimer. Am J Clin Pathol 91(3): 280-287.
- Linkins LA, Lapner ST (2017) Review of D-dimer testing: Good, Bad, and Ugly. Int J Lab Hematol 1: 98-103.
- D Dindo, S Breitenstein, D Hahnloser, B Seifert, S Yakarisik, et al. (2009) Kinetics of D-dimer after general surgery. Blood Coagul Fibrinolysis 20(5): 347-352.
- ED Johnson, JC Schell, GM Rodgers (2019) The D-dimer assay. American Journal of Hematology 94(7): 833-839.
- Rostami M, Mansouritorghabeh H (2020) D-dimer level in COVID-19 infection: a systematic review. Expert Rev Hematol 13(11): 1265-1275.
- M Meyer, S Sundaram, IS Zoppoth (2018) Exertional and Cross fit-induced rhabdomyolysis. Clin J Sports Med 28(6): e92-e94.
- E K Zadow, CM Kitic, SS Xuan W, J William Fell, MJ Adams, et al. (2018) Time of day and short-duration high-intensity exercise influences coagulation and fibrinolysis. Eur J Sport Sci 18(3): 367-375.
- BA Parker, AL Augeri, JA Capizzi, KD Ballard, BR Kupchak, et al. (2012) Effect of marathon run and air travel on pre- and post-run soluble d-dimer, microparticle procoagulant activity, and p-selectin levels. Am J Cardiol 109(10): 1521-1525.
- S Skinner, ED Ryan, HC Stafford, RG McMurray, NS Key, et al. (2020) An exploratory study of the effects of strenuous exercise on markers of coagulation activation, circulating microparticles, and inflammation in sickle cell trait. E J Haem 1(1): 251-254.
- T Hilberg, D Prasa, J Stürzebecher, Doreen Gläser, K Schneider, et al. (2003) Blood coagulation and fibrinolysis after extreme short-term exercise. Thromb Res 109(5-6): 271-277.
- T Hilberg, D Gläser, C Reckhart, D Prasa, J Stürzebecher, et al. (2003B) Blood coagulation and fibrinolysis after long-duration treadmill exercise controlled by individual anaerobic threshold. Eur J Appl Physiol 90(5-6): 639-642.
- Cohen J (1992) Quantitative methods in psychology. A power primer. Psychological Bulletin 112(1): 155-159.
- Fruchterman TMJ, Reingold EM (1991) Graph Drawing by Force-directed Placement. Software – Practice and Experience 21(11): 1129-1164.
- AMM Neto, MVA Verli, AMWH Freitas, EP Silva, GS Jesus, et al. (2021) Uma revisão narrativa da tríade stress, células NK e dímero D. Brazilian Journal of Development 7(1): 2228-2239.
- Galvão AS, MKM Gomes, NCS Freitas, LS Macedo, DM Oliveira, et al. (2023) Machine learning in sports medicine: A new approach in human exercise. Journal of Human Sport and Exercise 18(2): 501-508.
-
Luis Carlos Oliveira Gonçalves*, Eduardo Luzia França, Rafael Joviano Souza de Barros and Roberto Lohn Nahon. Analysis Of Plasma D-Dimer Behavior After A HIIT Session By Machine Learning Exploratory Technique. Aca J Spo Sci & Med. 1(2): 2023. AJSSM.MS.ID.000506.
-
Osteoporosis, Chronic pain, Psychological, Diagnosis, Holistic
-

This work is licensed under a Creative Commons Attribution-NonCommercial 4.0 International License.


