 Research Article
Impacts of the Asian Australian Monsoon and Indo Pacific Sea Surface Temperature on Urban Climates in Major Indonesian Cities for Low Carbon Building Design
Radyan Putra Pradana1,2 *, Han Soo Lee3,1*, Tetsu Kubota1, Vinayak Bhanage1, Faiz Rohman Fajary1,7, Hideyo Nimiya4, I Dewa Gede Arya Putra4,2, Mohamad Husein Nurrahmat2, Mochamad Riam Badriana8, Reza Abdullah1,9, Ardhasena Sopaheluwakan5 and Muhammad Nur Fajri Alfata6
1Transdisciplinary Science and Engineering Program, Graduate School of Advanced Science and Engineering, Hiroshima University, 1-5-1 Kagamiyama, Higashi-Hiroshima, Hiroshima 739-8592, Japan
2Center for Research and Development, Indonesian Agency for (BMKG), Jl. Angkasa I No. 2, Kemayoran, Jakarta, Indonesia
3Center for the Planetary Health and Innovation Science (PHIS), The IDEC Institute, Hiroshima University, 1-5-1 Kagamiyama, Higashi-Hiroshima, Hiroshima 739-8529, Japan
4Graduate School of Science and Engineering, Kagoshima University, 1-21-40, Korimoto, Kagoshima, 890-0065, Japan
5Indonesian Agency for Meteorology Climatology and Geophysics (BMKG), Jl. Angkasa 1 No.2, Kec. Kemayoran, Jakarta, 10610, Indonesia
6Division of Building Sciences, Directorate Engineering Affairs for Human Settlements, Ministry of Public Works, and Housing (PUPR), Jl. Panyawungan, Cileunyi, Bandung, Jawa Barat, 40622, Indonesia
7Atmospheric Science Research Group, Faculty of Earth Science and Technology, Institut Teknologi Bandung, Bandung, 40132, Indonesia
8Korea-Indonesia Marine Technology Cooperation Research Center (MTCRC), Cirebon, Indonesia
9Land Data and Information Center, Ministry of Agrarian and Spatial Planning/National Land Agency (K.ATR/BPN), Jl. Sisingamangaraja No.2, Selong, Kec. Kby. Baru, Kota Jakarta Selatan, Daerah Khusus Jakarta. 12110, Indonesia
Radyan Putra Pradana, Transdisciplinary Science and Engineering Program, Graduate School of Advanced Science and Engineering, Hiroshima University, 1-5-1 Kagamiyama, Higashi-Hiroshima, Hiroshima 739- 8592, Japan and Center for Research and Development, Indonesian Agency for (BMKG), Jl. Angkasa I No. 2, Kemayoran, Jakarta 10720, Indonesia. Han Soo Lee, Transdisciplinary Science and Engineering Program, Graduate School of Advanced Science and Engineering, Hiroshima University, 1-5-1 Kagamiyama, Higashi-Hiroshima, Hiroshima 739-8592, Japan and Center for the Planetary Health and Innovation Science (PHIS), The IDEC Institute, Hiroshima University, 1-5-1 Kagamiyama, Higashi-Hiroshima, Hiroshima 739-8529, Japan.
Received Date: March 23, 2024; Published Date: May 24, 2024
Abstract
Urban climate is formed as a consequence of impacts from various levels of climates ranging from the local and regional to the global levels.
In this study, we investigated the characteristics of the urban climate in twenty-two major cities in Indonesia and their relationships with regional
climate variability such as monsoons and sea surface temperatures (SSTs) based on a newly established climate classification (zones 1-4) for passive
cooling potential in building design. Daily precipitation, average air temperature at 2 m and relative humidity records were analysed by applying
lag correlation analysis and the improved complete ensemble empirical mode decomposition with adaptive noise (ICEEMDAN) method to examine
the monthly, seasonal, annual and interannual variabilities and the relationships with the Asian-Australian Monsoon and the Indo-Pacific Ocean
SST anomaly. The lag-correlation analysis clearly showed that seasonal variability in the climates of 22 major cities was associated with monsoonal
and remote SSTs, which varied from a lead lag of 0 to approximately 180 days, and the correlation coefficient ranged from 0.1 Keywords:Urban climate; Climate zone; Indian summer monsoon; Western north pacific monsoon; Australian summer monsoon; Indian Ocean
dipole; ENSO; Empirical mode decomposition
Introduction
Cities or urban areas, as centres of economic activity, act as significant contributors to greenhouse gas emissions globally [1-3]. Currently, the global population is still growing, albeit at a reduced rate. In 2022, the Eastern and Southeastern parts of Asia were the world’s two most populous regions, with approximately 2.342 billion people and representing 29% of the global population; according to the middle scenario, the population was projected to increase slightly to 2.372 billion people in 2030 and then slightly decrease to 2.317 billion people in 2050 [4]. Moreover, 6.4 billion people, or 70% of the global population, are projected to live in urban areas by 2050 [5]. Consequently, environmental problems due to dweller activities have emerged as an impact of economic development fuelled by urbanization [6].
Urban warming is caused by urbanization’s impact on local weather and climate combined with the effects of global warming; it results in altered mean and minimum temperatures, directly influencing high urban temperatures and increasing the energy requirements for cooling [7]. Clearly, anthropogenic factors such as urbanization and industrialization will trigger high energy consumption for living. In addition, using air conditioning systems in buildings leads to high energy consumption rates [8-10]. This is a challenging part of reducing energy demand, whereby implementing passive cooling techniques to obtain a comfortable indoor thermal environment is needed to mitigate urban warming and climate change.
Appropriate passive cooling techniques can be adaptively implemented after investigating the various characteristics of local climatic conditions [11-17]. The local climate is the specific condition to be addressed in different regions, such as high-, middle-, or low-latitude regions, and the sensitivity of teleconnections to regional climate variability, such as monsoons [18-22], the El Nino Southern Oscillation (ENSO) [23-27], and the Indian Ocean Dipole Mode (IOD) [28, 29], also needs to be addressed, especially in the hot-humid climate regions of Southeast Asian countries, such as Indonesia.
Indonesia is an archipelagic country known as an “Equatorial Emerald” between the Indian and Pacific Oceans and the Asian and Australian continents; these regions have very complex and dynamic physical characteristics of land-ocean-atmosphere interactions [30, 31]. Trade winds blow from the northeast and the southeast to the equator and are loaded heavily with moisture that evaporates from the Pacific and Indian Oceans. Consequently, the presence of high-density tropical rainforests near the equator in Indonesia results in high amounts of rain due to winds [32].
In general, almost all Indonesian regions are in monsoon-affected areas [18, 19]. Most of those previous studies used a monsoon index to quantify monsoon variability in various regions of the world [20-22]. Several previous studies have also revealed the impacts of interannual variabilities in ENSO and the IOD mode over the Indonesian region [23-30]. Most related studies have focused on the influence of both ENSO and the IOD mode on rainfall in the region and on the effects of these modes on the agricultural sector [33], health sector [34, 35] and occurrence of forest fires [36, 37]. However, none of those studies directly linked those phenomena to the passive cooling potential of suitable low-carbon building designs for Indonesia.
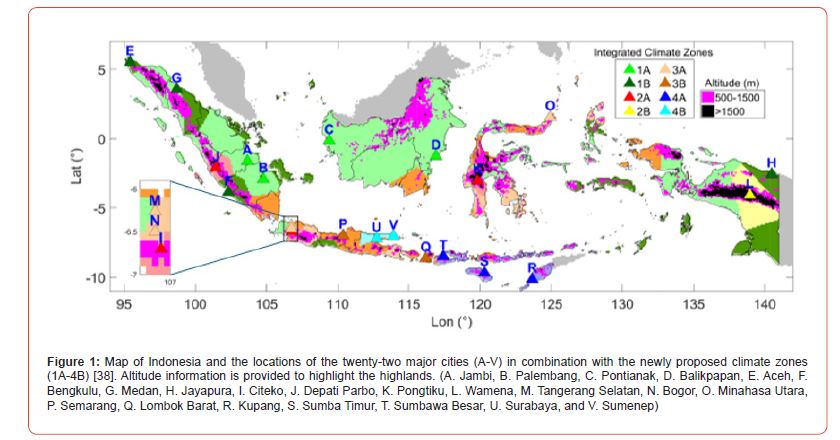
Putra, et al. [38] recently proposed a novel climate classification system for passive cooling potential across Indonesia based on detailed data analyses of hourly weather records from 106 meteorological stations of the Indonesia Met Service (BMKG) for Indonesia. The new classification by Putra, et al. [38] was developed by considering the outputs of principal component analysis (PCA) and cluster analysis of eight climate factors (global horizontal irradiance, air temperature, wind speed, relative humidity, precipitation, atmospheric pressure, total cloud cover, and mixing ratio), and divides the country into 8 climate zones, namely, the equatorial (1A), subequatorial (1B), highland tropical (2A), very highland tropical (2B), monsoonal (3A), savanna (4A) subsavanna (4B), and sub-savanna (4B) zones (Figure 1). The new classification is designed for passive cooling potential and differs from the widely used Köppen-Geiger classification [39, 40] which is based on vegetation patterns, air temperatures and rainfall. Based on the resulting climate zones, Putra, et al. [38] described climate zones 3A (monsoonal), 4A (savanna), and 4B (subsavanna) as suitable for the comfort ventilation method. Moreover, zone 1B (subequatorial) is appropriate for applying passive cooling methods by combining night ventilation and comfort ventilation.
As described, Indonesia is affected by regional climate variabilities, such as the Asian-Australian monsoon system, the ENSO, and the IOD mode. The relationships between regional climate variabilities and weather conditions in major cities for each new classification have yet to be investigated. Evaluation of these relationships is critical for understanding the characteristics of the newly proposed climate classifications.
The objectives of this study were to investigate the characteristics of the urban climate in 22 major cities by evaluating the relationships between urban weather elements and regional climate variability and to determine the characteristics of each climate zone from Putra, et al. [38] for estimating the passive potential of Indonesia. This paper is arranged in six sections, with a brief description of the new climate classification in the next section. Section 3 describes the data and methods used in this study. The final three sections 4 to 6 present the results, discussion, and conclusion.
Materials and Methodology
Material
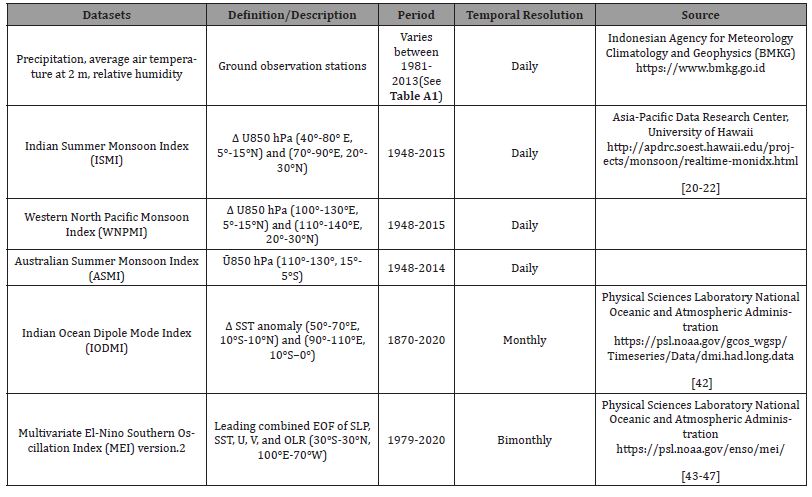
Three daily weather elements (precipitation, average air temperature at 2 m, and relative humidity) for 22 major cities in Indonesia were collected and used in the analysis (Figure 1). The twenty-two major cities are defined by demographic profiles [41], and associated with the new climate classification by Putra et al. [38]. For the regional climate variability in this study, we considered five regional climate phenomena such as the Indian Summer Monsoon, Western North Pacific Monsoon, Australian Summer Monsoon, Indian Ocean Dipole, and El Niño/Southern Oscillation, represented by the corresponding Indian Summer Monsoon Index, Western North Pacific Monsoon Index, Australian Summer Monsoon Index, Indian Ocean Dipole Mode, and Multivariate El Niño/ Southern Oscillation Index version 2. Table 1 shows the summary of data used in the analysis. Table A1 provides a summary of the three daily weather records from BMKG, Indonesia, for the major cities. The observation period varies from the longest data, 1981-2013 (32-year period), for Palembang, Balikpapan, Medan, Tangerang Selatan, Semarang, Sumbawa Besar, and Sumenep to the shortest data from Wamena during 2002-2013 (11-year period), including missing values.
Table 1: Summary of the dataset used in this study, including precipitation, average air temperature at 2 m, relative humidity, and regional climate indices.
Methodology
Evaluation of the relationship between daily urban weather elements and regional climate variability was conducted in two steps, with time-lagged cross-correlation analysis for monthly and seasonal variabilities and time-series analysis with signal decomposition for annual and interannual variabilities.
Cross-correlation
The cross-correlation functions measure the associations between signals; thus, the degree of similarity between two sets of numbers can be quantified. When two timeseries datasets are cross correlated, a measure of temporal similarity is achieved [48]. A negative correlation indicates that the two time series have an inverse relationship. As one curve increases, the other decreases.

where N is the number of data points in each data series, xi is the ith data point of the first data series (daily timeseries of weather elements), yi is the ith data point of the second data series (regional climate indices), and rxy is the correlation. Then, one of the curves is shifted relative to the other. The number of data points for the shifted signal is called the lag and is denoted by . In this study, cross-correlation analysis was used to identify the differences in lead-lag times with respect to how the regional climate influences the local climate in cities.
Empirical mode decomposition (EMD) and its variations
The division of a signal into its constituent parts is called decomposition. Apart from the popular decomposition methods, the Fourier transform and the wavelet transform [49-52], EMD is an adaptive method empirically based on a concise mathematical foundation, and suitable for nonstationary and nonlinear data/time series [53, 54]. Numerous versions of EMD have been developed, including ensemble EMD (EEMD), complete EEMD with adaptive noise (CEEMDAN), and improved CEEMDAN (ICEEMDAN).
EMD breaks down a time series x(t) into intrinsic mode functions (IMFs) based on the following algorithm [53-55].

The outcome of the initial screening process is the IMF candidate.
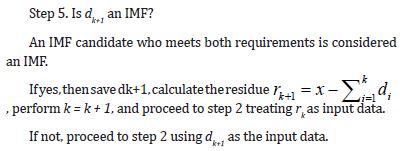
Step 6. The procedure keeps on until the last residue rk meets the specified stopping requirement.
Steps 2 to 5 are the steps for determining the modes of IMF, known as the sifting process.
Following the breakdown of a signal into a set of IMFs in ascending order using daily weather elements (precipitation, average air temperature at 2m, and relative humidity) and regional climate indices (ISMI, WNPMI, AUSMI, IODM, and MEI), the IMFs will display the corresponding descending frequency, and each IMF will display the specific information of the signal in the time domain.
Improved complete ensemble EMD with adaptive noise (ICEEMDAN)
In the following algorithm [55].

Data analysis process
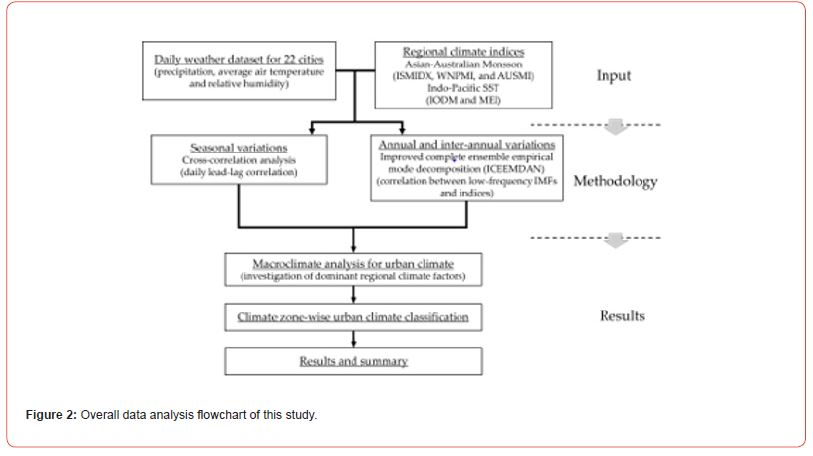
The daily weather element records for the 22 cities in Table A1 was first checked for the missing values. The missing data in the daily time series were treated with the mean value imputation method. To address the effects of regional climate variability on the local climates of the cities, the cross-correlation method was used to analyse the lead-lag correlations in the seasonal variations between weather elements and the regional climate. Then, ICEEMDAN was applied to decompose the daily weather records and the climate indices into IMFs and to investigate the relationships between the relatively low-frequency IMFs from the daily weather records and the low-frequency modes with 2-year or longer mean periods from the climate indices. Then, the analytical results are summarized with respect to monthly, seasonal, annual and interannual variations in the local climate of the cities for the relationship with the dominant impacting regional climate phenomena. The data analysis flowchart is presented in Figure 2.
Results
Monthly and seasonal variabilities
Precipitation
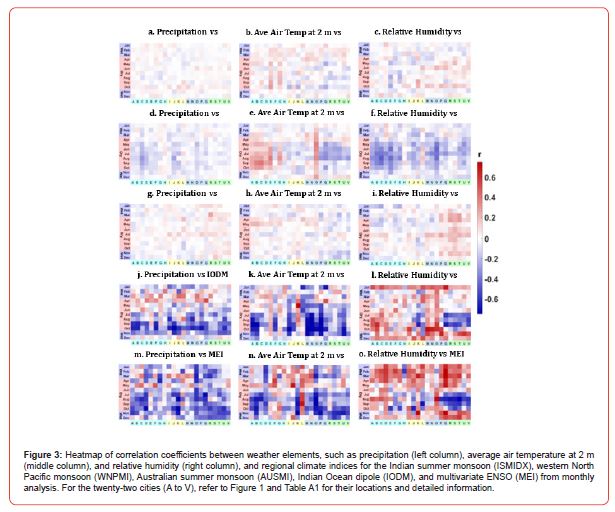
With respect to precipitation, there is an unclear relationship between precipitation and monsoons in all the major cities, with very low monthly correlation coefficients, as shown in the left column of Figure 3. Moreover, the influence of the Indo-Pacific SST is stronger than that of monsoons on precipitation, which was observed in a previous study [26].
Precipitation and the IOD mode have relatively strong negative and positive correlations, respectively, in most of the major cities in comparison with the monsoons. There were mostly negative correlations between precipitation and ENSO during JJA and SON in most of the major cities.
Average air temperature at 2 m
The middle column of Figure 3 illustrates the varied response of the average air temperature at 2 m in the major cities in Indonesia to the Indian Summer Monsoon, particularly during the dry season. During the transition period from dry to wet (October to November), it reveals a clear positive correlation in the strong (weak) phase, then followed by the high (low) average air temperature at 2 m. Most of the major cities exhibited positive correlations in February.
The average air temperature at 2 m in most of the major cities in Sumatera and on the Kalimantan Islands demonstrated clear positive correlations with the western North Pacific monsoon during the dry season. In contrast, clear negative correlations were found for all the major cities in East Nusa Tenggara and East Java Islands, with different transition onset times obtained depending on the topography and geographical position. Moreover, the relationship between the average air temperature at 2 m and the Australian summer monsoon yield unclear correlations for all 22 major cities, with a monthly correlation coefficient lower than 0.22.
The IOD mode shows negative and positive correlations with the average air temperature at 2 m during JJA and SON, respectively, in most of the major cities with various onset times. Moreover, the ENSO influence during the peak of the dry season starts in June or July in most of the major Indonesian cities.
Relative humidity
Most of the major cities in Indonesia, such as in a part of Java, Sulawesi, West Nusa Tenggara, and the East Nusa Tenggara Islands, and several parts of the highland cities, depict clear positive correlations between relative humidity and the Indian summer monsoon during the dry season (Figure 3, right column).
The relative humidity in most of the major cities exhibited negative correlations with the western North Pacific monsoon during the dry season. Moreover, the response of relative humidity to the Australian summer monsoon is clearly visible in major cities, which are under the Australian summer monsoon domain, especially for the major cities in zones 3B, 4A, and 4B. There is a dominant positive correlation throughout the year. On the other hand, there is an unclear pattern for the other remaining cities. However, a positive correlation peak occurs in July during the dry season for all the major cities.
The IOD mode, defined as the sea surface temperature gradient between the western Indian Ocean (Arabian Sea) and the eastern Indian Ocean from west to south in Indonesia, affects the changes in moisture and air in major Indonesian cities. According to the correlation coefficient, the responses of relative humidity to the IOD mode depending on whether the phase of the IOD mode is positive or negative. Several major cities showed a clear negative correlation, which was an opposite response to the Australian summer monsoon (positive correlation), especially from July to September in zones 3B, 4A, and 4B.
The relative humidity and ENSO forcings have relatively similar patterns to those of the IOD mode. However, the patterns are clearer and more significant in almost all the major cities than in the IOD mode.
Lag-correlation analysis
Precipitation
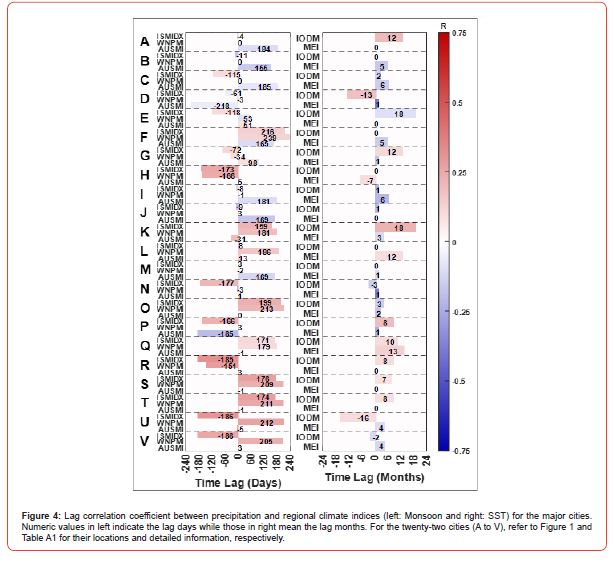
Precipitation had the lowest correlation with the regional climate indices of the three weather elements as described. Most of the cities had very low to low correlation values, ranging from 0 to 0.4 (Figure 4).
In general, the responses of precipitation to monsoons and SSTs in major cities vary. The highest correlation with Indian Summer Monsoon was obtained in Kupang (R) (0.32) within lead 185 days, with Western North Pacific Monsoon (0.28) within lead 151 days, Australian Monsoon (0.34) within lag 3 days, Indian Ocean Dipole Mode (-0.27) within lead-lag 0 month found in Tangerang Selatan (M), and with ENSO (-0.4) within lag 1 month found in Balikpapan (D).
Average air temperature at 2 m
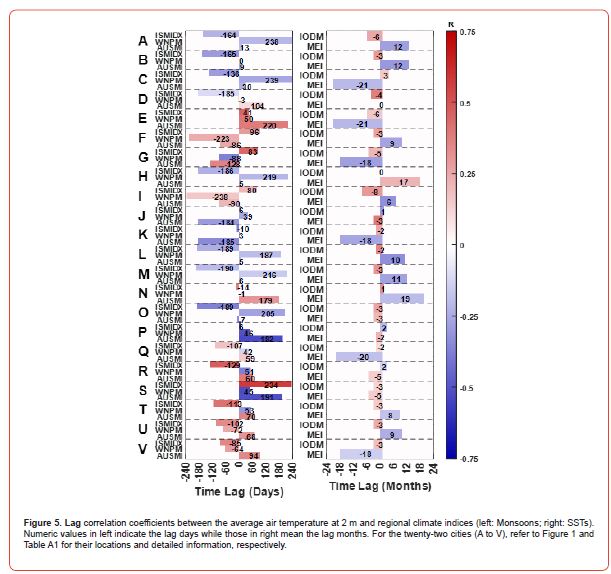
The average air temperature at 2 m was more strongly correlated with the regional climate indices than was the precipitation in most of the cities. Some cities exhibited moderate correlations, ranging from 0.4 to 0.7, with various lead-lag timeframes (Figure 5).
In general, the response of the average air temperature at 2 m to monsoons and SSTs in major cities varied. The highest correlations with the Indian summer monsoon were obtained in Semarang (P) and Sumba Timur (S) (0.57) within lag 6 and 234 days, with the Western North Pacific Monsoon (-0.53) within lag 45 days found in Sumba Timur (S), with the Australian Monsoon (-0.53) within lag 192 days found in Semarang (P), for the IOD Mode (0.37) within lag 4 months obtained in Balikpapan (D), and for the ENSO (-0.39) within lead 3 months in Depati Parbo (J).
Relative Humidity
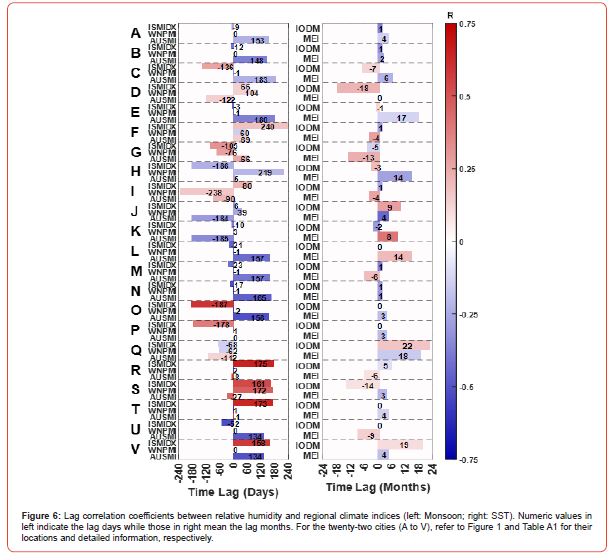
The RH presented the highest correlations, with the regional climate indices being compared with the precipitation and average air temperature at 2 m. Some cities exhibit moderate correlation values, ranging from 0.4 to 0.7, and various lead-lag timeframes (Figure 6).
In general, the responses of relative humidity to monsoons and SSTs in major cities varied. The highest correlation with the Indian Summer Monsoon was obtained in Kupang (R) (0.65) within lag 175 days, with the Western North Pacific Monsoon (-0.61) within lag 1 day in Sumbawa Besar (T), with the Australian Monsoon (0.56) within lead 8 days in Kupang (R), with the Indian Ocean Dipole Mode (-0.39) within lead-lag 0 months in Wamena (L), and with the ENSO (-0.44) within lag 4 months found in Depati Parbo (J).
Annual and interannual variabilities
Precipitation
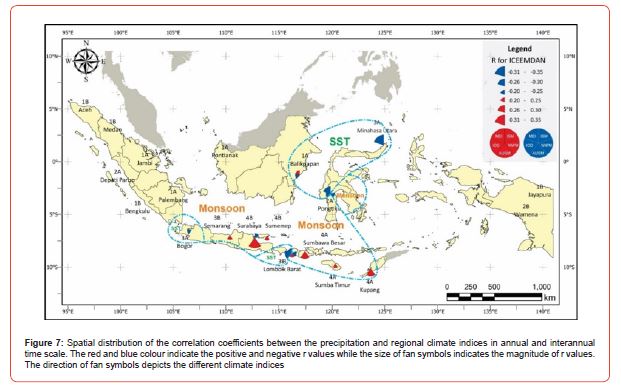
In Figure 7, the influence of regional climate phenomena on precipitation in annual and interannual variability is concentrated in the southern region of Indonesia, viz., Bogor, Semarang, Surabaya, Sumenep, Lombok Barat, Sumbawa Besar, Sumba Timur, and Kupang, mainly affected by Australian monsoon. Then, some parts of Kalimantan (Balikpapan) and Sulawesi Island (Pongtiku and Minahasa Utara) were established. The highest correlation coefficients are in Surabaya and Minahasa Utara. The precipitation in Surabaya is most affected by the Australian monsoon r=0.3 within approximately 1.1 years of the mean period, while that in Minahasa Utara is affected by the ENSO r=0.31 approximately 2.7 years of the mean period.
Average air temperature at 2 m
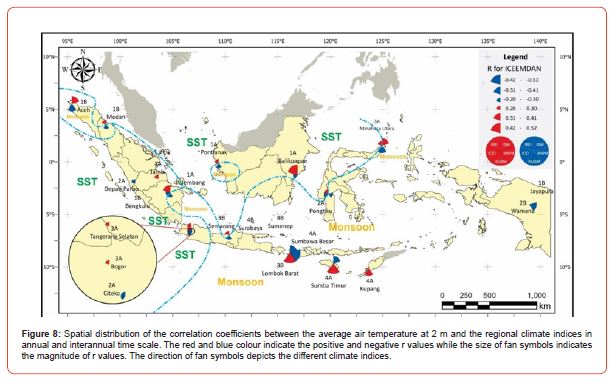
In Figure 8, the influence of climate indices on the average air temperature at 2 m is depicted for most of the Indonesia area, as indicated by the variable correlation values. The highest correlation values were shown for the Lombok Barat (Australian Monsoon and Western North Pacific Monsoon), Sumba Timur (Australian Monsoon), and Balikpapan (ENSO) Rivers.
Relative humidity
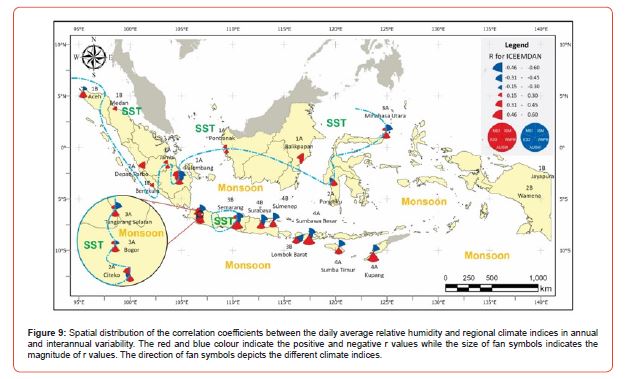
In Figure 9, the influence of climate indices on relative humidity is spread out in most of the Indonesia area, where the correlation coefficient is the similar with that of the average temperature at 2 m, except on Papua Island. The highest correlation values can be observed at Semarang, Sumbawa Besar and Kupang cities, affected by the Australian summer monsoon.
Relationships with the New Climate Classifications
Seasonal Variability
The lag-correlation analysis revealed the seasonal variations
in major city climates (represented by precipitation, average air
temperature at 2 m, and relative humidity) associated with monsoons
and remote SSTs. The lead-lag time in the analysis provides
predictions of the season onset and the possibility of occurrence of
climate anomalies caused by macroclimate phenomena on a seasonal
scale. Figures 4-6 clearly show that the seasonal variability
pattern cycle from the Asian-Australian monsoon influence on major
cities’ climates is more obvious in describing the periodicities of
occurrences regularly than that from the remote Indo-Pacific SST.
The seasonal cycles varied from a lead lag of 0 to approximately
180 days. This clearly corresponds to the Asian-Australian Monsoon
cycle [18, 56, 57], which occurs every 6 months on average,
and the air mass moves from the high-pressure region (cold) to the
low-pressure region (hot) in accordance with the Buys Ballot Law.
The correlation coefficient for precipitation is 0 The result of ICEEMDAN decomposition analysis delineates
22 major cities into distinct regions to represent the cities that are
most affected by the Asian-Australian Monsoon (Monsoon region)
and Indo-Pacific Sea Surface Temperature (SST region), as shown in
Figures 7-9; these regions have a characteristic annual to interannual
cycle of precipitation, an average air temperature of 2 m and
relative humidity. The influences of monsoons and remote SSTs on
precipitation are summarized in Figure 7. Bogor (zone 3A), Balikpapan
(zone 1A), and Minahasa Utara (zone 3A) are grouped into
the SST-influenced region. Moreover, Semarang (zone 3B), Surabaya
(zone 4B), Sumenep (zone 4B), Sumbawa Besar (zone 4A), Sumba
Timur (zone 4A), and Kupang (zone 4A) are grouped into the
monsoon-influenced region. Then, the remaining cities, Lombok
Barat (zone 3B) and Pongtiku (zone 2A), are grouped into the monsoon-
SST-influenced region (combination). The influence of the monsoon and remote SST on the average
air temperature at 2 m is summarized in Figure 8. Depati Parbo
(zone 2A), Jambi (zone 1A), Tangerang Selatan (zone 3A), Bogor
(zone 3A), Citeko (zone 2A), and Balikpapan (zone 1A) are considered
to be in the SST-influenced region. Aceh (zone 1B), Lombok
Barat (zone 3B), Sumba Timur (zone 4A), Kupang (zone 4A), and Wamena (zone 2B) are considered to be monsoon-influenced regions.
Moreover, for the remaining cities, Medan (zone 1B), Palembang
(zone 1A), Semarang (zone 3B), Pontianak (zone 1A), Pongtiku
(zone 2A), and Minahasa Utara (zone 3A) are considered to be in
the Monsoon-SST-influenced region (combination). Finally, the influence of macroclimate on relative humidity is
summarized in Figure 9. Medan (zone 1B), Depati Parbo (zone 2A),
Bengkulu (zone 1B) and Balikpapan (zone 1A) are classified as being
in the SST-influenced region. Aceh (zone 1B), Surabaya (zone
4B), Sumenep (zone 4B), Lombok Barat (zone 3B), Sumbawa Besar
(zone 4A), Sumba Timur (zone 4A), and Kupang (zone 4A) are classified
as being in the monsoon-influenced region. The remaining
cities, including Jambi (zone 1A), Palembang (zone 1A), Pongtiku
(zone 2A), Minahasa Utara (zone 3A), Semarang (zone 3B), Tangerang
Selatan (zone 3A), Bogor (zone 3A), and Citeko (zone 2A),
are classified as being in the SST-monsoon-influenced region. The
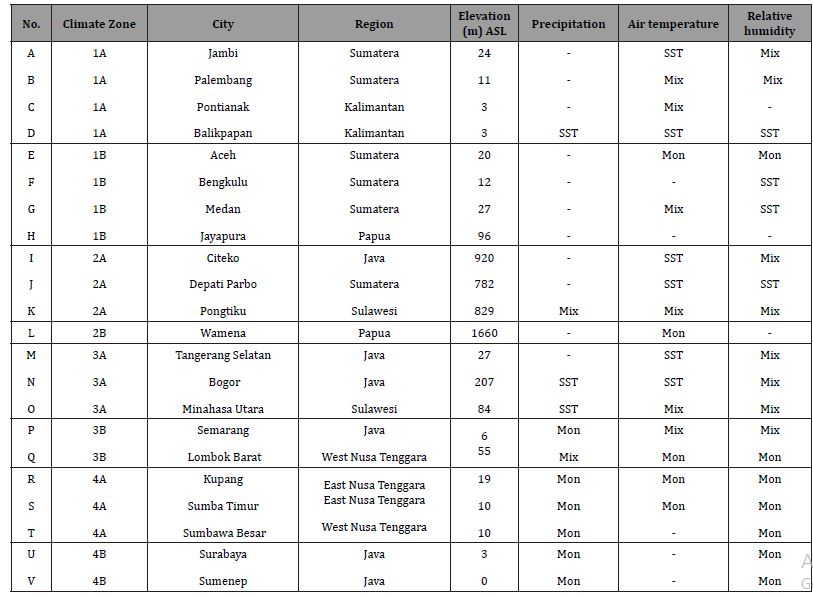
classification of the monsoon, SST, and combination-influenced regions
is summarized in Table 2. The results of this study are consistent with those of previous
studies, in which extreme indices in Indonesia were investigated
based on the rainfall regime [18, 24, 58]; the annual rainfall patterns
in Indonesia were divided into three types: monsoonal region,
equatorial region, and anti-monsoonal region [29]. In particular,
the major cities that are part of monsoonal region are the clearest
regions in which a significant correlation occurs between the three
climate factors (precipitation, average air temperature at 2 m, and
relative humidity) and the monsoons and remote SSTs, whereas the
major cities in equatorial region and anti-monsoonal region [29]
have various correlation coefficients and periodicity means (Figures
7-9). Table 2:Summary of the 22 major cities grouped into Monsoon and SST regions in annual and interannual variability. SST, Mon, and Mix below indicate
SST-influenced region, monsoon-influenced region, and monsoon-SST-influenced region (combination), respectively. Urban climate characteristics, as a response to regional climate
variability in 22 major cities in Indonesia, are investigated from
seasonal to interannual timescales in relation to the new urban climate
classification by Putra, et al. [38] to understand how the urban
climate of each city is influenced by regional climate variability. For precipitation, in the major cities in zones 1A and 1B, a consistent
relationship was found between seasonal and interannual
variabilities and regional climate phenomena. Nearly all the major
cities in zones 1A and 1B remain unaffected by monsoons. However,
during the annual cycle, Balikpapan is considered to be the only
major city affected dominantly by ENSO (0.24) and the IOD mode
(-0.2), even though the city is categorized as having a low correlation. In zones 2A and 2B, the seasonal cycle is influenced more by
ENSO and the IOD mode. However, Citeko is also influenced by
monsoons in this zone. For the annual cycle, Pongtiku is influenced
mainly by the western North Pacific monsoon, the IOD mode and
ENSO in this zone. In zones 3A and 3B, the seasonal cycle pattern is influenced by
monsoons. However, the annual cycle in zone 3 is dominantly influenced
by the SST in Bogor and North Minahasa, while Semarang is
affected by the Australian Summer Monsoon, and Lombok Barat is
influenced by the Western North Pacific Monsoon, Australian Summer
Monsoon, the IOD mode and ENSO. In zones 4A and 4B, all the major cities are clearly influenced by
the monsoon only during their seasonal and annual cycles, dominantly
by the Australian summer monsoon. Regarding the average air temperature at 2 m and relative humidity,
most of the major cities in zones 1A and 1B are influenced
equally by monsoons and SST, with a consistently small magnitude
for seasonal and annual cycles. Most of the major cities in zones 2A
and 2B are influenced by monsoons and SST during the seasonal
cycle. The annual cycle is dominated by the SST for both the average
air temperature at 2 m and the relative humidity. In zones 3A
and 3B, the influence of the monsoon is clearly more dominant than
the influence of the SST during the seasonal cycle. In zones 4A and
4B, all the major cities in this zone are affected by monsoons only
during their seasonal cycles, and the Australian summer monsoon
dominantly affects the annual cycle. The local climate characteristics and influencing regional climate
factors monsoon and SST variations in the cities help us understand
the characteristics of urban microclimate of each city,
assess the passive cooling potential and design the appropriate
passive cooling techniques in each city in Indonesia. This study focused mainly on the influence of the Asian-Australian
Monsoon and Indo-Pacific SST. Other phenomena, such as the
Madden–Julian Oscillation (MJO), intertropical convergence zone
(ITCZ), and convectively coupled equatorial waves (CCEWs), may
significantly impact the urban climate in major Indonesian cities
in various time scale and should be further studied. Future studies
should also quantify the effects of urbanization and urban growth
on urban microclimates and thermal environments in major Indonesian
cities via numerical experiments. This research was conducted by the Climate Research Group
for the Development of Standard Weather Data as part of the Development
of Low-Carbon Affordable Apartments in the Hot-Humid
Climate of Indonesia Project toward the Paris Agreement 2030,
Science and Technology Research Partnership for Sustainable Development
(SATREPS), which is collaboratively supported by the Japan
Science and Technology Agency (JST), the Japan International
Cooperation Agency (JICA), Hiroshima University, Kagoshima University,
the Ministry of Public Works and Housing (PUPR) of Indonesia,
and the Indonesian Agency for Meteorology Climatology and
Geophysics (BMKG). The authors declare that they have no conflicts of interest. This research was supported by the Science and Technology
Research Partnership for Sustainable Development (SATREPS) in
collaboration with the Japan Science and Technology Agency (JST,
JPMJSA1904) and the Japan International Cooperation Agency
(JICA). Table A1. Table 3:Summary of daily weather element observations at twenty-two major cities in Indonesia.Annual and Interannual Variabilities
Conclusion
Acknowledgements
Conflicts of Interest
Funding
Appendix A

References
- TM Butler, MG Lawrence, BR Gurjar, J van Aardenne, M Schultz, et al. (2008) The representation of emissions from megacities in global emission inventories. Atmos Environ 42(4): 703-719.
- RM Duren, CE Miller (2012) Measuring the carbon emissions of megacities. Nat. Clim Chang 2(8): 560-562.
- PJ Marcotullio, A Sarzynski, J Albrecht, N Schulz, J Garcia (2013) The geography of global urban greenhouse gas emissions: An exploratory analysis. Clim Change 121(4): 621-634.
- United Nations Department of Economic and Social Affairs, Population Division (2022). World Population Prospects 2022: Summary of Results. UN DESA/POP/2022/TR/NO. 3.
- S Dhakal (2010) GHG emissions from urbanization and opportunities for urban carbon mitigation. Curr Opin Environ Sustain 2(4): 277-283.
- United Nations, Department of Economic and Social Affairs, Population Division (2019). World Urbanization Prospects: The 2018 Revision (ST/ESA/SER.A/420). New York: United Nations.
- Trihamdani AR (2017) Urban Climate Challenges in Growing Cities of Southeast Asia: Urban Heat Islands and Global Warming. Ph.D. dissertation/thesis., Hiroshima University, Hiroshima, Japan, September 1.
- LW Davis, PJ Gertler (2015) Contribution of air conditioning adoption to future energy use under global warming. Proceedings of the National Academy of Sciences 112(9): 5962-5967.
- S Kindaichi, D Nishina, S Murakawa, M Ishida, M Ando (2017) Analysis of energy consumption of room air conditioners: An approach using individual operation data from field measurements. Applied Thermal Engineering 112: 7-14.
- R Saidur (2009) Energy consumption, energy savings, and emission analysis in Malaysian office buildings. Energy Policy., 37(10): 4104-4113.
- R Lapisa, E Bozonnet, P Salagnac, MO Abadie (2018) Optimized design of low-rise commercial buildings under various climates – Energy performance and passive cooling strategies. Building and Environment 132: 83-95.
- ASF Ahmed, KMMK Khan, AA Maung Than Oo, RMG Rasul (2014) Selection of suitable passive cooling strategy for a subtropical climate,” International Journal of Mechanical and Materials Engineering 9(1): 1-11.
- J Rincón, N Almao, E. González (2001) Experimental and numerical evaluation of a solar passive cooling system under hot and humid climatic conditions. Solar Energy 71(1): 71-80.
- K Panchabikesan, K Vellaisamy, V Ramalingam (2017) Passive cooling potential in buildings under various climatic conditions in India. Renewable and Sustainable Energy Reviews 78: 1236-1252.
- S Medved, C Arkar (2008) Correlation between the local climate and the free-cooling potential of latent heat storage. Energy and Buildings 40(4):429-437.
- MA Hamdan, J Yamin, EM Abdel Hafez (2012) Passive cooling roof design under Jordanian climate,” Sustainable Cities and Society 5(1): 26-29.
- A Tejero González, M Andrés Chicote, P García Ibáñez, E Velasco Gómez, FJ Rey Martínez (2016) Assessing the applicability of passive cooling and heating techniques through climate factors: An overview. Renew Sustain Energy Rev 65: 727-742.
- E Aldrian, R Dwi Susanto (2003) Identification of three dominant rainfall regions within Indonesia and their relationship to sea surface temperature. Int J Climatol 23(12): 1435-1452.
- T Zhang, S Yang, X Jiang, P Zhao (2016) Seasonal-interannual variation and prediction of wet and dry season rainfall over the maritime continent: Roles of ENSO and monsoon circulation. J Clim 29(10): 3675.
- B Wang, Z Fan (1999) Choice of South Asian Summer Monsoon Indices. Bull Am Meteorol Soc 80(4): 629-638.
- B Wang, R Wu, KM Lau (2001) Interannual variability of the asian summer monsoon: Contrasts between the Indian and the Western North Pacific-East Asian monsoons. J Clim 14(20): 4073-4090.
- Y Kajikawa, B Wang, J Yang (2010) A multitime scale Australian monsoon index. Int J Climatol 30(8): 1114-1120.
- JRE Harger (1995) Air-temperature variations and ENSO effects in Indonesia, the Philippines and El Salvador. ENSO patterns and changes from 1866–1993. Atmos Environment 29(16): 1919-1942.
- E Aldrian, L Dümenil Gates, FH Widodo (2007) Seasonal variability of Indonesian rainfall in ECHAM4 simulations and in the reanalyses: The role of ENSO. Theoretical and Applied Climatology 87(1–4): 41–59.
- ARAs syakur, et al. (2014) Observation of spatial patterns on the rainfall response to ENSO and IOD over Indonesia using TRMM Multisatellite Precipitation Analysis (TMPA). International Journal of Climatology 34(15): 3825-3839.
- HS Lee (2015) General Rainfall Patterns in Indonesia and the Potential Impacts of Local Seas on Rainfall Intensity. Water 7 (12): 1751-1768.
- Q Xu, Z Guan, D Jin, D Hu (2019) Regional characteristics of interannual variability of summer rainfall in the maritime continent and their related anomalous circulation patterns. Journal of Climate 32(14): 4179-4192.
- Alsepan, S Minobe (2020) Relations between interannual variability of regional-scale Indonesian precipitation and large-scale climate modes during 1960–2007. Journal of Climate 33(12): 5271-5291.
- A Kurniadi, E Weller, SK Min, MG Seong (2021) Independent ENSO and IOD impacts on rainfall extremes over Indonesia. Int J Climatol 41(6): 3640-3656.
- MD Yamanaka (2016) Physical climatology of Indonesian maritime continent: An outline to comprehend observational studies. Atmos Res (178–179): 231-259.
- K Yoneyama, C Zhang (2020) Years of the Maritime Continent. Geophys Res Lett 47(12).
- Tan KH (2008) Soils in the Humid Tropics and Monsoon Region of Indonesia (1st ed.) CRC Press.
- Y Apriyana, Y Sarvina, ER Dewi, A Pramudia (2017) Farmer adaptation strategy in paddy field affected by climate variability in monsoon regions. Asian J Agric 1(01): 9-16.
- AS Gagnon, ABG Bush, KE Smoyer Tomic (2001) Dengue epidemics and the El Nino Southern Oscillation. Clim Res 19(1): 35-43.
- P Arcari, N. T Tapper (2017) The variable impact of ENSO events on regional dengue/DHF in Indonesia. Singapore Journal of Tropical Geography 38(1):5–24.
- DO Fuller, K Murphy (2006) The ENSO-fire dynamic in insular Southeast Asia. Clim Change 74(4): 435-455.
- S Nurdiati, A Sopaheluwakan, P Septiawan (2022) Joint Distribution Analysis of Forest Fires and Precipitation in Response to ENSO, IOD, and MJO (Study Case: Sumatra, Indonesia). Atmosphere (Basel) 13(4): 537.
- IDGA Putra, et al. (2022) Development of climate zones for passive cooling techniques in the hot and humid climate of Indonesia. Build Environ 226(2):09698.
- S Carver, N Mikkelsen, J Woodward (2002) Long-term rates of mass wasting in Mesters Vig, northeast Greenland: Notes on a resurvey. Permafr Periglac Process 13(3): 243-249.
- HE Beck, NE Zimmermann, TR McVicar, N Vergopolan, A Berg, et al. (2018) Present and future köppen-geiger climate classification maps at 1-km resolution. Sci Data 5: 1-12.
- Nahas A (2013) Identifying and Characterizing the Urban Heat Island in Jakarta. Master thesis. Australian National University, Canberra, Australia, December 6.
- N Saji, B Goswami, P Vinayachandran, T Yamagata (1999) A dipole mode in the Tropical Ocean. Nature 401(6751):360-363.
- S Kobayashi, et al. (2015) The JRA-55 reanalysis: General specifications and basic characteristics. Journal of the Meteorological Society of Japan Ser II 93(1): 5-48.
- K Wolter, MS Timlin (1993) Monitoring ENSO in COADS with a seasonally adjusted principal component index. Proceedings of the 17th Climate Diagnostics Workshop pp. 52–57.
- Wolter K, Timlin MS (2012) Measuring the Strength of ENSO Events: How Does 1997/98 Rank? Weather 53: 315-324.
- K Wolter, MS Timlin (2011) El Niño/Southern Oscillation behaviour since 1871 as diagnosed in an extended multivariate ENSO index (MEI.ext). International Journal of Climatology 31(7):1074-1087.
- T Zhang, et al. (2019) Towards Probabilistic Multivariate ENSO Monitoring. Geophysical Research Letters 46(17–18): 10532-0540.
- Derrick TR, Thomas JM (2004) Time-Series Analysis: The cross-correlation function. In: Innovative Analyses of Human Movement. pp. 189-205. Stergiou N (ed) Human Kinetics Publishers, Champaign, Illinois. Posted with permission.
- Roepstorff G (1994) Fourier Decomposition. In Path Integral Approach to Quantum Physics. Springer Berlin/Heilderberg, Germany pp. 150-169.
- Y Shrivastava, B Singh (2019) A comparative study of EMD and EEMD approaches for identifying chatter frequency in CNC turning. European Journal of Mechanics - A/Solids 73: 381-393.
- Thomas MW (2021) Noise Reduction for LSTM using Wavelet Transform and Singular Spectrum Analysis. Leland Stanford Junior University, Stanford, CA.
- MY Lin, CC Tai, YW Tang, CC Su (2011) Partial discharge signal extracting using the empirical mode decomposition with wavelet transform. 7th Asia-Pacific Int Conf Light. APL2011. 2011, pp. 420-424.
- NE Huang, et al. (1998) The empirical mode decomposition and the Hubert spectrum for nonlinear and nonstationary time series analysis. Proc R Soc A Math Phys Eng Sci 454(1971): 903-995.
- H Ge, G Chen, H Yu, H Chen, F An (2018) Theoretical analysis of empirical mode decomposition. Symmetry 10(11): 623.
- MA Colominas, G Schlotthauer, ME Torres (2014) Improved complete ensemble EMD: A suitable tool for biomedical signal processing. Biomed Signal Process Control 14(1): 19-29.
- E Aldrian, LD Gates, FH Widodo (2003) Variability of Indonesian Rainfall and the Influence of ENSO and Resolution in ECHAM4 Simulations and in the Reanalyses. MPI Rep 346, [Online]. Available: https://mpimet.mpg.de/fileadmin/publikationen/Reports/max_scirep_346.pdf.
- Supari, F Tangang, L Juneng, E Aldrian (2017) Observed changes in extreme temperature and precipitation over Indonesia. Int J Climatol 37(4): 1979-1997.
- Supari, F Tangang, E Salimun, E Aldrian, A Sopaheluwakan, et al. (2018) ENSO modulation of seasonal rainfall and extremes in Indonesia. Clim Dyn 51(7–8): 2559-2580.
-
Radyan Putra Pradana *, Han Soo Lee*, Tetsu Kubota, Vinayak Bhanage and Faiz Rohman Fajary etc all.. Impacts of the Asian Australian Monsoon and Indo Pacific Sea Surface Temperature on Urban Climates in Major Indonesian Cities for Low Carbon Building Design. Adv in Hydro & Meteorol. 1(5): 2024. AHM.MS.ID.000522.
-
Global population, Energy consumption, Global warming, Climate change, Pacific Oceans, Agricultural sector, Rainfall, Meteorological stations, Urban climate
-

This work is licensed under a Creative Commons Attribution-NonCommercial 4.0 International License.


