 Research Article
Creation and Assessment of an Index for Atmospheric Blockings in Brazil’s Central Region
Marcio Cataldi1,2*, Eric Miguel Ribeiro2, Lis Silveira Andrade2, Augusto Pandolfi de Lima2, Gabriel Lucas Monteiro de Almeida2 and Talita Reis Antunes Pereira3
1Regional Atmospheric Modeling Group (MAR), Physics of the Earth, Department of Physics, Regional Campus of International Excellence (CEIR) “Campus Mare Nostrum”, University of Murcia, Murcia, Spain
2Climate System Monitoring and Modeling Laboratory (LAMMOC), Water Resources and Environmental Engineering, Federal Fluminense University, Rio de Janeiro, Brazil
3Ambmet Consultoria Ltda, Startup, Incubadora de empresas UFF, Niterói, Brasil
Marcio Cataldi, Climate System Monitoring and Modeling Laboratory (LAMMOC), Water Resources and Environmental Engineering, Federal Fluminense University, Rio de Janeiro, Brazil.
Received Date: February 20, 2024; Published Date: March 01, 2024
Abstract
The management of electricity in Brazil is conducted in an integrated manner to ensure security and economy. The system generation capacity is primarily composed of hydroelectric plants distributed in different regions of the country. However, in recent years, the precipitation regime in the country and, consequently, water availability have shown significant changes in climatological patterns, putting water storage in a critical situation, particularly in the northeast region. Therefore, we analyzed whether the occurrence of atmospheric blocks is becoming more frequent and affects the precipitation regime patterns. The main goal is to develop an index to assess atmospheric block occurrence through vorticity at 850 hPa and 500 hPa and geopotential anomaly variables and to investigate other mechanisms that are related to the increase in blockage occurrence rate. Based on these data extracted from the ERA5 reanalysis, it was possible to establish an index and climatology of atmospheric blocks over South America. The index was created for seven regions of Brazil, and climatology was used to obtain geopotential anomalies for the period 1980-2010. By analyzing the index, it was possible to see how atmospheric blockades in central Brazil were more frequent and persistent from 2010 to 2023, with approximately 150% more atmospheric blocking observed in this period relative to the period from 1960-1980.
Keywords:Atmospheric blockings; Precipitation regime; drought; Climate Changes
Introduction
Brazil’s electric energy system is a large hydro-thermo-wind matrix, with a predominance of hydroelectric plants, the so-called National Interconnected System (NIS). The installed generation capacity of the SIN is mainly composed of hydroelectric plants distributed in sixteen hydrographic basins in different regions of the country (ONS, 2020) and its interconnection allows the energy transfer between subsystems and explores the diversity between the hydrological regimes of the basins, warranting the country market to be served safely and economically.
Brazil’s vast territory encompasses several climatic zones, leading to significant regional differences in how climate change impacts rainfall patterns. In the Amazon, for example, there has been an observed increase in the frequency and intensity of droughts, undermining the health of the rainforest [1]. Southeastern and southern parts of the country have experienced variable changes, with periods of severe drought interspersed with heavy rainfall events causing flooding and landslides [2-4]. Concomitantly, the northeast region is trending towards dryer conditions during the last decades, leading to critical land cover changes and concerning increases in desertification susceptible areas [5, 6]. The current climate scenario infringes great economic losses and emphasizes social inequalities to Brazil [7-9]. Also considering the sequence of years with adverse hydrological conditions, the NIS is placed under great operational pressure, therefore increasing the hydrological insecurity and energy availability [10] (ONS, 2019).
Because of its geographic position, the Brazilian climate is influenced by multiple meteorological features, such as the El Niño-Southern Oscillation (ENSO), Intertropical Convergence Zone (ITCZ), South Atlantic Subtropical Anticyclone (SASA), and South Atlantic Convergence Zone (SACZ) [11, 12]. In this study, we focused on the influence of the South Atlantic Subtropical Anticyclone, which is associated with the descending branch of the Hadley Cell in Atlantic Ocean and characterized by a high-pressure center [13] being a central climate driver to the Brazilian climate regime [14]. The SASA, for instance, contributes to moist conditions in the southeastern region of Brazil when it is summer in the Southern Hemisphere, when SASA retracts eastward from South America’s coast, and drier during winter, when the feature moves towards the continent [15].
Blocking events are often associated with drier and hotter days. Some of them pointed out past decade imposing severe weather conditions [16- 20].
Although atmospheric blocking definitions may vary among authors, their classification matches similar minimum criteria in terms of persistence, which can be found to be over three or more consecutive days of transient obstruction, positive 500hPa and 1000hPa positive geopotential height anomalies [21] 500hPa positive geopotential height anomalies. Westerly winds and wind vorticity also seem to play an important role in the blocking lifetime maintenance [22,23]. Many authors use 10 to 20 days of persistence to define an atmospheric blocking event, but these addresses north hemisphere events. The main difference between hemispheres occurs due to stronger westerly winds activity in the SH: the blocking high lifetime tends to be shorter than that in the NH [21].
In recent decades the global atmospheric circulation has been subject to robust trends associated to stratospheric ozonedepletion and tropospheric warming. These trends were found in both hemispheres and accounts for the Hadley cell, tropical belt and dry-zones expansion, mid-latitude westerly winds speed augment, eastward position displacement plus intensified SASA influence over South America continent and SACZ poleward shift [23-31]. These atmospheric circulation trends, associated with more persistent weather patterns in mid-latitudes [32] deeply affect the rainfall patterns over South America and Brazil, having the potential to affect not only the Brazilian economy, but also the energetic security and population health.
Methodology
Vorticity at the 850hPa and 500hPa levels, as well as the geopotential anomaly at 500hPa were considered to produce this index, as can be seen in the diagram in figure 1. The basis for calculating the geopotential anomaly was the period between 1980-2010, using data from ERA 5 with 0.25°x0.25° horizontal resolution, for all variables.
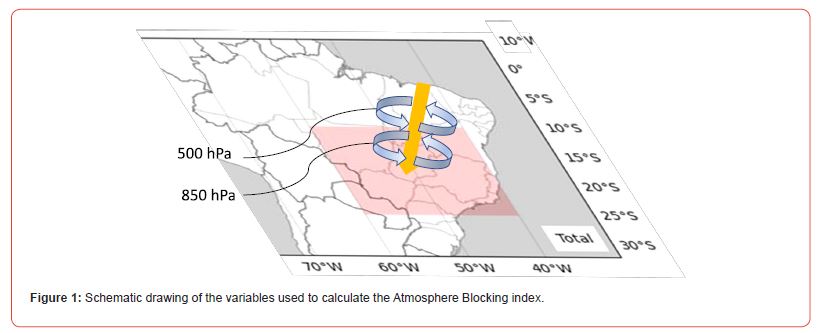
A blocking episode was considered whenever the three atmospheric parameters analyzed had a positive value, physically representing a vorticity with a vertical structure at low and medium levels, at least between 850hPA and 500hPa, and a descending air anomaly, represented by the positive geopotential anomaly. Whenever these positive values remained for more than three days, the index was assigned a value of 1. This value was added over the course of the month until one of the three parameters was no longer positive, returning the index value to zero. Thus, the number of days with blockings in each month of the year was calculated.
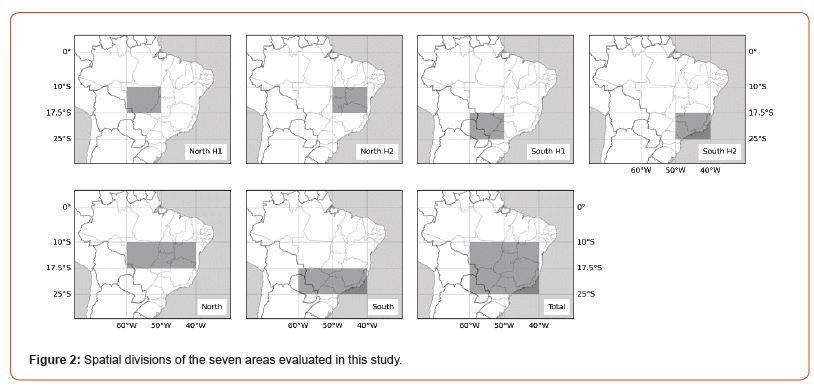
Seven areas were created for this calculation, as illustrated in Figure. 2. The choice of area was based on the observation of the synoptic patterns identified here as blockings, based on the 20- year experience of one of the authors as an operational weather forecaster. In addition, the Total Area is approximately 70% of Brazil’s water storage capacity for hydroelectric generation, which is one of the highest population densities and highly dependent
Results
The results of this study aimed to assess the quantitative evolution of the occurrence of atmospheric blocking over Brazil in the seven areas analyzed, according to the methodology described in Section 2.
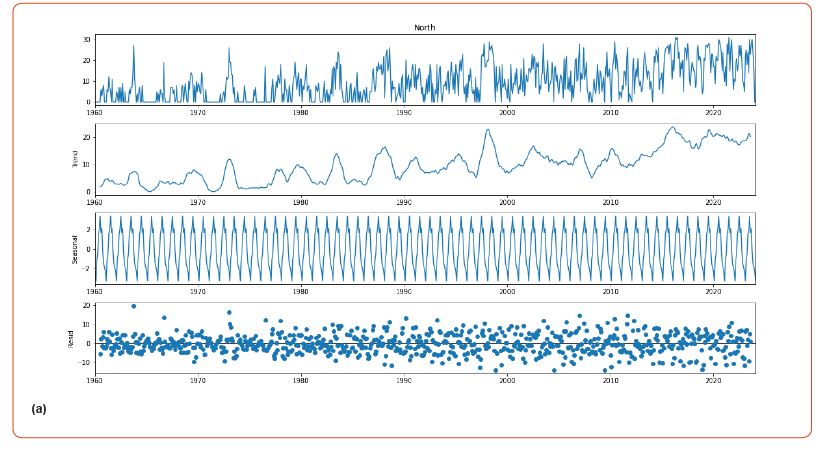
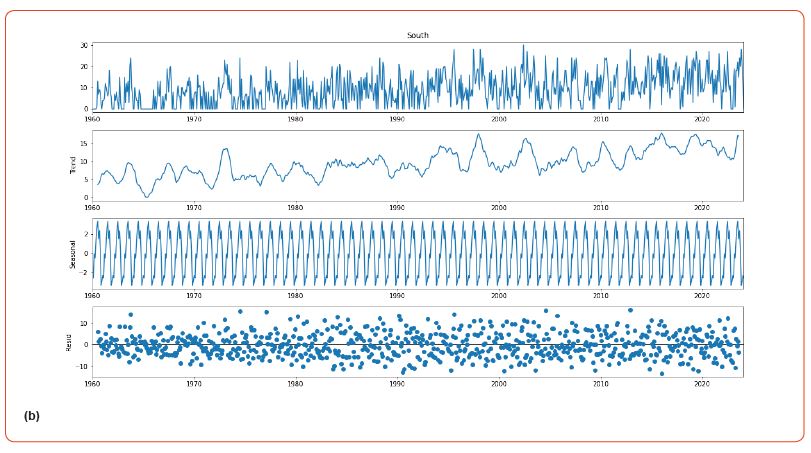
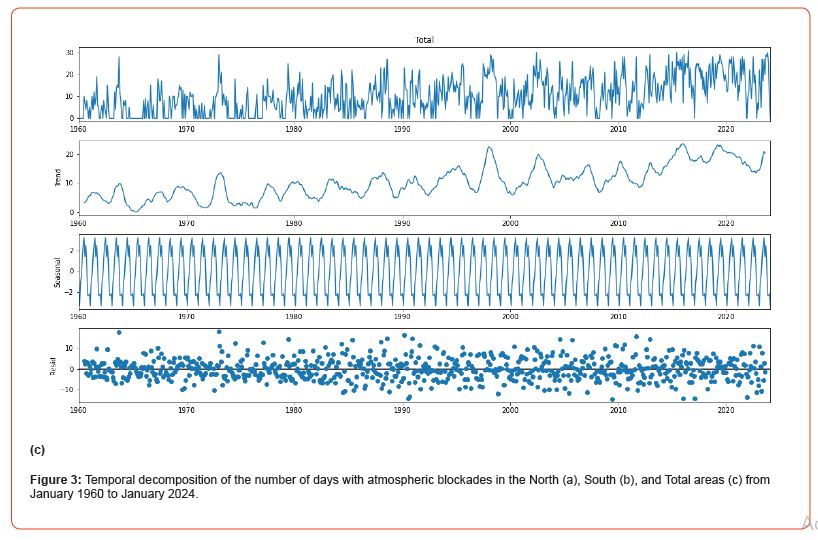
First, we can see the temporal decomposition of the blockade series from January 1960 to February 2024 (Figure 3) for three of the seven regions analyzed, since the trend pattern observed in the North H1 and H2 areas was very similar to that of the Total North area, as was the case for the South area. In all three areas, there was a slight increase in the number of days with atmospheric blocking between 1980 and 2000, and a more marked increase from 2010 onwards, especially in the northern and total areas. In the South, this increase can also be observed, but it is smoother.
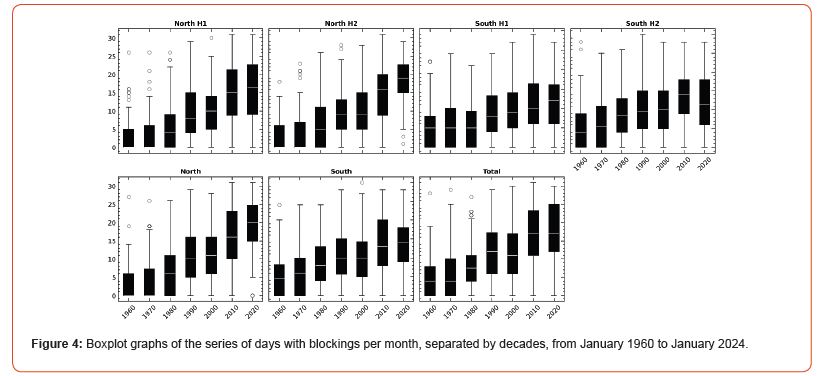
To quantify this trend, boxplot graphs were drawn to show the evolution of the median and variability of the number of days per month with atmospheric blockings over the last few decades (Figure 4). It should be noted that only the period from January 2020 to January 2024 was considered for 2020s.
The most significant increase in the median number of blocked days occurred in the North area and its two sub-areas (H1 and H2), where the median, which was close to three days per month in the 1960s and the 1970s, rose to 15 days between 2010 and 2020, and 20 days in the first three years of 2020. It is worth noting that in these regions, the median, from 2010 onwards, was often in the accumulated probability of outliers in the first two decades. A significant change could also be seen in the other regions, with the median number of days with blockings ranging from around 5 days a month to around 13 days a month in the South area and its subareas, and from around 3 days in the total area in the first decades to 18 days a month from 2010 onwards.
These values show an extremely strong trend in the number of days with blocking per month in these regions, with the median plus one standard deviation reaching almost 25 days per month in most regions, whereas it was close to 8 days in the first two decades.
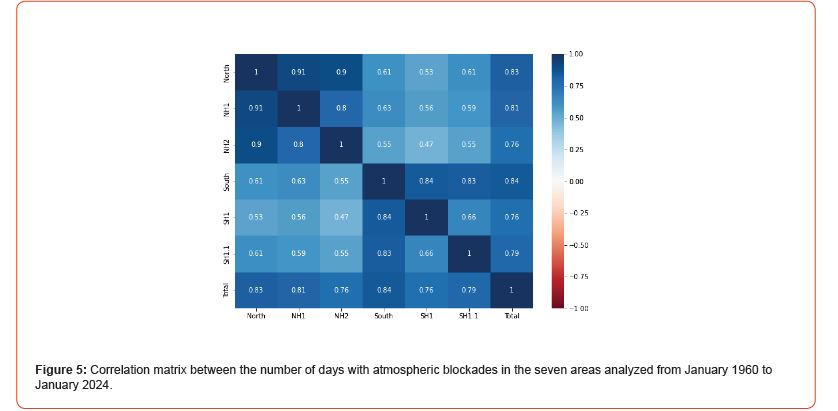
The correlation matrix between the number of blockades over the entire period analyzed (Figure 5) shows that there is a high correlation between the Total area and the other areas, but a much less significant correlation between the North and South areas, especially in relation to their sub-areas, indicating that there is also a regional factor in the occurrence of atmospheric blockades.
Conclusion
There has been a notable increase (around 150 %) in the number of days with blockings in all the regions analyzed since 2010, demonstrating that the index is consistent with the water crisis experienced by the country during this period.
Therefore, we conclude that the index can be used as a good indicator of periods of water deficit in Brazil and can be used quantitatively in studies aimed at identifying, for example, which teleconnection patterns may influence this type of water deficit as well as the influence of deforestation, fires in the Amazon, and the changing climate on the increase in the number of blocked days in these regions.
Another important point that should be analyzed is the regional and seasonal behavior of atmospheric blockades, which can be associated with different forcings in the climate system.
Acknowledgements
The authors would like to thank their lab mates Reginaldo Ventura de Sá, William Cossich and Rafael Barros for their valuable contributions throughout development.
The author Marcio Cataldi would also like to thank “Programa para la recualificación del sistema Universitario Español durante el trienio 2021-2023 – Convocatória Maria Zambrano” funded by the European Union – NextGeneration EU for providing the knowledge exchanges and the necessary conditions to carry out this study.
Finally, the authors would like to thank the Brazilian National Council for Scientific and Technological Development (CNPQ) for its financial support through project number 406871/2022-1 entitled “Development of socio-environmental vulnerability maps to climate extremes using Earth system modeling techniques”.
Conflict of Interest
No conflict of interest.
References
- Marengo JA, Borma LS, Rodriguez DA, Pinho P, Soares WR, et al. (2013) Recent Extremes of Drought and Flooding in Amazonia: Vulnerabilities and Human Adaptation. American Journal of Climate Change 02: 87-96.
- Ávila A, Justino F, Wilson A, Bromwich D, Amorim M (2016) Recent precipitation trends, flash floods and landslides in southern Brazil. Environmental Research Letters 11.
- Grimm AM, Almeida AS, Beneti CAA, Leite EA (2020) The combined effect of climate oscillations in producing extremes: the 2020 drought in southern Brazil. RBRH 25.
- Marengo JA, Ambrizzi T, Alves LM, Barreto NJC, Simões Reboita M, et al. (2020) Changing Trends in Rainfall Extremes in the Metropolitan Area of São Paulo: Causes and Impacts. Frontiers in Climate 2.
- da Silva V de PR (2004) On climate variability in Northeast of Brazil. Journal of Arid Environments 58: 575-596.
- Vieira RMDSP, Tomasella J, Barbosa AA, Martins MA, Rodriguez DA, et al. (2021) Desertification risk assessment in Northeast Brazil: Current trends and future scenarios. Land Degradation and Development 32: 224-240.
- Tebaldi E, Beaudin L (2016) Climate change and economic growth in Brazil. Applied Economics Letters 23: 377-381.
- Fang J, Lau CKM, Lu Z, Wu W, Zhu L (2019) Natural disasters, climate change, and their impact on inclusive wealth in G20 countries. Environmental Science and Pollution Research 26: 1455-1463.
- Zilli M, Scarabello M, Soterroni AC, Valin H, Mosnier A, et al. (2020) The impact of climate change on Brazil’s agriculture. Science of the Total Environment 740.
- Getirana A, Libonati R, Cataldi M (2021) Brazil is in water crisis — it needs a drought plan. Nature 600: 218-220.
- Poveda G, Mesa OJ (1997) Feedback between Hydrological Processes in Tropical South America and Large-Scale Ocean–Atmospheric Phenomena. Journal of Climate 10: 2690-2702.
- Reboita MS, Alonso Gan M, Porfírio R, Rocha DA, Ambrizzi ET (2010) Regimes De Precipitação Na América Do Sul: Uma Revisão Bibliográ
- Seager R, Murtugudde R, Naik N, Clement A, Gordon N, Miller J (2003) Air–Sea Interaction and the Seasonal Cycle of the Subtropical Anticyclones. Journal of Climate 16: 1948-1966.
- Gomes L de MJ, Freitas ACV (2020) Changes in the regional hadley circulation and in the south atlantic subtropical high in a global warming Scenario. Anuario do Instituto de Geociencias 43: 227-239.
- Reboita MS, Ambrizzi T, Silva BA, Pinheiro RF, da Rocha RP (2019) The south atlantic subtropical anticyclone: Present and future climate. Frontiers in Earth Science 7.
- Luiz Silva W, Nascimento MX, Menezes WF (2015) Atmospheric Blocking in the South Atlantic during the Summer 2014: A Synoptic Analysis of the Phenomenon. Atmospheric and Climate Sciences 05: 386-393.
- Coelho CAS, de Oliveira CP, Ambrizzi T, Reboita MS, Carpenedo CB, et al. (2016) The 2014 southeast Brazil austral summer drought: regional scale mechanisms and teleconnections. Climate Dynamics 46: 3737-3752.
- Rodrigues RR, Woollings T (2017) Impact of Atmospheric Blocking on South America in Austral Summer. Journal of Climate 30: 1821-1837.
- Silva DA, Dottori M (2021) The atmospheric blocking influence over the South Brazil Bight during the 2013–2014 summer. Regional Studies in Marine Science 45.
- Gomes MS, Cavalcanti IF de A, Müller GV (2021) 2019/2020 drought impacts on South America and atmospheric and oceanic influences. Weather and Climate Extremes 34.
- Trenberth KF, Mo KC (1985) Blocking in the Southern Hemisphere. Monthly Weather Review 113: 3-21.
- Nakamura H, Nakamura M, Anderson JL (1997) The Role of High- and Low-Frequency Dynamics in Blocking Formation. Monthly Weather Review 125: 2074-2093.
- Luo D, Zhang W, Zhong L, Dai A (2019) A nonlinear theory of atmospheric blocking: A potential vorticity gradient view. Journal of the Atmospheric Sciences 76: 2399-2427.
- Kang SM, Polvani LM (2011) The interannual relationship between the latitude of the eddy-driven jet and the edge of the Hadley cell. Journal of Climate 24: 563-568.
- Polvani LM, Waugh DW, Correa GJP, Son SW (2011) Stratospheric ozone depletion: The main driver of twentieth-century atmospheric circulation changes in the Southern Hemisphere. Journal of Climate 24: 795-812.
- Cai W, Cowan T, Thatcher M (2012) Rainfall reductions over Southern Hemisphere semi-arid regions: The role of subtropical dry zone expansion. Scientific Reports 2.
- Lucas C, Nguyen H, Timbal B (2012) An observational analysis of Southern Hemisphere tropical expansion. Journal of Geophysical Research Atmospheres 117.
- Schmidt DF, Grise KM (2017) The Response of Local Precipitation and Sea Level Pressure to Hadley Cell Expansion. Geophysical Research Letters 44: 10,573-10,582.
- Nielsen DM, Belém AL, Marton E, Cataldi M (2019) Dynamics-based regression models for the South Atlantic Convergence Zone. Climate Dynamics 52: 5527-5553.
- Fahad A al, Burls NJ, Strasberg Z (2020) How will southern hemisphere subtropical anticyclones respond to global warming? Mechanisms and seasonality in CMIP5 and CMIP6 model projections. Climate Dynamics 55: 703-718.
- da Fonseca Aguiar L, Cataldi M (2021) Social and environmental vulnerability in Southeast Brazil associated with the South Atlantic Convergence Zone. Natural Hazards 109: 2423-2437.
- Francis JA, Vavrus SJ (2012) Evidence linking Arctic amplification to extreme weather in mid-latitudes. Geophysical Research Letters 39.
-
Marcio Cataldi*, Eric Miguel Ribeiro, Lis Silveira Andrade, Augusto Pandolfi de Lima, Gabriel Lucas Monteiro de Almeida and Talita Reis Antunes Pereira. Creation and Assessment of an Index for Atmospheric Blockings in Brazil’s Central Region. Adv in Hydro & Meteorol. 1(4): 2024. AHM.MS.ID.000519.
-
Hydroelectric plants, Climatological patterns, Atmospheric blockings, Precipitation regime, Drought, Climate changes, Heavy rainfall, Landslides, Flooding, Temporal decomposition, Tropospheric warming
-

This work is licensed under a Creative Commons Attribution-NonCommercial 4.0 International License.


