 Research Article
Using Aerospace Methods in Soil Research
Ismatova Kh R1, Badalova AN1, Ismailov AI2, Aliyev ZH2* and Talibova SS1
1National Aviation Academy of NAA, Baku, Azerbaijan
2Institute of Soil Science and Agrochemistry of NAS of Azerbaijan, Baku, Azerbaijan
Aliyev ZH, Institute of Soil Science and Agrochemistry of NAS of Azerbaijan, Baku, Azerbaijan.
Received Date:August 20, 2019; Published Date:August 30, 2019
Annotation
One approach is proposed for the application of high-resolution aerospace images in soil science. The process of soil salinization in the pilot area of the Kura-Araks lowland is investigated. For the first time, an analysis of spectral curves based on data from four channels of the AzerSky satellite and an extended range of the electromagnetic spectrum based on eight channel satellite WorldView2 is given for this territory. The analysis of spectral curves and the use of other methods (calculation of indices, filtration, the principal component method, classification) made it possible to more accurately separate soils with varying degrees of salinity and reveal features of the course of the spectral curves of soils and vegetation on areas saline to varying degrees.
Keywords: Spectral analysis and curves; Image processing methods; Classification; Soil separation by salinity
Introduction
The use of aerospace techniques in soil science gave a significant impetus to the development of soil mapping and monitoring of soil cover. Back in the 30s of the twentieth century, there were significant opportunities for the use of remote images in the preparation of detailed soil maps and for assessing the state of crops. Remote methods for studying the soil cover are based on the fact that different in origin and degrees of secondary changes in the soil in different ways reflect, absorb and emit electromagnetic waves from different zones of the spectrum. As a result, each soil object has its own spectral-brightness image captured on aerial and space images. The ground-based spectral reflectivity has been adequately studied, and in this connection one should refer to the fundamental works of I. I. Karmanov, who measured spectral reflection coefficients in the range 400–750 nm with a spectrophotometer SF-10 more than 4 thousand s. soil samples and other authors [1-6].
In this paper, we consider such an acute problem for agriculture as soil salinization, which can be natural and anthropogenic, primary and secondary. The process of soil salinization is an environmental problem in the Kura-Araks lowland in Azerbaijan. The scientific idea of the work was based on the study of the spectral characteristics of soils with varying degrees of salinization according to high-resolution and ultra-high resolution multizonal satellite images such as AZERSKY (SPOT 7) and WORDVIEW2. Works on this topic were carried out within the framework of the project “Science Development Fund” under the President of the Republic of Azerbaijan, code EİF-2013-9 (15) -46/17/1-M-27. The images were provided by Azerkosmos OJSC within the framework of this project.
Background
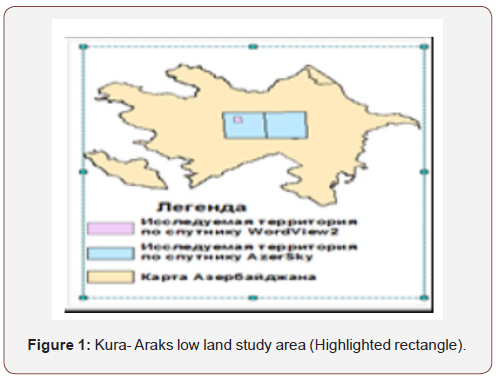
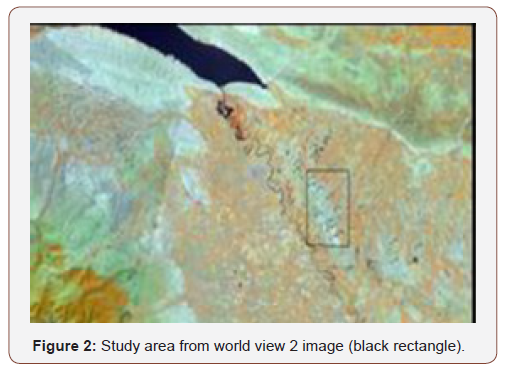
The pilot site where the research was conducted is shown in Fig. 1 and fig.2. The AZERSKY images (SPOT 7, 6m, 1.5m, 4 spectral channels and one panchromatic) allowed to cover a large area, but the information on the spectrum was limited to the visible and infrared range. Unlike AZERSKY, the spectrum of WORDVIEW2 (MS: 2m, PAN: 0.5) has 8 spectral ranges of electromagnetic radiation, but due to the high cost, it is limited in terms of the image order area. Also, field measurements were carried out, and the results of their analysis are included as informational support for the interpretation of images (Figure 1&2).
Characteristics of the study area
Questions about the origin of huge masses of salts contained in soils, soils, and groundwater are of considerable interest for the reclamation of the saline lands of the Kura-Araks lowland. Previously F.P. Savarensky (1929), V.A. Priklonsky (1948), V.R. Volobuev (1946), as the main natural sources of salt in the groundwater of the Kura-Araks lowland, pointed to the groundwaters of the foothills, bringing with them dissolved products of weathering of the bedrock, to the waters of the Hen and Arax (natural, infiltration, irrigation), as well as on sea water, filtered under special conditions [2,7,8]. The presence of bicarbonate-calcium-sodium waters in the Karabakh plain is explained by the groundwater being fed by the waters of the Minor Caucasus native rocks. At present, the secondary (anthropogenic) salinization of the soils of this territory is developing [1].
Undoubtedly, the methods of reclamation measures will be fundamentally different for each genetic form of salinization, among which the most common in the Kura-Araks lowland are: talus, cone and alluvial. Land reclamation techniques in the republic are mainly developed for these forms of salinization and accumulated full-time material research, design studies [1,11]. Hence, the interest in solving environmental monitoring tasks using aerospace monitoring methods is fully justified.
The study of the spectral characteristics of soils of varying degrees of salinity
To study the spectral characteristics of different degrees of soil salinity, the ENVI 5.2 and ARCGIS10.3 software packages were used. The character and level of the spectral curves were studied from the AZERSKY and WORDVIEW2 images, which made it possible to reliably determine the genetic differences of the soil. The novelty of our research was that we include in the research process an extended range of the electromagnetic spectrum through the use of information from the modern WORDVIEW2 satellite with 8 spectral channels.
However, it is not always possible visually, directly from a satellite image, to detect the presence of soils of various types in the field under study. The actual task of research on the problem of soil deciphering is the scientific substantiation of the method of synthesizing images obtained in different spectral ranges and the use of mathematical models for their processing
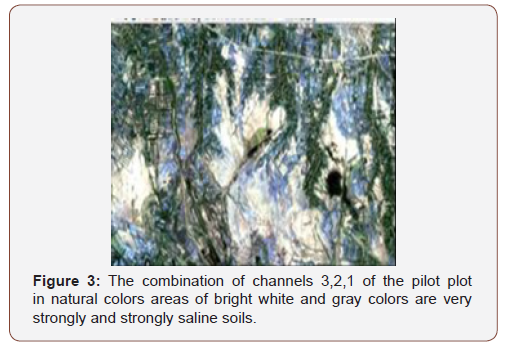
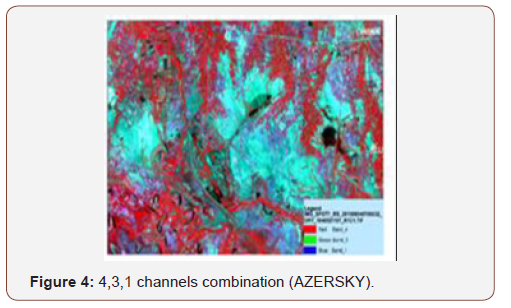
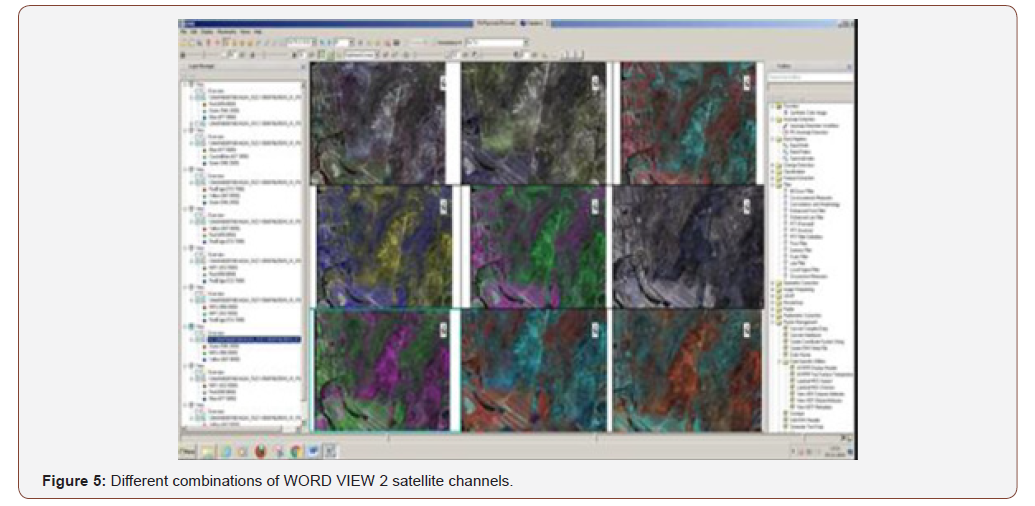
Each spectral channel carries certain information, various combinations of spectral ranges display different properties of the combined channels in color (Fig.3,4,5). Analysis of the combinations of spectral channels shows that the addition of an infrared channel (4th channel, AZERSKY, 7 and 8 channels WORDVIEW2) allows you to select different color contrasts of soil and vegetation. After analyzing all the spectral channels of the AZERSKY satellite for visual interpretation, the most adequate for the task is the combination 4,3,1 (Figure 4) Where the vegetation cover is markedwith red and shades of red, and different states of soil are light gray and lilac) (Figure 3&4).
The analysis of various combinations of the 8-channel WORD VIEW 2 satellite (Figure 5) was also conducted. From different variants of synthesizing in the RGB system various soil types: non-saline background soils, saline, solonchaks and salt licks during in the eight-channel survey, good separability is observed when synthesizing channels in extremely red (705–745nm); near infrared1 (NIR1; 770–895nm); Yellow (Yellow; 585-625nm): near infrared2 (NIR2; 860–1040 nm) wavelength ranges. The combination of channels 7,5,3 and 7,3,2 provide good contrast of vegetation and soils of different types, the combination of channels 8,7,6 is very different from other combinations, as it mainly indicates the water content in the soil and finally, the combination of channels 8,4,1 shows the greatest contrast in soils and vegetation. It should be noted that highly saline soils are well identified in the photographs, here the problem will be to solve the problem of identifying soils with varying degrees of salinity (Figure 5).
We have investigated various types of dependence of light reflection not only on the version of synthesis, but also on the chosen mathematical model. With the help of mathematical processing methods in order to identify these patterns, not only indicators of direct scattered light reflections in certain spectral ranges were analyzed, but also various mathematical ratios of pixel brightness values in different spectral channels
Mathematical processing methods
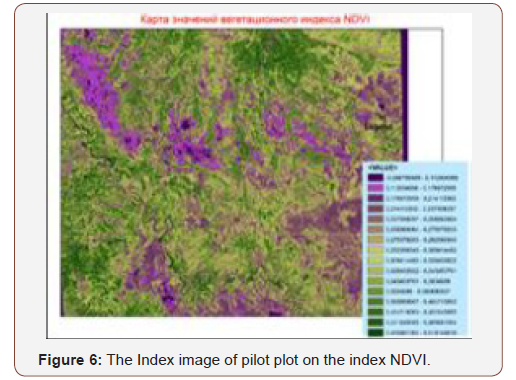
At the first stage, we choose the model for constructing an index image by calculating the normalized vegetative index NDVI. In Fig.6. The result of converting index values in the range from [-1do1] to the range of values [0-200] is given, which allows you to display them using a color scale or a color map. In Fig.7. An enlarged fragment of the index image is given with percentages of groundbased soil salinity measurements superimposed on it, which shows that the processing of the image corresponds to ground-based measurements (Figure 6&7).
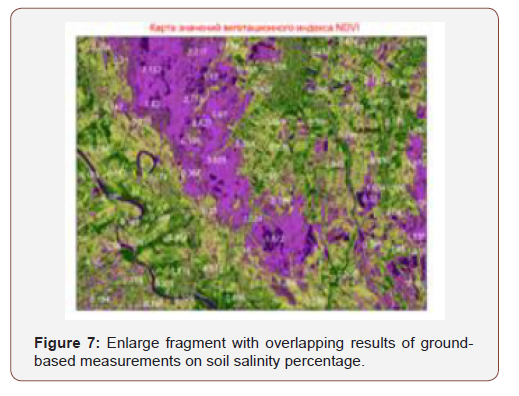
The index image more clearly distinguishes the boundaries of highly saline soils (lilac) from vegetation and other soils. At this stage, you can visually interpret the index image: values from 0.465981364 - 0.619144619 correspond to the arrays of trees in the villages, along the canals and roads. Values from 0.343450761 - 0.43194508 correspond to densely and rarely germinated crops. Values from 0.258360064 to 0.343450761 to moderately saline and slightly saline soils, values 0.112004066 to 0.258360064 to saline soils, highly saline soils and negative values are water surface and wetted saline lands. In addition to the above image transformations, the use of various filtering methods and other transformations was analyzed in the ENVI 5.2 software package (for example, the principal component method showed good separability between different soils and vegetation cover).
Information system for image interpretation
The use of modern geographic information technologies (GIS) allows you to cover the whole variety of physiographic conditions and soil forms, so that based on soil surveys. For more accurate interpretation of a satellite image and unambiguous interpretation, additional information is used (maps, literature and ground studies). To interpret the causes of the vast territories of saline lands, we digitized canals and irrigation networks, as well as rivers and with imposing it on according to the topographic maps of 1980, on the same date salt marshes and swamps. From the results of vectorization, one of the main causes of salinization (at least secondary salinization) is the irrational management of amelioration, that is, there is a high density of irrigation network 1 per km2 (Figure 8a & 8b).
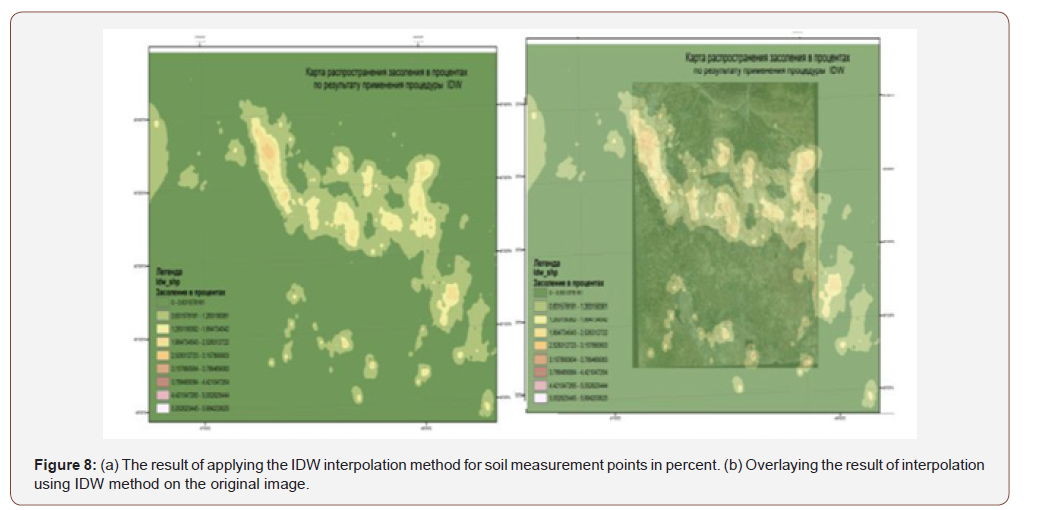
Another information field is ground-based measurement data, sampling points were recorded in the GIS with an indication of the degree of salinity in percent. Using the interpolation methods for these points, the GRID surface of the salinity zone was created (Figure8a). Comparison of ground-based measurements and information from the satellite in Figure 8b. shows the compatibility of ground-based measurements and image processing results, which allows for more accurate decoding of images.
Analysis of the spectral curves of soil and vegetation on saline lands
In the picture after the procedures of mathematical processing and uncontrolled classification, homogeneous training fragments were selected, divided into the following groups and classes (AZERSKY picture):
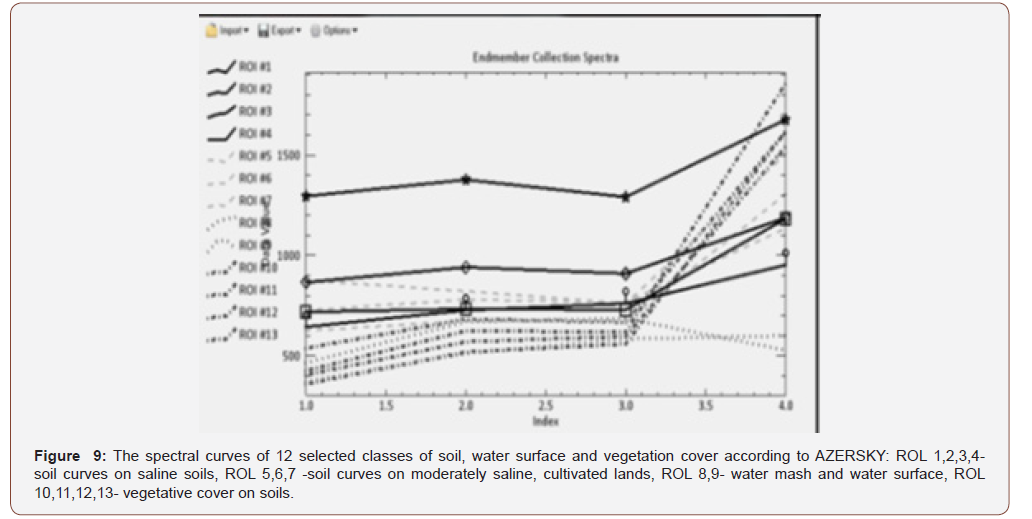
Group 1 - very strongly and strongly saline soils (salt marshes): Class 1. Solonchaks with bright white color in the picture; Klass2. Solonchaki with gray in the picture; Klass3. Solonchak moistened with a dark gray color in the picture; The next group of 2 test plots is the soil on cultivated medium and low-saline lands: Class 4. Light brown soils on cultivated medium-saline lands; Class 5. Dark brown soil on poorly cultivated lands; Grade6. Light-gray-lilac color of the soil on moderately saline cultivated land. The third group - water surfaces: Class 8. Water marshy surface; Class 9. Water of the Kura River. The fourth group - test fragments of vegetation cover and their spectral characteristics: Class 10 - herbal dense vegetation; Class 11 - grass sparse vegetation on saline soils; Class 12 - an array of trees along the riverbed; Class 13 - forest in the highlands (Figure 9).
These curves were constructed using the ENVI 5.2. PC at the base of a four-channel image of the AZERSKY satellite. Analysis of the curves shows that: very strongly saline soils (class 1, bright white color in the image, solid curve with asterisks) have the greatest reflectivity, both in the visible and in the infrared wavelength range of the electromagnetic spectrum. Vegetation curves have a low reflectivity in the visible range and increase dramatically in the infrared zone. Soil curves on moderately salinecultivated lands have a lower reflectivity than soils on highly saline soils in the visible range and a sharper rise in the infrared zone, but with less reflectivity than in heavily saline soils in salt marshes.
Curve water surface p. The hen has a sharp decrease in the infrared zone, and the swampy water surface is a smooth rise from the visible to the infrared zone. Soil curves on moderately saline cultivated lands have a lower reflectivity than soils on highly saline soils in the visible range and a sharper rise in the infrared zone, but with less reflectivity than in heavily saline soils in salt marshes. Curve water surface p. The hen has a sharp decrease in the infrared zone, and the swampy water surface is a smooth rise from the visible to the infrared zone (Figure 9).
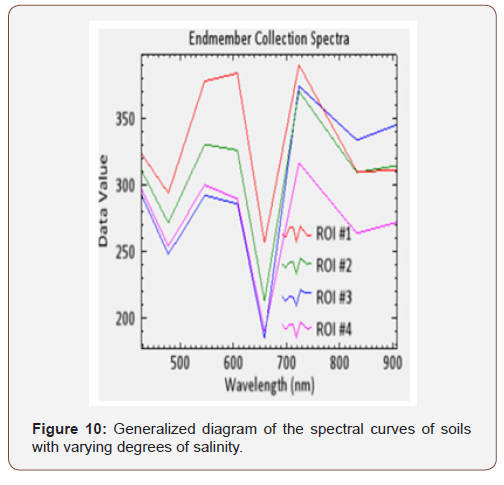
Also, spectral curves were constructed from a snapshot of an 8-channel WORDVIEW 2 satellite, which more clearly show the spectral curves in different areas of the electromagnetic spectrum and the difference in the spectral curves of vegetation and soil in two infrared regions and extremely red channels of the WORDVIEW 2 satellite: Extreme red (Red-Edge; 705–745 nm): (NIR1; 770–895 nm): (NIR2; 860–1040 nm). In Fig.10, the course of the spectral curves: class1 - very strongly saline soils on saline soils (bright white in the image), class 2 - strongly saline soils on salt marshes (gray in the picture), class 3 - soils on salt marshes with rare growing vegetation, class 4 - wetted soils on salt marshes. In fig.11. the course of the spectral curves of herbaceous vegetation: 5 is the curve of vegetation on solonet-saline, highly saline soils, 6 is the curve of densely germinated grass vegetation on medium saline, cultivated land, 7) is the curve of rarely vegeted grass vegetation on medium saline long-cultivated land (Figure 10&11).
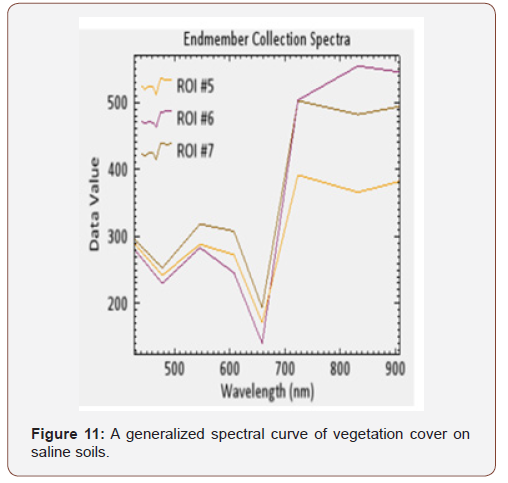
The curves constructed according to the WORDVIEW 2 satellite data show the best separation of vegetation cover and soil on cultivated land in the range of 660-900nm. The spectral curves of soil and vegetation on saline lands have one inflection point (at = 660nm) with different reflectivity values. According to the obtained spectral curves, extreme points in the behavior of the spectral reflectivity curves of saline soils and vegetation cover are points at wavelengths: 400nm, 480nm, 510nm, 610nm, 660nm, 720nm, 830nm [10-12].
Discussion of the results of the processing of space images
After selecting the optimal set of training fragments, the classification procedure was carried out. Figure 12a, b shows the result of the classification procedure for a training sample of 12 classes, which was refined by analyzing the spectral curves. Figure 12.c shows the distribution of only one class of salinization (class 1- very strongly saline soils) (Figure 12).
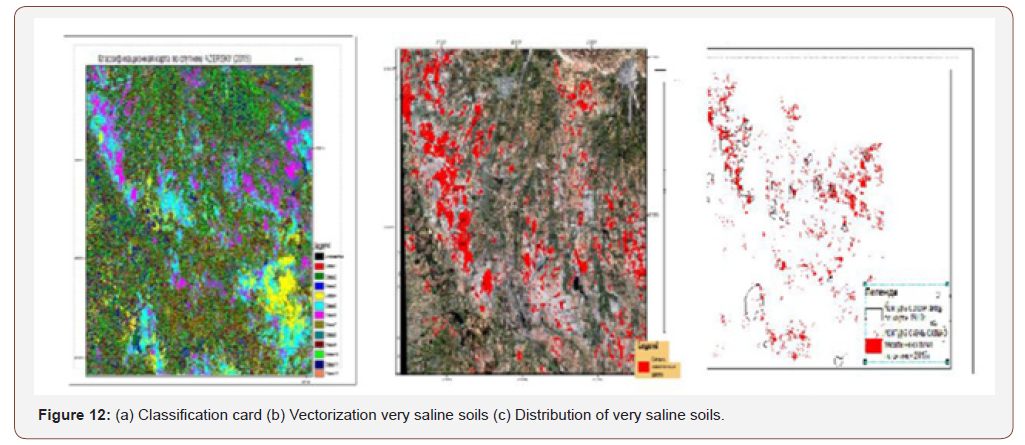
They represent territories with bright white color in the combination of 3,2,1 channel of AZERSKY and 5,3,2 images of WORDVIEW2 (red, green, blue channels). The solonchak area in this pilot area is 259.15 km2 in the 2015 survey, which is two times the solonchak area calculated when vectoring the topographic maps of 1980 is approximately 184.7 km2, that is, the area of very strongly saline soils increases, their distribution is uneven, and as they say in this case, the distribution of very strong salinization is spotted.
Conclusion
Thus, one approach to the assessment of soil salinization is considered. Researches show:
• Considered an approach when to assess the degree of soil salinity at large
• the territories used a high resolution image (in our case AzerSky, MS: 6m, Pan: 1.5m), but for the selection of test fragments of training, an image of super high resolution is used in small representative areas (WorldView2, MS: 2m, Pan: 0.5m).
• It is shown that a good separation of soils according to the degree of salinization and plant cover on saline soils is achieved in the wavelength range: 705-1040nm according to the 8- channel satellite WorldView2;
• An approach is proposed in which high accuracy of soil classification by salinity and vegetation cover is achieved based on the choice of a representative training sample using a number of preprocessing procedures: selection of the optimal channel combination, principal component method, analysis of the index image, uncontrolled classification, spectral analysis of curves and classification with training (the best indicators of the classification algorithm for maximum likelihood).
Acknowledgement
None.
Conflict of Interest
No Conflicts of Interest.
References
- Abduev MR (2003) Soil with a deluvial form of salinization and questions of their land reclamation. Because of "Ozan", Baku, 269.
- Volobuev V (1946) The main issues of the genesis and melioration of the saline lands of Azerbaijan. News of the Academy of Sciences of Azerbaijan SSR 12(3).
- Hasanov AM, Ismatova Kh R, Nagiyev P Yu, Aliyeva M (2006) Mapping of the agricultural lands of the Kura-Araks lowland based on the results of digital video processing. IKI RAS, Sat. scientific articles Modern problems of remote sensing 3(2): 300-306.
- Karmanov II (1974) Spectral reflectivity and color of soils as indicators of their properties. M Kolos 351.
- Metternicht GI, Zinck JA (2003) Remote sensing of the environment: potentials and constraints. Remote Sensing of the Environment 85(1): 1–20
- Verma K, Saxena RK, Barthwal AK, Deshmukh SN (1994) Remote Sensing Technique for Mapping Salt Affected Soils. International Journal of Remote Sensing 15(9): 1901-1914.
- Orlov DS, Vorobyova LA, Sukhanova NI (1995) Quantitative parameters of the spectral reflectivity of the soil. MSU Bulletin, Soil Science Series 42: 35-42.
- Priklonsky VA (1946) Formation of groundwater in arid areas on the example of the Kura-Araks lowland, From-of the Academy of Sciences of the USSR geological series 4.
- Mikailov NK (2000) Natural and geographical features and ecological features of soil salinization in the Kura-Araks lowland, the problem of land reclamation and assessment of their fertility. And in Ozan Baku 375.
- Ismatova KhR (2017) It is a view of the field of soil and other technologies for soil science. Austrian journal of technical and science sciences 5(6): 3-10.
- Knizhnikov Yu F, Kravtsova V I (1990) The principle of multiplicity in modern aerospace methods and methods for decoding a series of images in agricultural research. Aerospace methods in soil science and their use in agriculture. M Nauka S 47-54.
- Savarensky FP (1929) The Kura-Araks lowland and its groundwater and the processes of their salinization. Soil Science 1-2.
-
Aliyev ZH, Ismatova Kh R, Badalova AN, Ismailov AI, Talibova SS. Using Aerospace Methods in Soil Research. Arch Biomed Eng & Biotechnol. 2(4): 2019. ABEB.MS.ID.000545.
-
Bourneville syndrome, Tuberous sclerosis complex disorder, TSC1 & TSC2 genes, Genetics Disorder, Bourneville syndrome, Skin, Brain, Kidneys, Tuberous sclerosis, Facial tumors, Angiofibromas
-

This work is licensed under a Creative Commons Attribution-NonCommercial 4.0 International License.


